Key Points
Panobinostat induces responses in 28% of patients with relapsed and refractory DLBCL that are typically durable off therapy.
MEF2B mutations predicted for response whereas early increase in ctDNA abundance was a strong predictor of subsequent treatment failure.
Abstract
The majority of diffuse large B-cell lymphoma (DLBCL) tumors contain mutations in histone-modifying enzymes (HMEs), indicating a potential therapeutic benefit of histone deacetylase inhibitors (HDIs), and preclinical data suggest that HDIs augment the effect of rituximab. In this randomized phase 2 study, we evaluated the response rate and toxicity of panobinostat, a pan-HDI administered 30 mg orally 3 times weekly, with or without rituximab, in 40 patients with relapsed or refractory de novo (n = 27) or transformed (n = 13) DLBCL. Candidate genes and whole exomes were sequenced in relapse tumor biopsies to search for molecular correlates, and these data were used to quantify circulating tumor DNA (ctDNA) in serial plasma samples. Eleven of 40 patients (28%) responded to panobinostat (95% confidence interval [CI] 14.6-43.9) and rituximab did not increase responses. The median duration of response was 14.5 months (95% CI 9.4 to “not reached”). At time of data censoring, 6 of 11 patients had not progressed. Of the genes tested for mutations, only those in MEF2B were significantly associated with response. We detected ctDNA in at least 1 plasma sample from 96% of tested patients. A significant increase in ctDNA at day 15 relative to baseline was strongly associated with lack of response (sensitivity 71.4%, specificity 100%). We conclude that panobinostat induces very durable responses in some patients with relapsed DLBCL, and early responses can be predicted by mutations in MEF2B or a significant change in ctDNA level at 15 days after treatment initiation. This clinical trial was registered at www.ClinicalTrials.gov (#NCT01238692).
Introduction
Up to 40% of patients with diffuse large B-cell lymphoma (DLBCL) are not cured with standard chemoimmunotherapy or high-dose therapy and autologous stem cell transplantation.1-5 For these patients, novel therapies that harness our understanding of the molecular heterogeneity of DLBCL are needed. One such therapeutic class includes histone deacetylase (HDAC) inhibitors (HDIs), because of the high frequency of mutations in genes associated with histone-modifying enzymes (HMEs) in DLBCL.6,7 HDIs induce epigenetic changes by increasing acetylation of histones and nonhistone proteins. Mutations in HMEs can thus change the epigenetic landscape and chromatin structure, resulting in transcriptional changes.8 In DLBCL, mutations in the HMEs CREBBP, EP300, MEF2B, and MLL2 occur in ∼50% of cases, in both the germinal center B cell (GCB) and activated B cell (ABC) cell of origin (COO) subtypes,6,7,9 and EZH2 mutations are found in 22% of the GCB subtype.10 Although no association exists between HME mutation status and outcome in general,6,9,11 it has not been clinically determined whether such mutations affect response to HDI therapy. Previous trials of HDI have yielded limited responses in DLBCL,12,13 but no sequence analysis was performed, leaving an open question of whether the mutation of certain HMEs is associated with response. Beyond HME mutation status, preclinical data link HDI-induced cytotoxicity in lymphoma with their ability to modulate key targets, either through restoration of transcriptional control or direct acetylation. HDIs decrease the expression of BCL2, BCL6, and MYC,14 the overexpression of which is linked to lymphomagenesis.15 Acetylation of BCL6 inhibits its transcriptional repressive activity,16 and MYC acetylation causes increased protein turnover and instability.17 Furthermore, preclinical models suggest a mechanism for synergy between HDI therapy and rituximab.18
In this phase 2 clinical trial, we evaluated panobinostat, an orally available pan-HDI in patients with relapsed or refractory transformed or de novo DLBCL (rrDLBCL), randomized to the HDI alone or in combination with rituximab. Our study design allowed for quantitative assessment of tumor response to therapy by obtaining pretreatment (day 0) and day 15 tissue biopsies and simultaneous collection of plasma for analysis of circulating tumor DNA (ctDNA). Using these samples, we evaluated pretreatment biopsies for mutations commonly associated with DLBCL, including HME genes, as well as for COO and MYC and BCL2 expression. We used day-15 biopsies to assess for changes in H3 acetylation and expression of common lymphoma markers after therapy. Recent retrospective studies have demonstrated a strong correlation between ctDNA levels in DLBCL and tumor burden and, in particular, show the utility of monitoring fluctuations in tumor burden within patients by monitoring ctDNA levels.19,20 We sought to prospectively measure such changes between day 0 and day 15 as a means of inferring early response to therapy. This trial thus represents a comprehensive approach to predicting the response to HDI in DLBCL using emerging molecular techniques. Our methods and encouraging results presented herein may more generally inform the design of future trials for DLBCL and other solid cancers.
Methods
Study design and patient eligibility
Patients from four Canadian sites were enrolled from December 2010 to December 2013. The primary end point was overall response rate (ORR), defined as complete response (CR) and partial response (PR). Secondary end points included safety and progression-free survival (PFS). This study received research ethics approval from all participating institutions, and all patients provided written, informed consent. All authors had access to primary clinical data.
Patients 18 years and older with a diagnosis of de novo or transformed DLBCL (based on World Health Organization [WHO] criteria) were eligible if they had rrDLBCL for which no curative therapy was available, had a platelet count of ≥100 × 1012/L, adequate hepatic and renal function, Eastern Cooperative Oncology Group (ECOG) performance status 0 to 2, and measurable disease (≥1.5 cm) by computed tomography (CT) scan. Patients could not have received rituximab within 84 days or any other prior therapy within 28 days. Exclusion criteria included evidence of central nervous system disease, HIV, or hepatitis C infection.
Protocol treatment and assessment
Patients were randomized 1:1 to receive panobinostat 30 mg orally every Monday, Wednesday, and Friday alone or in combination with rituximab 375 mg/m2 IV every 3 weeks. Dose interruptions and reductions (as low as 15 mg) for adverse events were prescribed for grade 3 or 4 adverse events that were considered possibly related to panobinostat; there were no dose reductions of rituximab. All patients receiving at least one dose were evaluable for response and safety. CT scans were performed at baseline and at every other cycle to assess response using the International Workshop criteria.21 Positron emission tomography–CT scans were not routinely performed except to confirm CR in patients with prolonged PR. Treatment continued for at least 6 cycles in responders, or until unacceptable toxicity or disease progression. Adverse events were assessed throughout the trial and 28 days after treatment, discontinued, and graded using the National Cancer Institute Common Terminology Criteria for Adverse Events (v4.0).
Correlative tissue biopsies and analyses
The trial was designed to include collection of samples to facilitate mutation profile and gene expression profiling of baseline tumor, immunohistochemistry of pre/posttreatment tissues, and analysis of plasma for ctDNA. Of the 40 treated patients, 23 biopsies were obtained before day 1 dosing. For the remaining 17, we used archived frozen tissue (n = 5), paraffin-embedded tissue (n = 5), or serum (n = 7) as a source of tumor DNA and/or protein for correlative studies. Details on collection and preparation of these are reported elsewhere.22 For every biopsy, a section was stained with hematoxylin and eosin and tumor content/viability assessed. Immunostaining for BCL2, BCL6, MYC, CD20, and acetylated H3 was performed (see supplemental Methods, available on the Blood Web site, for details).
Whole-exome sequencing or relapse biopsy was performed in 23 patients; methods are described elsewhere.23 To identify mutations in the remaining patients, targeted sequencing on lymphoma-related genes and histone modifiers was performed. We sequenced either hot spots (EZH2, MEF2B) or the entire gene for CREBBP, EP300, MLL2, FAS, STAT6, and TP53 using either isolated DNA from fresh biopsies or from paraffin-embedded tissue on diagnostic biopsy. Mutation detection was also performed directly from ctDNA when tissue could not be used for either whole-exome sequencing or targeted sequencing (n = 4) (see later text and supplemental Methods).
Circulating tumor DNA was measured using a combination of hybridization-capture sequencing of lymphoma-related genes followed by deep sequencing (modeled after the CAPP-seq method)24 and droplet digital polymerase chain reaction (ddPCR) (see supplemental Materials for further details). Our strategy includes a consensus approach that assigns reads to their parental DNA molecules to enable error correction and single-molecule counting.25 The ctDNA level is represented as the fraction of DNA molecules bearing tumor-specific somatic mutations in the plasma-derived DNA (variant allele fraction [VAF]). For individual plasma samples, the level of mutant DNA was determined by calculating the mean VAF for all somatic mutations in the captured region in the matched tumor. Within samples, molecular counts for reads spanning all mutated sites were pooled and the number of mutant and wild-type DNA molecules detected were compared for significance using a one-tailed Fisher exact test (P < .05).
Statistical analysis
Each study arm had 90% power to detect a response rate of 30% vs 5% using a one-sided 0.05 level test as per the Simon optimal design.26 Up to 10 evaluable patients were to be enrolled in the first stage; if one or more responses were observed, a total of 20 patients were to be enrolled in each arm. Using a “pick-the-winner” study design, the arm with the observed higher response rate would be selected for further study.27 Continuous variables were descriptively summarized. Counts and proportions were tabulated for categorical variables. Response rate was reported as a mean with 95% confidence interval. Censored time-to-event data were summarized via Kaplan-Meier survival estimates. Logistic and Cox regression analyses were used to correlate clinical/molecular variables with response and survival using SAS V9.4 and R.
Results
Patient characteristics
Forty-two patients were enrolled and 40 received at least one dose of experimental therapy, with 21 receiving panobinostat and 19 receiving panobinostat plus rituximab. Two patients in the latter arm were not treated either for lack of lymphoma on re-biopsy or progressive thrombocytopenia. Supplemental Figure 1 describes patient disposition. Patient baseline and disease characteristics are shown in Table 1 for each arm individually and overall. The median age of patients enrolled was 59.8 years (range 28.9-78.6). Thirteen patients had transformed DLBCL from follicular lymphoma. Patients received a median of 3 prior therapies (range 1-9). All patients received prior rituximab-based chemoimmunotherapy, and 30 (75%) were refractory to their last prior therapy, defined as progression within 6 months of completion of therapy.
Efficacy
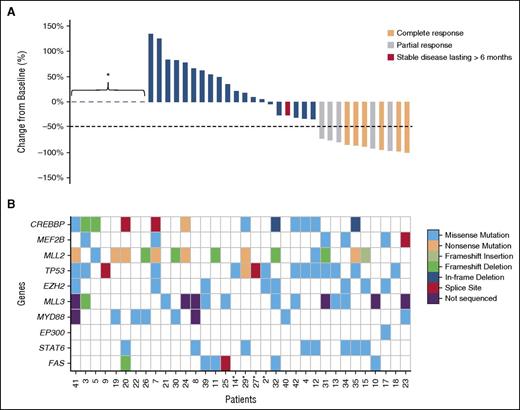
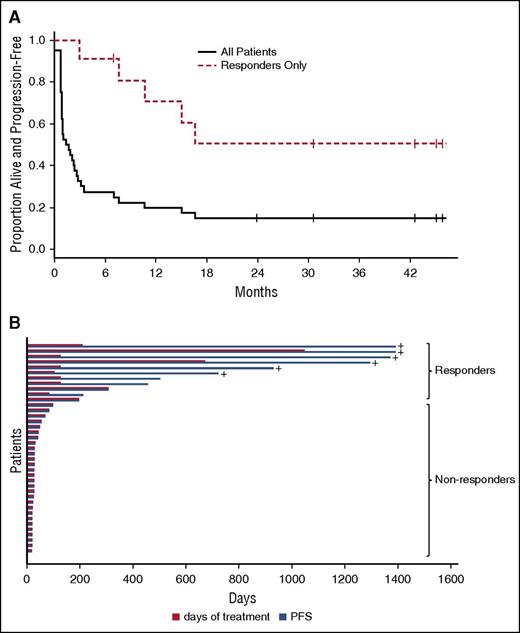
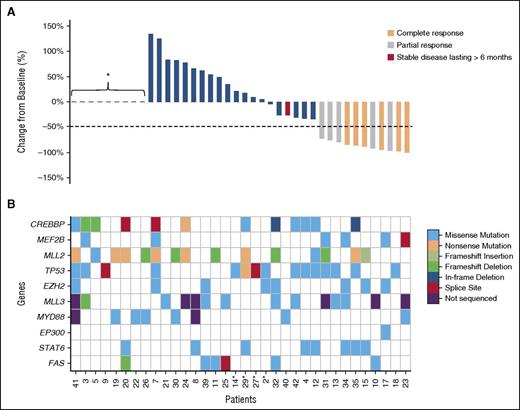
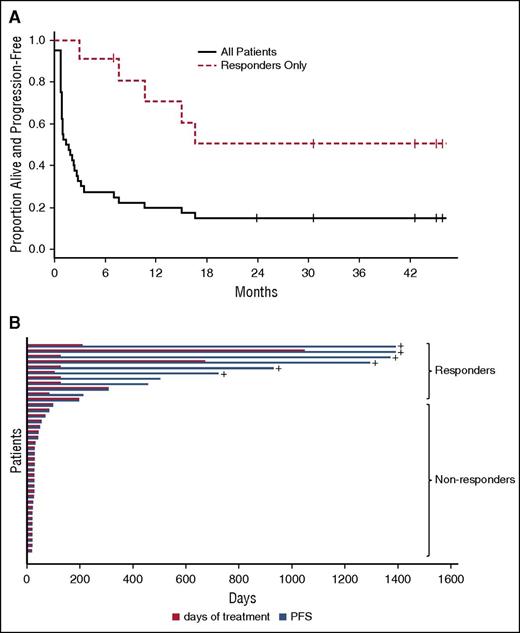
Data were censored as of November 16, 2015, 23 months after the last enrollment. Forty patients were evaluable for response. The overall response rate was 29% (95% CI 11.3-52.2) for panobinostat and 26% (95% CI 9.2-51.2) for panobinostat plus rituximab, the overall response rate for both arms was 28% (95% CI 14.6-43.9) (Table 2; Figure 1). These results suggest a lack of benefit in adding rituximab to panobinostat in this clinical setting. Seven patients had a CR and 4 a PR. All other patients progressed on treatment. The median time to response was 42 days (range 21-231). The median duration of response was 14.5 months (95% CI 9.4-“not reached”) (Figure 2) with the longest response ongoing at 43.2+ months. The overall median PFS was <3 months and the median was 14.5 months for responding patients (95% CI 9.4-“not reached”). Among the 11 responding patients, a median of 6 cycles of treatment were given (range 4-50). Five responding patients have progressed at this time, and these patients received a median of 6 cycles of treatment (range 4-13).
Responses and mutations affecting candidate genes detected in tumor or liquid biopsies. (A) This waterfall plot shows the magnitude of response calculated as percent change relative to baseline. *Patients who progressed early and did not have a response assessment. (B) Mutations detected using a combination of exome and targeted sequencing are shown for the HME genes and additional genes of interest (MYD88, STAT6, and FAS). Patients are shown with those demonstrating a sustained response on the right and are in the same order as those in (A). For 4 patients (indicated with an asterisk), plasma was used as the sole source of tumor DNA for mutation detection.
Responses and mutations affecting candidate genes detected in tumor or liquid biopsies. (A) This waterfall plot shows the magnitude of response calculated as percent change relative to baseline. *Patients who progressed early and did not have a response assessment. (B) Mutations detected using a combination of exome and targeted sequencing are shown for the HME genes and additional genes of interest (MYD88, STAT6, and FAS). Patients are shown with those demonstrating a sustained response on the right and are in the same order as those in (A). For 4 patients (indicated with an asterisk), plasma was used as the sole source of tumor DNA for mutation detection.
Overview of panobinostat response duration. (A) This shows the Kaplan-Meier progression-free survival (PFS) curve for all patients on the trial (solid line) contrasted with responders (dashed line) (N = 40 patients). (B) This plot shows treatment duration (red bar) and PFS (blue bar) or each patient. +, ongoing response at last follow-up.
Overview of panobinostat response duration. (A) This shows the Kaplan-Meier progression-free survival (PFS) curve for all patients on the trial (solid line) contrasted with responders (dashed line) (N = 40 patients). (B) This plot shows treatment duration (red bar) and PFS (blue bar) or each patient. +, ongoing response at last follow-up.
Adverse events
The most common grade 3 and higher adverse events considered related to panobinostat with or without rituximab were thrombocytopenia and neutropenia (see supplemental Table 1 for adverse events). Dose reductions were required in 23 patients (58%), dose interruptions or delays in 22 patients (55%), all for toxicity, with no difference between arms. The median panobinostat dose delivered per cycle was 212.9 mg of for both arms combined, which represents 60% of the planned dose (range 34.7%-75%, n = 38 patients). All observed serious adverse events (n = 19) were caused by disease progression. Adverse events reported as related to biopsies included bleeding (n = 3) and pain (n = 3), but none were grade 3 or 4.
Correlative molecular biomarkers of panobinostat response
We evaluated COO and immunohistochemical markers as potential biomarkers of response to panobinostat. Patients with DLBCL were categorized as either GCB or non-GCB using various methods (see supplemental Table 2), with 5 patients categorized as undetermined. No differences in response rate or PFS were seen between the 2 groups, although COO was not determined in a uniform manner for all patients, thus limiting the conclusiveness of this finding. Furthermore, no difference in response or PFS was seen between patients with transformed vs de novo DLBCL (Table 3). Patients with coexpression of MYC and BCL2 proteins (dual-expresser DLBCL, DE-DLBCL), a feature associated with a poor response to RCHOP, did not respond to panobinostat and had a significantly inferior PFS (Table 3).
We examined the potential correlation between response and the presence of mutations common in DLBCL, focusing on MLL2, MLL3, MEF2B, CREBBP, EP300, and EZH2 and additional genes of interest using data from a companion study23 and additional targeted sequencing of tissue and liquid biopsies (supplemental Table 3; Figure 1). In total, 64% of patients (25/39) had at least one mutation in any one of the HME genes, 15 had two mutations, and 6 had three mutations. In univariate analysis, patients with MEF2B mutations, representing 15.4% of those tested, showed a significant association with response to panobinostat with a likelihood ratio of 3.67 for achieving a CR or PR (95% CI 1.46-9.19). MEF2B mutations responders included those at (or adjacent to) known hot spots at D83 and Y69 and a single splice site mutation. MEF2B-mutant tumors from nonresponders also represented known hot spots (D83 and K4). No significant differences in PFS were observed for mutations in any individual HME genes, although mutations in MEF2B exhibited a trend toward improved PFS (Table 3).
We also examined genes highly mutated in rrDLBCL.23 By univariate analysis, STAT6, FAS, and TP53 did not predict for response (Table 3). Mutations in CD79A/B, observed in 4 patients, were significantly associated with nonresponse but these patients also all had DE-DLBCL. Similarly, all 3 patients with mutated PIM1 did not respond, but two had DE-DLBCL. Based on the tumor sequence data, all EZH2, MEF2B, and CREBBP mutations appeared to be clonal, whereas apparent subclonal variants were identified in each of the HMEs MLL2 and MLL3 (supplemental Table 3). Although our results are limited by the small sample size, we have identified MEF2B mutations as a significant predictor of response. A larger sample size will be needed to validate and possibly extend these findings.
Changes induced in tumor after treatment
Of the 23 patients with fresh biopsies, 14 also had a biopsy on day 15, and the remainder were unavailable because of lack of consent (n = 11), radiotherapy (n = 1), or thrombocytopenia (n = 2). Only 1 paired biopsy originated from a responder. In 8 of 14 pairs, there was an increase in the percentage of cells with H3 hyperacetylation at day 15, although the intensity of staining was weak to moderate in all cases. Thus, panobinostat acted directly on tumor cells to increase histone H3 acetylation, but this was insufficient to induce response, because the change occurred in 1 responder and 7 nonresponders (supplemental Table 4; supplemental Figure 2). Although in vitro data showed that HDI can increase CD20 expression18 and modulate the expression of BCL2, BCL6, and MYC,15-17 changes in these biomarkers were not appreciated in our samples, with the exception of MYC, which decreased in 4 cases (1 responder, 3 nonresponders), including one of the DE-DLBCLs.
We sought to assess whether ctDNA changes can inform treatment response. Paired plasma samples were collected from 26 of the patients and subjected to ctDNA quantification at each of day 0 and day 15. Of these, ctDNA was detected in 48 samples (92.3%) from a total of 25 patients (96.15%). A VAF of 0.5 typically indicates a sample purely comprising ctDNA from a set of clonal heterozygous mutations, and values above this can be caused by the contribution of variants with abnormal ploidy, such as those residing in regions of loss of heterozygosity or amplification. Across samples with ctDNA detected using sequencing, we observed a broad range of VAF from near our limit of detection (eg, 0.00259, patient 17) to likely pure ctDNA (0.554, patient 3) (mean = 0.136, median = 0.097) (supplemental Table 5). In a single patient, ctDNA was only detectable using ddPCR (ctDNA VAF = 0.005). Importantly, our sequencing method with error correction facilitates detection of mutations directly from the ctDNA in samples with VAFs above ∼1%.
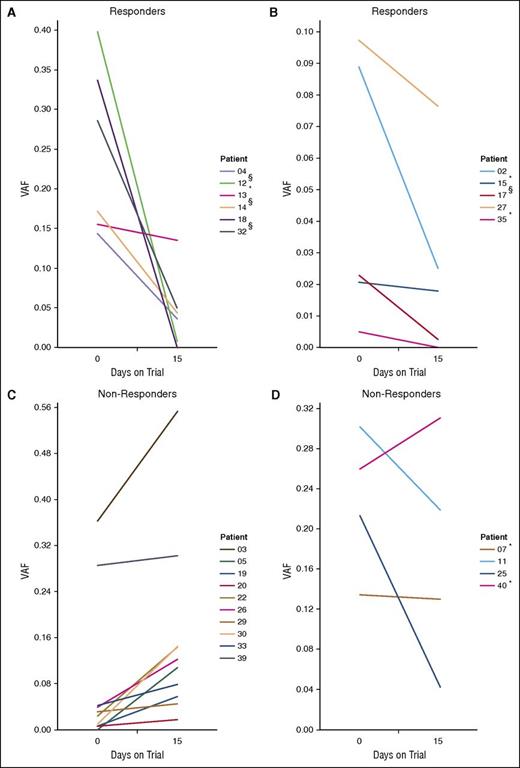
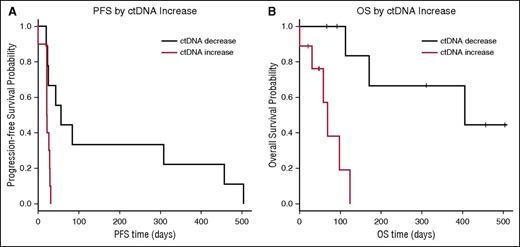
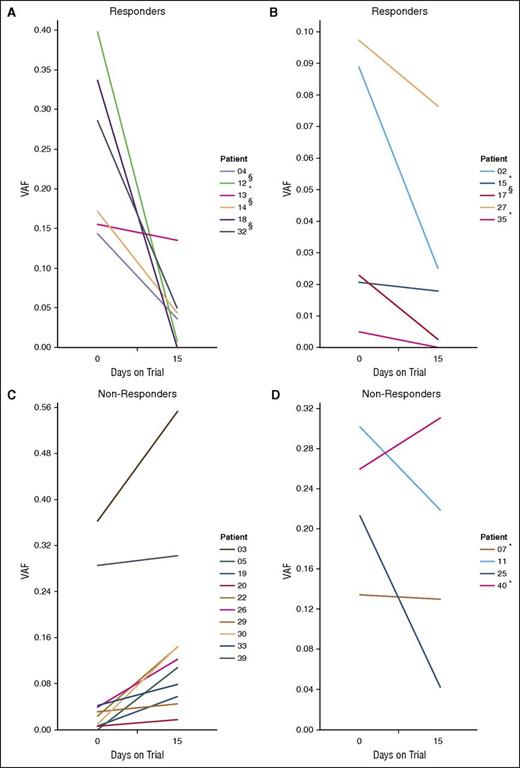
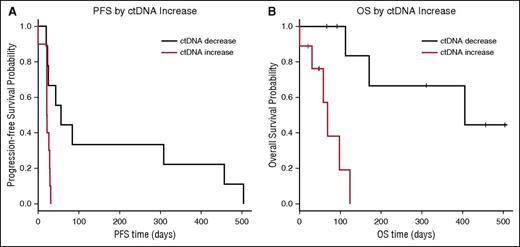
By comparing the ctDNA levels measured at 2 separate time points, we found significant differences in 20 of the 25 patients (80.0%), with 10 showing increased levels and 10 decreased levels at day 15 (Figure 3). Each patient was assessed for response (typically by CT scan) at a time ranging from 0 to 29 days after the second blood collection. CtDNA changes were compared with clinical response at the first assessment and with best response. We observed a consistent trend toward decreasing VAF in patients with significant response (here referred to as “responders”) during the time leading to the first assessment (Figure 3A-B). For the remaining 14 patients who showed disease progression (“Non-Responders”), we observed increasing ctDNA levels in 10 cases (Figure 3C). There are a few notable exceptions (Figure 3D) in which ctDNA levels decreased in patients with disease progression (patients 11 and 25). In patient 11, we found evidence for additional mutations in the latter plasma sample that indicate the outgrowth of a subclonal population. The existence of a second clonal population replacing the dominant clone in the first sample likely explains the perceived ctDNA decrease in this case. Based on these data, if a significant increase in ctDNA at day 15 is considered a predictor for lack of response (compared with insignificant change or decrease), the sensitivity, specificity, positive predictive value, and negative predictive value are 71.4%, 100%, 100%, and 71.4%, respectively. Although not all patients with decreased ctDNA eventually showed a sustained response, when comparing with the best response, the sensitivity and negative predictive value remained at 100%. Hence, by measuring changes in ctDNA, these data show that patients unlikely to benefit from the therapy may be readily recognized early in the treatment course. In addition, the PFS and OS were each significantly associated with a drop in ctDNA (Figure 4).
Correlating treatment response with ctDNA fluctuations. Shown are the ctDNA levels in all patients with detectable ctDNA in at least 1 of 2 samples collected at day 0 (entry to trial) and day 15. Patients for whom the changes in ctDNA levels did not attain statistical significance between days 0 and 15 are marked with an asterisk (*). (A-B) ctDNA levels in patients who had responded to panobinostat at the first clinical assessment. Although not all differences achieved statistical significance (eg, patient 13), there was a consistent trend toward reduced ctDNA. (C-D) ctDNA levels for patients who did not respond to the drug, with patients showing a concordant trend of increasing ctDNA in (C), and those who did not in (D). §Patients showed initial response at the first assessment but were not considered responders as per the study protocol (<6 months CR or PR). Patient 39 had progressive disease for the duration of the trial.
Correlating treatment response with ctDNA fluctuations. Shown are the ctDNA levels in all patients with detectable ctDNA in at least 1 of 2 samples collected at day 0 (entry to trial) and day 15. Patients for whom the changes in ctDNA levels did not attain statistical significance between days 0 and 15 are marked with an asterisk (*). (A-B) ctDNA levels in patients who had responded to panobinostat at the first clinical assessment. Although not all differences achieved statistical significance (eg, patient 13), there was a consistent trend toward reduced ctDNA. (C-D) ctDNA levels for patients who did not respond to the drug, with patients showing a concordant trend of increasing ctDNA in (C), and those who did not in (D). §Patients showed initial response at the first assessment but were not considered responders as per the study protocol (<6 months CR or PR). Patient 39 had progressive disease for the duration of the trial.
Correlating treatment response with ctDNA fluctuations. Shown are Kaplan-Meier survival curves comparing the outcome of patients with significant increases in ctDNA between day 0 and day 15 (red) to those with significant decreases (black). (A) PFS for patients with increased ctDNA was significantly shorter (P = .0049, log-rank test) with a hazard ratio of 1.73 (95% CI 1.49-21.2). (B) OS was also significantly shorter for patients with increases in ctDNA (P = .00117, log-rank test) with a hazard ratio of 16.52 for progression (95% CI 1.89-144.3).
Correlating treatment response with ctDNA fluctuations. Shown are Kaplan-Meier survival curves comparing the outcome of patients with significant increases in ctDNA between day 0 and day 15 (red) to those with significant decreases (black). (A) PFS for patients with increased ctDNA was significantly shorter (P = .0049, log-rank test) with a hazard ratio of 1.73 (95% CI 1.49-21.2). (B) OS was also significantly shorter for patients with increases in ctDNA (P = .00117, log-rank test) with a hazard ratio of 16.52 for progression (95% CI 1.89-144.3).
Discussion
In this clinical trial, we showed that panobinostat treatment of rrDLBCL can result in durable responses in a subset of patients. The response rate observed here was appreciably higher than in previous studies of HDI in DLBCL,12,13 which may be a result of the purported greater potency of panobinostat relative to other HDI.28 Our results also compared favorably with other reported trials of panobinostat with or without rituximab in DLBCL.29,30 The addition of rituximab did not appear to increase response rate.
As expected, panobinostat was associated with thrombocytopenia and neutropenia, which required dose reductions in a large number of patients, resulting in the actual mean delivered dose per treatment of about 20 mg. The high rate of thrombocytopenia observed here is in keeping with other trials of panobinostat in heavily pretreated patients with lymphoma, although the starting dose in those trials was 40 mg thrice weekly.29-31 Thrombocytopenia was much less frequent when panobinostat was dosed at 20 mg in pretreated multiple myeloma.32,33 As in other panobinostat trials, we observed platelet bounce-back, so that no patient permanently discontinued therapy for thrombocytopenia. Overall, a lower dose of panobinostat, such as 20 mg three times per week, and possibly a 2-weeks-on/1-week-off regimen should be considered in subsequent trials of this agent, either alone or in combination, to allow more continuous therapy, as has shown success in multiple myeloma when given with bortezomib, a drug known to cause thrombocytopenia.32,34-36
One remarkable observation was a subset of responding patients showing long remissions, some beyond 3 years at the time of data cutoff. In most cases, these remissions continued off therapy. Similarly long response durations were reported in the other 2 trials of panobinostat in DLBCL29,30 and with romedepsin, another HDI, for the treatment of peripheral T-cell lymphoma.37 Given the benefit in these patients and the poor prognosis in rrDLBCL, there is a need to identify patients most likely to respond to HDIs. To this end, some novel biomarkers predictive of response were considered. Although panobinostat appeared to induce H3 hyper-acetylation within the tumor, confirming on-target effect, this change was not predictive of response.
Among all genes tested, tumors bearing MEF2B mutations (15% of patients in this trial) appeared more likely to respond, raising the possibility that these mutations are associated with greater sensitivity to HDI. MEF2B is mutated in ∼11% of DLBCL, with an enrichment in GCB cases and also commonly mutated in transformed FL.6 In different cellular contexts, there is a complex interplay between MEF2B and multiple histone modifiers, including CREBBP, EP300, and HDACs, but the role of each of these and the specific HDACs present in B-cell lymphomas remain unclear. DLBCL-associated MEF2B hot-spot mutations, such as those observed in these patients, reduce the expression of MEF2B targets and affect DLBCL cell migration in vitro.38 Mutant MEF2B may enhance BCL6 expression, but this observation was not reproduced by Pon et al. Therein, mutant MEF2B was determined to resist binding of the co-repressor Cabin1.39 Importantly, the same residues of MEF2B that mediate Cabin1 binding also associate with at least one HDAC (HDAC4), and these proteins bind MEF2B in a mutually exclusive manner.40 As a further complication, this region of the protein also binds to transcriptional coactivators (acetyltransferases), such as CREBBP and EP300. Notably, CREBBP mutations were not associated with a greater sensitivity to panobinostat. Furthermore, no enrichment in inactivating mutations of CREBBP were seen among responders. This indicates that perhaps DLBCLs mutated in this gene are naturally resistant to HDI activity.7 The functional role of MEF2B and other HMEs in HDI response will need to be validated in further clinical trials and explored in preclinical models.
Our study also confirmed several biomarkers that indicate patients unlikely to benefit from panobinostat treatment (eg, DE-DLBCL). Interestingly, some patients bearing TP53 mutations responded to panobinostat, which is consistent with it exerting its antitumor effect via p53-independent pathways.41 Of note, 6 of 12 responding patients had transformed disease, suggesting that this disease responds similarly to de novo DLBCL. This, along with our data showing large mutational overlap between de novo and transformed DLBCL,23 argues strongly that such patients should not be excluded from clinical trials of DLBCL. Changes in tumor BCL2, BCL6, MYC, and CD20 protein were not consistent, but this analysis was greatly limited by the low number of day-15 biopsies among responders, highlighting some of the hurdles of incorporating biopsies into clinical trials. Nonetheless, we show that on-trial tissue biopsies can be performed safely, yielding high-quality biospecimens for numerous applications.
Given the varied mechanisms by which panobinostat may induce response in DLBCL, we also examined early changes in ctDNA as a potential predictive biomarker. In contrast to the other biomarkers examined, ctDNA levels appear to be strongly associated with changes of tumor burden. In all but 1 patient where measured, ctDNA was detected in at least 1 plasma sample, and in 80% of cases we observed significant changes in ctDNA in the sampled 15-day window. For most patients, these experiments were performed on DNA extracted from ≤1 mL of plasma, and prospective collection of larger volumes for ctDNA analysis should yield superior sensitivity among patients with lower levels. Despite the small sample size, we observed striking changes in ctDNA after only 15 days of therapy and a clear association with response, with very high specificity and positive predictive value. No patients with an increase in ctDNA at 15 days ultimately responded to treatment and all patients who eventually responded had a significant drop in ctDNA after 15 days of therapy. OS and PFS were also each significantly associated with a drop in ctDNA. Thus, ctDNA dynamics may provide an early indication of ultimate treatment failure in clinical trials, and mutational analysis could serve as an adjunct to other methods such as imaging and serial biopsies to study tumor response and genetics. The day-15 time point proved to be extremely informative in this trial. We demonstrate that a very early change in ctDNA abundance is a robust indicator of later clinical benefit. If confirmed prospectively, it will ensure that patients not likely to benefit from panobinostat can be switched earlier to another therapy.
Further integration of serial ctDNA measurements in clinical trials will be needed to determine the generalizability of ctDNA in predicting early response to new drugs. Our use of ctDNA as an early marker of response builds on the knowledge that mutations in ctDNA correlate strongly with tumor mutations,42 and adds to the growing literature on the use of this technology for early prediction of response to standard treatments, as a complimentary tool to conventional imaging and for long-term relapse surveillance.19,20,24
It is important to differentiate our methods from alternative techniques that are more routinely used for ctDNA detection in B-cell malignancies, which rely on specific detection of recombined VDJ segments.19,20 To date, the utility of ctDNA for DLBCL monitoring has relied solely on such assays, and prior studies have largely focused on retrospective cohorts.19,20 Owing to technical limitations, tumor DNA must first be analyzed and some tumors are ultimately not compatible with VDJ-based assays (up to ∼17% of cases).20 Further, although VDJ sequencing in tumors has shown clonal diversity in DLBCL,43 such analyses infer clonal diversity from hypermutated regions and, importantly, are not capable of inferring the presence of driver mutations. By sequencing DNA of lymphoma-related genes, we directly quantify the abundance of driver mutations in plasma and in 4 cases analyzed here, ctDNA was the sole source of tumor DNA for mutation detection, demonstrating that access to diagnostic tumor tissue is not inherently required.
Among the patients with significant ctDNA decreases who did not show a measurable response, we expect that some of them experienced initial responses followed by resistance caused by the outgrowth of a subclone that may be genetically related to the initial cancer, but with an incomplete overlap in mutations, as we have previously shown.23 This may explain patients with apparently reduced ctDNA who ultimately had relapse. Besides patient 11, we noted 3 additional cases with inconsistencies across the relative VAFs between ctDNA samples, which we consider evidence of multiple subclonal populations (patients 3, 7, and 39). Detection of such subclonal populations may be achieved by performing targeted or global sequencing on additional plasma samples using methods used herein or, given the high level of ctDNA (in some cases approaching the level of tumor DNA present in tissue biopsies), using global strategies, such as exome sequencing for unbiased mutation discovery in plasma.
Overall, our data promote sequence-based analysis of ctDNA as a powerful and promising tool for gleaning early signals of response especially, while possibly affording opportunity to detect ongoing clonal evolution, a known feature of DLBCL.44 As well, we conclude that panobinostat is active in subsets of DLBCL and should be considered in future rational drug combination trials that incorporate biomarker analyses to allow for a greater understanding of the subsets of patients likely to respond.
The online version of this article contains a data supplement.
The publication costs of this article were defrayed in part by page charge payment. Therefore, and solely to indicate this fact, this article is hereby marked “advertisement” in accordance with 18 USC section 1734.
Acknowledgments
The authors wish to recognize the important contribution made by patients and their families, as well as the nurses, study coordinators, and subinvestigators who contributed to this study. Novartis provided panobinostat and financial support for this trial, and Hoffman-LaRoche supplied rituximab. Q-CROC (Quebec Clinical Research Organization in Cancer) coordinated the handling of all correlative biopsy specimens.
This work was supported by an operating grant provided by the Canadian Institutes for Health Research (R.D.M., N.J.) and a New Investigator Award (R.D.M.) from the CIHR (300738) and the Terry Fox Research Institute (TFRI: 1043). Methodology was also developed with funds from a separate grant from TFRI (1021) (R.D.M.).
Authorship
Contribution: S.E.A., M.C., T.H.N., K.K.M., R.D.M., S.Y., D.F., M.A., and N.J. designed and performed the research and analyzed the data; D.M., A.T., V.K., R.C., E.C., and C.R. performed the clinical research; L.C., M.A., and S.A. analyzed all genetic data; K.K.O. and C.M.T.G. analyzed the microarray data; T.P.-H. and R.F. generated data; A.K. provided statistical support; A.S. collected and analyzed the clinical data; and all authors contributed to the writing of the manuscript.
Conflict-of-interest disclosure: S.E.A. and N.J. hold Chercheur-Clinicien Awards from the FRQS (Fonds de recherche du Quebec-sante). S.E.A. has received research funding and has acted as a consultant for Novartis Canada, Inc, and Hofman-LaRoche Canada. N.J. has received research funding from Hofman-LaRoche Canada. M.C. has consulted for Celgene, Seattle Genetics, and Sanofi Aventis. A.T. has consulted for Roche and Novartis. The remaining authors declare no competing financial interests.
Correspondence: Sarit E. Assouline, Jewish General Hospital, McGill University, 3755 Cote Ste. Catherine, Suite E725, Montreal, QC H3Y1W2, Canada; e-mail: sarit.assouline@mcgill.ca.
References
Author notes
T.H.N. and S.Y. contributed equally to this study.
R.D.M. and K.K.M. contributed equally to this study.

