Key Points
The sphingosine-1-phosphate receptor 2 (S1PR2) is a novel tumor suppressor and survival prognosticator in the ABC subtype of DLBCL.
S1PR2 is a direct, repressed FOXP1 target; ectopic S1PR2 expression induces apoptosis in DLBCL cells in vitro and prevents tumor growth.
Abstract
Aberrant expression of the oncogenic transcription factor forkhead box protein 1 (FOXP1) is a common feature of diffuse large B-cell lymphoma (DLBCL). We have combined chromatin immunoprecipitation and gene expression profiling after FOXP1 depletion with functional screening to identify targets of FOXP1 contributing to tumor cell survival. We find that the sphingosine-1-phosphate receptor 2 (S1PR2) is repressed by FOXP1 in activated B-cell (ABC) and germinal center B-cell (GCB) DLBCL cell lines with aberrantly high FOXP1 levels; S1PR2 expression is further inversely correlated with FOXP1 expression in 3 patient cohorts. Ectopic expression of wild-type S1PR2, but not a point mutant incapable of activating downstream signaling pathways, induces apoptosis in DLBCL cells and restricts tumor growth in subcutaneous and orthotopic models of the disease. The proapoptotic effects of S1PR2 are phenocopied by ectopic expression of the small G protein Gα13 but are independent of AKT signaling. We further show that low S1PR2 expression is a strong negative prognosticator of patient survival, alone and especially in combination with high FOXP1 expression. The S1PR2 locus has previously been demonstrated to be recurrently mutated in GCB DLBCL; the transcriptional silencing of S1PR2 by FOXP1 represents an alternative mechanism leading to inactivation of this important hematopoietic tumor suppressor.
Introduction
The forkhead box protein 1 (FOXP1) transcription factor is aberrantly expressed in the activated B-cell–like (ABC) subtype of diffuse large B-cell lymphoma (DLBCL) and represents a widely accepted biomarker for survival prognostication in DLBCL. The FOXP1 genomic locus is recurrently targeted by genomic rearrangements in ABC DLBCL as well as in marginal zone lymphoma of mucosa-associated lymphoid tissue and in chronic lymphocytic leukemia, which correlates with a poor prognosis in each disease entity.1-3 Primary FOXP1 translocations predominantly involve the immunoglobulin heavy chain locus, leading to overexpression of the full-length protein3 ; in contrast, the rare nonimmunoglobulin rearrangements of FOXP1 generate N-truncated isoforms that are believed to drive disease progression rather than initiation.4 Most FOXP1-expressing lymphomas exhibit no apparent structural aberrations of the gene5 ; the short, putatively oncogenic isoforms in particular are highly expressed from the wild-type locus in ABC DLBCL as a consequence of “normal” B-cell activation.6 We have shown earlier that aberrant FOXP1 expression in ABC DLBCL may alternatively also result from dysregulated posttranscriptional regulation.7,8 FOXP1 protein levels are regulated by the microRNA miR-34a, which itself is either transcriptionally or epigenetically silenced in nodal and extranodal DLBCL.7 Therefore, aberrant FOXP1 expression is a common feature of various types of mature B-cell lymphomas that can result from either genetic abnormalities or transcriptional or posttranscriptional dysregulation.
FOXP1 expression is a well-documented negative prognostic factor in ABC DLBCL and marginal zone lymphoma that can be used either alone5,9-12 or as part of a biomarker panel.13,14 The inferior outcome in patients with FOXP1-expressing DLBCL holds true irrespective of gains or structural aberrations at the FOXP1 genomic locus (3p14.1)5 and for patients treated with CHOP (cyclophosphamide, hydroxydaunorubicin, vincristine, and prednisone), alone or in combination with rituximab (R-CHOP).5,11,12,15 Due to its robust clinical implications, the biology of aberrant FOXP1 expression has received increasing attention lately. The elucidation of FOXP1 target genes whose gene products may mediate the effects of FOXP1 overexpression, and the identification of potentially druggable FOXP1 target pathways is of particular interest. FOXP1 is required for normal B-cell development, first during the pro–B-cell to pre–B-cell transition, where it controls VDJ recombination by regulating RAG recombinases,16 and again in the mature B-cell, where it regulates the transition from a resting, naive follicular B-cell to an activated germinal center (GC) B cell.17 Several recent reports have addressed FOXP1 target genes in lymphoma, particularly ABC DLBCL. One study showed that FOXP1-mediated repression of its direct target Huntingtin-interacting protein 1-related (HIP1R) is associated with poor survival of ABC DLBCL patients.18 Another study demonstrated that FOXP1 suppresses apoptosis of DLBCL cells by transcriptional repression of a set of proapoptotic target genes, which includes the BH3-only protein BIK and several p53 regulatory proteins.19 Here, we have combined a genome-wide search for direct FOXP1 targets using chromatin immunoprecipitation (ChIP) followed by next-generation sequencing and RNA interference with functional screening for biologically relevant target genes to identify novel tumor suppressor proteins in FOXP1-positive DLBCL. We provide evidence that the repressed FOXP1 target sphingosine-1-phosphate receptor 2 (S1PR2) has robust tumor suppressive activity in DLBCL cells in vitro and in vivo and represents an excellent prognostic biomarker that, either alone or in combination with FOXP1 expression, accurately predicts survival of ABC DLBCL patients.
Methods
Cell lines and cell-culture–based assays
The DLBCL cell lines used were SU-DHL4, SU-DHL6, SU-DHL10, SU-DHL16, and RC-K8 of GCB DLBCL subtype and U-2932, OCI-LY3, OCI-LY10, SU-DHL2, SU-DHL5, and RIVA of ABC DLBCL subtype (see supplemental Methods, available on the Blood Web site, for a table listing cell line details). Cell lines were maintained at 37°C, 5% CO2 in a humidified atmosphere in RPMI or Iscove modified Dulbecco medium (RIVA, OCI-LY10) supplemented with 10% (OCI-LY10, RIVA, SU-DHL2, and SU-DHL5) or 20% heat-inactivated fetal bovine serum and antibiotics. The AKT inhibitor MK-2206 (Selleckchem) was dissolved in dimethyl sulfoxide. For RNA interference experiments, 1 × 10⁶ DLBCL cells were nucleoporated with 100 nM small interfering RNA (siRNA) using the Amaxa Nucleofector II device. Knockdown efficiency was confirmed 24 hours after nucleoporation by real-time quantitative polymerase chain reaction (qPCR). The siRNAs were obtained from Qiagen with the following target sequences for FOXP1.1 (CAGGCGGTACTCAGACAAATA), FOXP1.2 (CAGCAGCAAGTTAGTGGATTA), GNA12 (CCGGATCGGCCAGCTGAATTA), GNA13 (CACTATCATTGTATCCATATA), ARHGEF1 (CAACGTCGCCTTTGAA CTTGA). Allstars negative control siRNA (Qiagen) was used as control. For the purpose of ectopic gene expression, 1 × 10⁶ DLBCL cells were nucleoporated with 3 µg plasmid DNA using the Amaxa Nucleofector II device. Cells were harvested 48 hours after transfection for protein extraction or subjected to functional analysis. CellTiter-Blue reagent (Promega) was used for viability assessment. The quantification of apoptosis by Annexin V detection kit (BD Pharmingen) or cleaved caspase-3 (Biovision) was performed according to the manufacturer’s instructions. Flow cytometry was performed on a Cyan ADP 9 instrument (Beckman Coulter) and analyzed using FlowJo software. Protocols for quantitative reverse-transcription polymerase chain reaction (qRT-PCR), western blotting, RNA, and ChIP sequencing, as well as inducible protein expression and site-directed mutagenesis, are available in supplemental Methods. All animal experimentation was approved by the Zürich Cantonal Veterinary Office (licenses 147/2011 and 224/2014 to A.M.) and is described in supplemental Methods.
Results
The hematopoietic oncoprotein FOXP1 promotes cell survival and functions as a transcriptional repressor in DLBCL
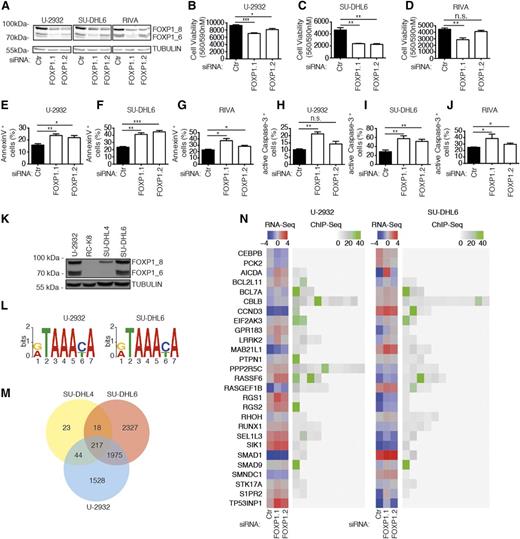
In this study, we have embarked on a global survey of genes that are (1) regulated by FOXP1 at the transcriptional level, (2) are directly bound by FOXP1 as determined by chromatin immunoprecipitation, and (3) affect proliferation and survival in cell culture models of DLBCL. We selected several cell lines for experimentation based on their FOXP1 expression; as noted previously by us and others, the strong expression of one or several FOXP1 isoforms was more commonly observed in ABC- compared with GCB-derived cell lines (see supplemental Figure 1A-C). To identify genes that are controlled by FOXP1, we silenced its expression in the FOXP1-positive DLBCL cell lines SU-DHL6, U-2932, and RIVA by electroporation with siRNAs targeting either all (siFOXP1.1) or preferentially the high-molecular-weight (siFOXP1.2) isoforms. FOXP1 knockdown was efficient in all 3 cell lines (Figure 1A and supplemental Figure 1D-E), reduced tumor cell viability as determined by metabolic activity assay (Figure 1B-D), and induced apoptosis as assessed by flow cytometric analysis of Annexin V and active caspase-3 (Figure 1E-J and supplemental Figure 1F-G); in contrast, the FOXP1-negative cell line RC-K8 did not undergo cell death upon electroporation with the same siRNAs, arguing against potential off-target effects (supplemental Figure 1H-I). The siRNA targeting all isoforms was generally more potent at inducing cell death than the siRNA that preferentially targets the high-molecular-weight isoforms (Figure 1B-J). Silencing of FOXP1 in FOXP1-positive cell lines further consistently dysregulated the expression (>2-fold) of 103 genes in SU-DHL6 and 66 genes in U-2932 cells as determined by RNA sequencing (supplemental Table 1). To examine which of the FOXP1-regulated genes are direct targets of the transcription factor, we performed ChIP with a FOXP1-specific antibody of the 2 FOXP1hi (U-2932 and SU-DHL6) cell lines also used for transcriptional profiling, as well as 1 FOXP1lo (SU-DHL4) and 1 FOXP1-negative (RC-K8) cell line (Figure 1K). ChIP was followed by Illumina sequencing of the precipitated genomic DNA. The consensus sequence of FOXP1-bound regulatory regions that we identified by this approach was identical in both FOXP1hi cell lines (Figure 1L) and very similar to a previously reported sequence.20 FOXP1-bound regulatory regions were predominantly identified at transcription start sites (data not shown). Of all ∼6000 genomic loci bound by FOXP1 (supplemental Table 2), roughly one-third were shared by the 2 examined FOXP1hi cell lines (U-2932 and SU-DHL6; Figure 1M). The ChIP-derived information on FOXP1-bound loci was then integrated with the lists of differentially expressed genes. Of 430 genes that were dysregulated upon FOXP1-specific RNAi as determined by RNA sequencing and/or directly bound by FOXP1 as determined by ChIP-sequencing (see supplemental Methods for a detailed description of criteria and cutoffs), 27 were selected for functional analysis because they had previously been mentioned in the literature in the context of cancer, tumor suppression, or B-cell biology. Figure 1N shows the gene expression changes upon FOXP1 knockdown in the 2 cell lines as well as the fold enrichment and number of binding sites identified in FOXP1 chromatin-immunoprecipitated DNA of the 27 genes. We conclude from the combined results that FOXP1 promotes cell survival in DLBCL cell lines and regulates the expression of numerous target genes by binding to highly conserved regulatory regions.
Identification of FOXP1 target genes by ChIP sequencing combined with RNA sequencing. (A-J) Either all (siFOXP1.1) or preferentially the high-molecular-weight isoforms (siFOXP1.2) of FOXP1 (isoforms designated FOXP1_8 and 1_6) were depleted in the 3 DLBCL cell lines (U-2932, SU-DHL6, and RIVA) for 72 hours prior to the assessment of FOXP1 levels, cell viability, and cell death. An unspecific control siRNA was used for comparison. (A) FOXP1 levels as assessed by western blotting with α-TUBULIN as loading control. (B-D) Cell viability as determined by CellTiter Blue assay. (E-G) Apoptosis as determined by Annexin V staining followed by flow cytometry. (H-J) Apoptosis as determined by cleaved/active caspase-3 staining followed by flow cytometry. Data represent means + SEM of at least 3 independent experiments per cell line (B-J). (K) Western blot showing FOXP1 expression in the 4 cell lines used for ChIP-sequencing with α-TUBULIN as loading control. (L) Top enriched motif as identified by DREME in U-2932 (E = 4.1e-295) and SU-DHL6 (E = 2.1e-486) cells. (M) Venn diagram showing the overlap of identified ChIP peaks in the 3 FOXP1-positive cell lines. (N) 27 FOXP1 targets as identified by RNA sequencing and ChIP sequencing. Log2-transformed gene expression (counts per million; blue/red color code) of U-2932 and SU-DHL6 cell lines transfected with the indicated siRNAs is shown alongside the fold enrichment of ChIP peaks in the same cell lines (gray/green color code). *P < .05, **P < .01, and ***P < .001 (2-tailed Student t test). n.s., not significant.
Identification of FOXP1 target genes by ChIP sequencing combined with RNA sequencing. (A-J) Either all (siFOXP1.1) or preferentially the high-molecular-weight isoforms (siFOXP1.2) of FOXP1 (isoforms designated FOXP1_8 and 1_6) were depleted in the 3 DLBCL cell lines (U-2932, SU-DHL6, and RIVA) for 72 hours prior to the assessment of FOXP1 levels, cell viability, and cell death. An unspecific control siRNA was used for comparison. (A) FOXP1 levels as assessed by western blotting with α-TUBULIN as loading control. (B-D) Cell viability as determined by CellTiter Blue assay. (E-G) Apoptosis as determined by Annexin V staining followed by flow cytometry. (H-J) Apoptosis as determined by cleaved/active caspase-3 staining followed by flow cytometry. Data represent means + SEM of at least 3 independent experiments per cell line (B-J). (K) Western blot showing FOXP1 expression in the 4 cell lines used for ChIP-sequencing with α-TUBULIN as loading control. (L) Top enriched motif as identified by DREME in U-2932 (E = 4.1e-295) and SU-DHL6 (E = 2.1e-486) cells. (M) Venn diagram showing the overlap of identified ChIP peaks in the 3 FOXP1-positive cell lines. (N) 27 FOXP1 targets as identified by RNA sequencing and ChIP sequencing. Log2-transformed gene expression (counts per million; blue/red color code) of U-2932 and SU-DHL6 cell lines transfected with the indicated siRNAs is shown alongside the fold enrichment of ChIP peaks in the same cell lines (gray/green color code). *P < .05, **P < .01, and ***P < .001 (2-tailed Student t test). n.s., not significant.
Expression of the sphingosine-1-phosphate receptor S1PR2 is inversely correlated with FOXP1 expression in patient biopsies
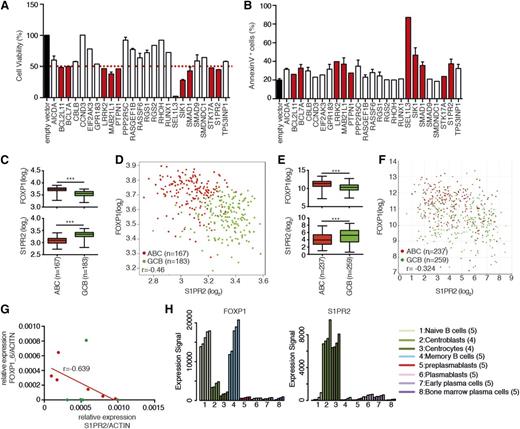
We next proceeded to functionally examine the 27 identified FOXP1 targets by manipulating their expression in U-2932 cells. FOXP1 predominantly serves as a transcriptional repressor rather than an activator of target gene expression; accordingly, we identified only 2 transcripts whose expression decreased upon FOXP1 knockdown. siRNAs specific for these positively regulated genes failed to affect cell viability or apoptosis (supplemental Figure 2A-B); in contrast, 10 of the 25 repressed FOXP1 target genes reduced the viability of U-2932 cells by >50% upon ectopic expression, ie, in a gain-of-function screen (Figure 2A). This loss of viability coincided with apoptosis induction in U-2932 cells (Figure 2B), suggesting that the 10 genes function as potential tumor suppressors in DLBCL.
Functional analysis of the proapoptotic activity of putative FOXP1 targets. (A-B) U-2932 cells were transfected with the indicated expression plasmids and analyzed with respect to cell viability and apoptosis 48h later. Cell viability was determined by CellTiter Blue assay (A) and apoptosis was assessed by Annexin V staining (B). Red indicates target genes that reduce cell viability by >50% upon ectopic expression, compared with the empty vector control. Data are shown as means of 1 or 2 (+SEM) experiments; note that the same batch of transfection reagents was used throughout, every cDNA was expressed under the same promoter, and the same batch of transfected cells was used for the CellTiter Blue and apoptosis assays. (C-F) FOXP1 and S1PR2 expression in tumors from 2 patient cohorts consisting of 350 DLBCL patients23 (C-D) and 496 DLBCL patients14 (E-F), which were further stratified based on ABC vs GCB subtype. ***P < .001 (2-tailed Mann-Whitney U test). Data sets were analyzed using R software or the R2 microarray analysis and visualization platform (http://r2.amc.nl). (G) S1PR2 and FOXP1_6 expression levels were determined in DLBCL cell lines by qRT-PCR (normalized to ACTIN). Red dots indicate ABC-type and green dots GCB-type cell lines. The correlation coefficient was calculated for the ABC cell lines only. (H) Expression levels of FOXP1 and S1PR2 during B-cell development were determined using publicly available data from Genomicscape.24 The number in brackets denotes the number of samples analyzed per B-cell developmental stage.
Functional analysis of the proapoptotic activity of putative FOXP1 targets. (A-B) U-2932 cells were transfected with the indicated expression plasmids and analyzed with respect to cell viability and apoptosis 48h later. Cell viability was determined by CellTiter Blue assay (A) and apoptosis was assessed by Annexin V staining (B). Red indicates target genes that reduce cell viability by >50% upon ectopic expression, compared with the empty vector control. Data are shown as means of 1 or 2 (+SEM) experiments; note that the same batch of transfection reagents was used throughout, every cDNA was expressed under the same promoter, and the same batch of transfected cells was used for the CellTiter Blue and apoptosis assays. (C-F) FOXP1 and S1PR2 expression in tumors from 2 patient cohorts consisting of 350 DLBCL patients23 (C-D) and 496 DLBCL patients14 (E-F), which were further stratified based on ABC vs GCB subtype. ***P < .001 (2-tailed Mann-Whitney U test). Data sets were analyzed using R software or the R2 microarray analysis and visualization platform (http://r2.amc.nl). (G) S1PR2 and FOXP1_6 expression levels were determined in DLBCL cell lines by qRT-PCR (normalized to ACTIN). Red dots indicate ABC-type and green dots GCB-type cell lines. The correlation coefficient was calculated for the ABC cell lines only. (H) Expression levels of FOXP1 and S1PR2 during B-cell development were determined using publicly available data from Genomicscape.24 The number in brackets denotes the number of samples analyzed per B-cell developmental stage.
To determine which of the identified proapoptotic FOXP1 targets exhibit expression patterns that are inversely associated with the expression of FOXP1 in patient biopsy specimens, we took advantage of publicly accessible gene expression profiling (GEP) data sets. One of the 2 available GEP data sets included 496 DLBCL patients that had been recruited as part of the International DLBCL Rituximab-CHOP Consortium Program Study14,21,22 and received R-CHOP therapy; the other cohort consisted of 350 patients enrolled in the Lymphoma/Leukemia Molecular Profiling Project, respectively, who had been treated with either CHOP or R-CHOP.23 We were able to confirm earlier observations demonstrating that FOXP1 expression is consistently higher in ABC than GCB DLBCL cases in both data sets (Figure 2C-F). To our surprise, only a few of the 10 repressed targets with proapoptotic activity identified in the combined approaches outlined above were correlated inversely with FOXP1 in terms of their transcript abundance (supplemental Figure 2C-K); however, one candidate, S1PR2, exhibited a nearly perfect inverse association with FOXP1 in both DLBCL cohorts (Figure 2C-F). A similar inverse expression pattern was observed also in the subset of ABC-DLBCL–derived cell lines that we had at our disposal (Figure 2G). During B-cell ontogeny, FOXP1 is highly expressed in the naive B cell, and then again in memory B-cells as judged based on publicly available gene expression profiles24 ; both phases of B-cell development are characterized by low S1PR2 expression (Figure 2H). In contrast, FOXP1lo centrocytes and centroblasts exhibit derepressed S1PR2 expression (Figure 2H). The combined functional and gene expression data support the conclusion that S1PR2 is repressed at the transcriptional level in DLBCL due to aberrant expression of its negative regulator FOXP1 and that the dysregulation of S1PR2 may contribute to the survival of DLBCL cells.
S1PR2 is a direct repressed target of FOXP1 with proapoptotic activity in DLBCL cell lines
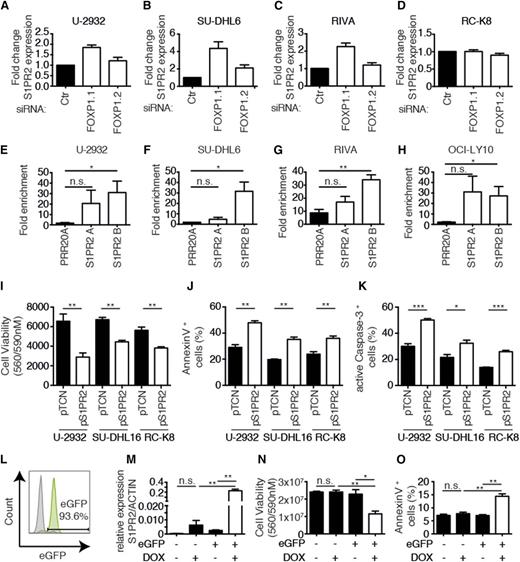
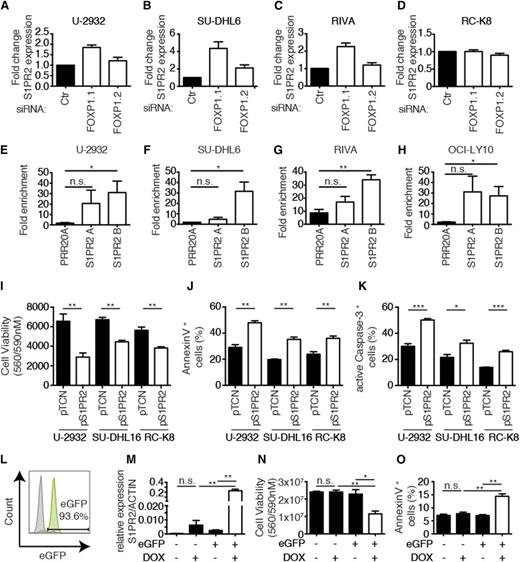
To validate and extend our findings linking FOXP1 to S1PR2 regulation using additional cell lines and approaches, we silenced FOXP1 expression in the 3 before-mentioned FOXP1-positive cell lines as well as the FOXP1-negative cell line RC-K8. Silencing of FOXP1 expression with the siRNA targeting all isoforms (siFOXP1.1) led to an increase in the expression of S1PR2 by a factor of twofold to fourfold as determined by qRT-PCR in the 3 FOXP1- positive cell lines, but not the FOXP1-negative cell line (Figure 3A-D). We next sought to confirm the ChIP-sequencing results by ChIP followed by qPCR (ChIP-qPCR) specific for the S1PR2 regulatory region that is bound by FOXP1. ChIP sequencing had identified 2 regions 2.5 and 5 kb upstream of the S1PR2 transcription start site (designated “A” and “B”; supplemental Figure 3) to be highly enriched in chromatin immunoprecipitates generated with a FOXP1-specific relative to an irrelevant antibody. This observation could be confirmed by ChIP-qPCR in 4 examined FOXP1-positive cell lines (Figure 3E-H); no PCR product was obtained in immunoprecipitates from FOXP1-negative RC-K8 cells (data not shown). In general, the region 5 kb upstream of the transcription start site (B) was more robustly bound by FOXP1 (and therefore amplified by qPCR), whereas FOXP1 binding to the region 2.5 kb upstream (A) was more variable across cell lines and experiments (Figure 3E-H). Finally, we restored S1PR2 expression in 3 cell lines that are amenable to genetic manipulation with complementary DNA (cDNA) expression constructs (1 FOXP1hi, 1 FOXP1lo, and 1 FOXP1−) and determined the effects of this treatment on tumor cell viability and apoptosis. Ectopic S1PR2 expression was approximately in the same range as S1PR2 expression resulting from FOXP1 depletion by RNAi (as assessed by qRT-PCR; data not shown) and consistently reduced the survival of all examined cell lines (Figure 3I). The loss of viability correlated well with induction of apoptosis as evidenced by staining for Annexin V and active caspase-3 (Figure 3J-K). We next used lentiviral transduction to generate SU-DHL6 cells harboring the S1PR2 gene under doxycycline control, in which GFP expression allows for tracking of successful transduction. GFP-positive cells were sorted to >90% purity (Figure 3L); the addition of doxycycline induced S1PR2 expression in GFP-positive, but not GFP-negative, cells (Figure 3M) and strongly reduced cell survival (Figure 3N), which could be attributed to apoptosis induction (Figure 3O). In summary, S1PR2 is a directly regulated, repressed target of FOXP1 in DLBCL cell lines that exhibits robust proapoptotic activity; the results suggest that the loss of S1PR2 expression likely confers a survival advantage to DLBCL cells due to protection from apoptosis.
S1PR2 is a direct, repressed target of FOXP1 with proapoptotic activity in DLBCL cell lines. (A-D) S1PR2 expression levels were determined by qRT-PCR (normalized to ACTIN) after 72 hours of FOXP1 depletion in the indicated cell lines. Data are represented as fold change over the negative control siRNA (means + SEM of at least 3 independent experiments are shown). (E-H) ChIP followed by qPCR of 2 FOXP1-bound regions 2.5 kb and 5 kb upstream of the S1PR2 transcription start site that were identified by ChIP sequencing. Data are shown as fold enrichment relative to an unspecific immunoglobulin G control antibody for the 4 indicated cell lines. A locus in the PRR20A gene was used as a negative control.17 Data represent means + SEM of at least 3 independent experiments. (I-K) Viability and apoptosis of the 3 indicated DLBCL cell lines 48 hours posttransfection with an S1PR2 expression plasmid or empty vector. Cell viability was assessed using CellTiter Blue (I) and apoptosis was assessed using Annexin V (J) or cleaved caspase-3 staining (K). Data represent means + SEM of at least 3 independent experiments. (L) A representative enhanced GFP histogram of SU-DHL6 cells after infection with virus particles harboring pIND21-S1PR2. (M-O) S1PR2 expression was induced for 72 hours with doxycycline in SU-DHL6 cells transduced with pIND21-S1PR2 prior to the assessment of S1PR2 transcript levels (M), as well as viability and apoptosis by CellTiter Blue assay and Annexin V staining (N-O); data of 3 independent experiments are shown as means + SEM. *P < .05, **P < .01, and ***P < .001 (2-tailed Student t test). n.s., not significant.
S1PR2 is a direct, repressed target of FOXP1 with proapoptotic activity in DLBCL cell lines. (A-D) S1PR2 expression levels were determined by qRT-PCR (normalized to ACTIN) after 72 hours of FOXP1 depletion in the indicated cell lines. Data are represented as fold change over the negative control siRNA (means + SEM of at least 3 independent experiments are shown). (E-H) ChIP followed by qPCR of 2 FOXP1-bound regions 2.5 kb and 5 kb upstream of the S1PR2 transcription start site that were identified by ChIP sequencing. Data are shown as fold enrichment relative to an unspecific immunoglobulin G control antibody for the 4 indicated cell lines. A locus in the PRR20A gene was used as a negative control.17 Data represent means + SEM of at least 3 independent experiments. (I-K) Viability and apoptosis of the 3 indicated DLBCL cell lines 48 hours posttransfection with an S1PR2 expression plasmid or empty vector. Cell viability was assessed using CellTiter Blue (I) and apoptosis was assessed using Annexin V (J) or cleaved caspase-3 staining (K). Data represent means + SEM of at least 3 independent experiments. (L) A representative enhanced GFP histogram of SU-DHL6 cells after infection with virus particles harboring pIND21-S1PR2. (M-O) S1PR2 expression was induced for 72 hours with doxycycline in SU-DHL6 cells transduced with pIND21-S1PR2 prior to the assessment of S1PR2 transcript levels (M), as well as viability and apoptosis by CellTiter Blue assay and Annexin V staining (N-O); data of 3 independent experiments are shown as means + SEM. *P < .05, **P < .01, and ***P < .001 (2-tailed Student t test). n.s., not significant.
S1PR2 signals via the small G protein Gα13 to induce apoptosis
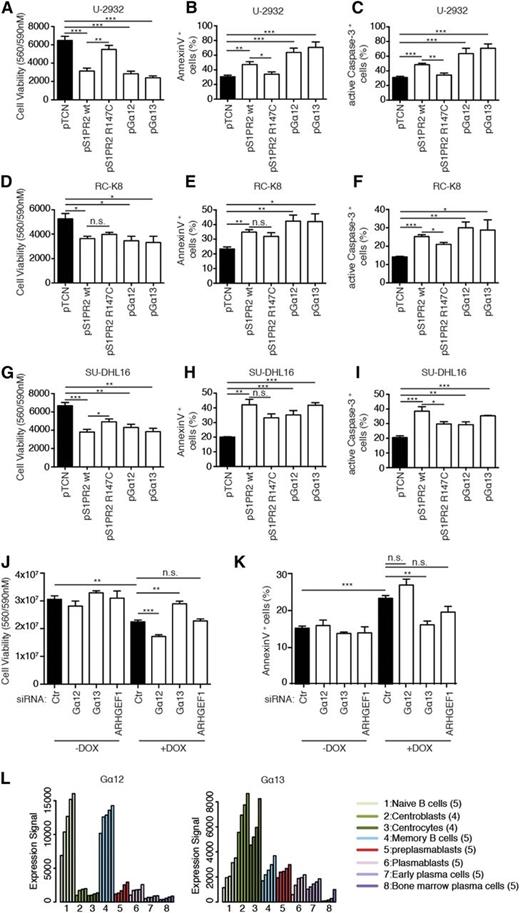
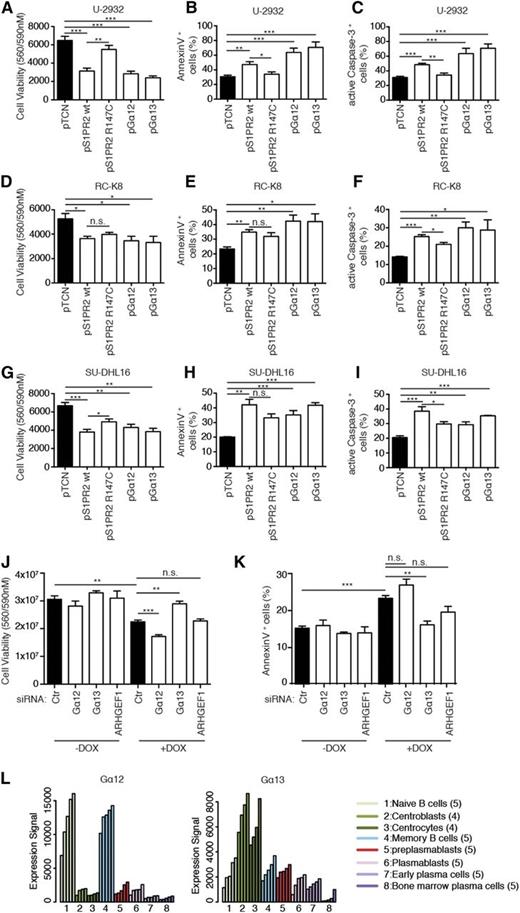
S1PR2 is a G-protein–coupled receptor (GPCR) that binds the lipid-signaling molecule sphingosine-1-phosphate and couples to either of 2 small G proteins, Gα12 or Gα13 (encoded by GNA12 and GNA13, respectively), to activate downstream signaling events.25 Both small G proteins are predominantly known for their activity in regulating proliferation and migration. To assess whether Gα12 and/or Gα13 contribute to proapoptotic S1PR2 signaling, we first constructed a point mutant, S1PR2 R147C, which is expressed at normal levels but lacks the ability to interact with both small G proteins.26 The proapoptotic activity of S1PR2 R147C was reduced relative to wild-type S1PR2 in several cell lines, as determined by cell viability assay as well as Annexin V and active caspase-3 staining (Figure 4A-I). Interestingly, the ectopic expression of either of the 2 small G proteins phenocopied the effects of S1PR2 on viability and cell death (Figure 4A-I). We next assessed whether either or both small G proteins are required for S1PR2-driven cell death in SU-DHL6 cells harboring the S1PR2 gene under doxycycline control; interestingly, the siRNA-mediated knockdown of Gα13, but not Gα12, reversed the phenotype of inducible S1PR2 expression (Figure 4J-K). The silencing of ARHGEF, a Rho guanine nucleotide exchange factor known to function downstream of both small G proteins to activate RhoA by exchanging bound GDP for GTP, showed similar trends as Gα13 depletion, which were not statistically significant (Figure 4J-K). All 3 siRNAs led to a depletion of their target messenger RNAs by 50% or more and corresponding protein by ∼50% (supplemental Figure 4A-B). The combined results indicate that although both Gα12 and Gα13 can in principle transmit proapoptotic signals downstream of S1PR2, only Gα13 is active in the examined DLBCL cell line. This observation is consistent with Gα13, but not Gα12, coexpression with S1PR2 in centrocytes and centroblasts (Figures 2H and 4L).
The proapoptotic activity of S1PR2 is mediated by Gα13. (A-I) The 3 indicated DLBCL cell lines were transfected with plasmids encoding either wild-type or mutant S1PR2, or Gα12, or Gα13. Cell viability and apoptosis were assessed after 48 hours by CellTiter Blue assay (A,D,G), Annexin V staining (B,E,H), and cleaved caspase-3 staining (C,F,I). Data are represented as means + SEM of at least 3 independent experiments. Note that roughly equal expression of the 4 constructs was verified using FLAG-tagged versions of the proteins (data not shown). (J-K) Viability and apoptosis of SU-DHL6 cells that inducibly express S1PR2 72 hours posttransfection with the indicated siRNAs; transfected cells were additionally exposed to doxycycline for the last 48 hours of the experiment where indicated. Cell viability was assessed using CellTiter Blue assay (J); apoptosis was assessed by Annexin V staining (K). Data represent means +SEM of 3 independent experiments. *P < .05, **P < .01, and ***P < .001 (2-tailed Students t test). (L) Expression levels of Gα12 and Gα13 during B-cell development, as determined using publicly available data from Genomicscape.24 Ctr, control; n.s., not significant.
The proapoptotic activity of S1PR2 is mediated by Gα13. (A-I) The 3 indicated DLBCL cell lines were transfected with plasmids encoding either wild-type or mutant S1PR2, or Gα12, or Gα13. Cell viability and apoptosis were assessed after 48 hours by CellTiter Blue assay (A,D,G), Annexin V staining (B,E,H), and cleaved caspase-3 staining (C,F,I). Data are represented as means + SEM of at least 3 independent experiments. Note that roughly equal expression of the 4 constructs was verified using FLAG-tagged versions of the proteins (data not shown). (J-K) Viability and apoptosis of SU-DHL6 cells that inducibly express S1PR2 72 hours posttransfection with the indicated siRNAs; transfected cells were additionally exposed to doxycycline for the last 48 hours of the experiment where indicated. Cell viability was assessed using CellTiter Blue assay (J); apoptosis was assessed by Annexin V staining (K). Data represent means +SEM of 3 independent experiments. *P < .05, **P < .01, and ***P < .001 (2-tailed Students t test). (L) Expression levels of Gα12 and Gα13 during B-cell development, as determined using publicly available data from Genomicscape.24 Ctr, control; n.s., not significant.
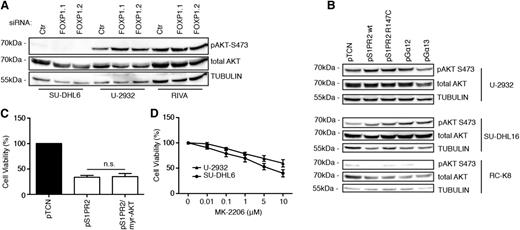
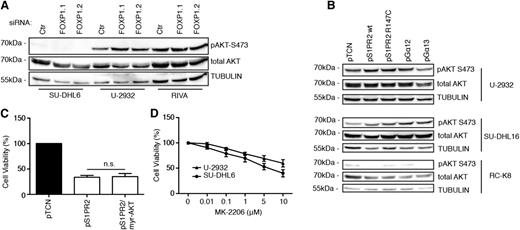
As S1PR2 signaling has been shown to inhibit AKT phosphorylation and AKT-driven migration,26 we speculated that S1PR2 signaling might impair DLBCL cell survival by preventing AKT-mediated survival signaling. However, we found no evidence for a role of AKT in S1PR2-driven cell death, as AKT activity (as determined by its phosphorylation on serine 473) did not change consistently upon FOXP1 knock-down (Figure 5A and supplemental Figure 5A) or ectopic S1PR2 or Gα12/13 expression (Figure 5B and supplemental Figure 5B-D) and a constitutively active, myristoylated form of AKT did not reverse the consequences of S1PR2 overexpression in DLBCL cell lines (Figure 5C). Furthermore, an inhibitor of AKT signaling had only modest effects on the viability of DLBCL cell lines at concentrations that strongly reduced AKT autophosphorylation on serine 473, and the susceptibility of individual cell lines did not correlate with their steady-state AKT activity (which is high in U-2932 and low in SU-DHL6 cells; Figure 5D and supplemental Figure 5E-F). The combined results suggest that the survival-promoting effects of FOXP1 depend on the repression of its target S1PR2 and of downstream proapoptotic signaling via the small G protein Gα13, but not on AKT-driven survival signaling.
AKT activity is neither affected by FOXP1/S1PR2 signaling nor required for DLBCL cell survival. (A-B) AKT activity was assessed by phospho-S473–specific western blotting of the indicated cell lines 72 hours after transfection with FOXP1-specific or control siRNAs (A) or after transfection with the indicated expression plasmids (B). Total AKT and α-TUBULIN are shown as loading controls. (C) Cell viability of U-2932 cells was measured by CellTiter Blue assay 48 hours after transfection with expression plasmids encoding S1PR2 and a myristoylated, constitutively active form of AKT. Data were normalized to empty plasmid (pTCN) and represent means + SEM of 3 independent experiments. (D) Cell viability of the indicated cell lines was measured by CellTiter Blue assay after 24 hours of treatment with the indicated concentrations of the AKT inhibitor MK-2206 or the vehicle control (dimethylsulfoxide). Data were normalized to vehicle control (dimethylsulfoxide) and are represented as means + SEM of 3 independent experiments.
AKT activity is neither affected by FOXP1/S1PR2 signaling nor required for DLBCL cell survival. (A-B) AKT activity was assessed by phospho-S473–specific western blotting of the indicated cell lines 72 hours after transfection with FOXP1-specific or control siRNAs (A) or after transfection with the indicated expression plasmids (B). Total AKT and α-TUBULIN are shown as loading controls. (C) Cell viability of U-2932 cells was measured by CellTiter Blue assay 48 hours after transfection with expression plasmids encoding S1PR2 and a myristoylated, constitutively active form of AKT. Data were normalized to empty plasmid (pTCN) and represent means + SEM of 3 independent experiments. (D) Cell viability of the indicated cell lines was measured by CellTiter Blue assay after 24 hours of treatment with the indicated concentrations of the AKT inhibitor MK-2206 or the vehicle control (dimethylsulfoxide). Data were normalized to vehicle control (dimethylsulfoxide) and are represented as means + SEM of 3 independent experiments.
S1PR2 is a bone fide tumor suppressor in DLBCL in vivo
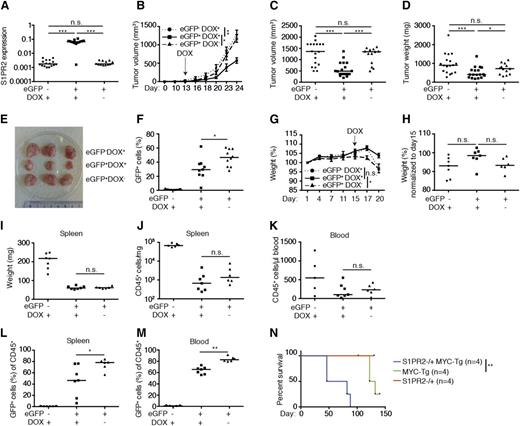
To examine whether the inducible expression of S1PR2 kills DLBCL cells in vivo, we subcutaneously implanted either 10 × 106 GFP-positive (>95% pure; data not shown) or GFP-negative SU-DHL6 cells into NSG mice, allowed palpable tumors to form, and induced transgene expression by administration of doxycycline via the chow. S1PR2 expression could be verified in GFP-positive cells from doxycycline recipients, but not the other 2 groups (Figure 6A); interestingly, S1PR2 expression strongly delayed tumor outgrowth in the majority of animals, as evidenced by the tumor volume and weight over time and at the study end point (Figure 6B-E). Interestingly, GFP-negative cells outcompeted GFP-positive (S1PR2-expressing) cells in all examined tumors exposed to doxycycline (Figure 6F), despite the fact that this population constituted <5% of the overall population at the time of transplantation.
The inducible expression of S1PR2 delays tumor growth in vivo. (A-F) NOD/SCID/IL2Rγ−/− mice were subcutaneously inoculated in both flanks with 1 × 10⁷ SU-DHL6 cells that had been transduced with pIND21-S1PR2 and sorted for enhanced GFP (eGFP). eGFP-negative cells were used as a negative control. Mice were switched to doxycycline-containing chow once tumors were palpable (on day 13 posttransplantation). Mice transplanted with eGFP-positive cells were maintained on normal chow as another negative control. The data shown were pooled from 2 independent experiments. (A) S1PR2 expression as determined by qRT-PCR (normalized to ACTIN) of resected tumors. (B-C) Tumor volume as determined over time (days posttransplantation, B; P values were calculated using 2-way analysis of variance with Tukey multiple comparison test) and at the study end point (C). (D) Tumor weight at the study end point. (E) Representative excised tumors of the indicated treatment groups. (F) eGFP-positive fraction of tumor cells at the study end point. (G-M) 1 × 10⁷ subcutaneously passaged SU-DHL6 (pIND21-S1PR2) cells were sorted for eGFP expression and injected into the tail veins of NOD/SCID/IL2Rγ−/− mice; mice were treated with doxycycline starting on day 15 post injection as described in panel A-F. (G) Body weight per mouse as recorded every 3 days for the 3 treatment arms (means ± SEM; P values were calculated using 2-way ANOVA with Tukey multiple comparison test). (H) Body weight change relative to day 15 post–tumor cell injection. (I-J) Spleen weight and tumor cell burden per milligram of spleen at the study end point. (K) Tumor cell burden in the blood at the study end point, as determined by CD45 staining. (L-M) Fraction of eGFP-positive cells in % of all human CD45-positive tumor cells in the spleens (L) and blood (M) of the indicated groups at the study end point. Horizontal lines indicate the medians, each symbol represents one tumor. *P < .05, **P < .01, and ***P < .001 (2-tailed Mann-Whitney U test for all panels except B, G, and N). (N) Kaplan-Meyer plot of S1PR2+/+/Emu-MYC-transgenic (MYC-tg), S1PR2+/− and S1PR2+/−/MYC-tg mice (4 per group). **P < .01; calculated with log-rank (Mantel-Cox) test. DOX, doxycycline; n.s., not significant.
The inducible expression of S1PR2 delays tumor growth in vivo. (A-F) NOD/SCID/IL2Rγ−/− mice were subcutaneously inoculated in both flanks with 1 × 10⁷ SU-DHL6 cells that had been transduced with pIND21-S1PR2 and sorted for enhanced GFP (eGFP). eGFP-negative cells were used as a negative control. Mice were switched to doxycycline-containing chow once tumors were palpable (on day 13 posttransplantation). Mice transplanted with eGFP-positive cells were maintained on normal chow as another negative control. The data shown were pooled from 2 independent experiments. (A) S1PR2 expression as determined by qRT-PCR (normalized to ACTIN) of resected tumors. (B-C) Tumor volume as determined over time (days posttransplantation, B; P values were calculated using 2-way analysis of variance with Tukey multiple comparison test) and at the study end point (C). (D) Tumor weight at the study end point. (E) Representative excised tumors of the indicated treatment groups. (F) eGFP-positive fraction of tumor cells at the study end point. (G-M) 1 × 10⁷ subcutaneously passaged SU-DHL6 (pIND21-S1PR2) cells were sorted for eGFP expression and injected into the tail veins of NOD/SCID/IL2Rγ−/− mice; mice were treated with doxycycline starting on day 15 post injection as described in panel A-F. (G) Body weight per mouse as recorded every 3 days for the 3 treatment arms (means ± SEM; P values were calculated using 2-way ANOVA with Tukey multiple comparison test). (H) Body weight change relative to day 15 post–tumor cell injection. (I-J) Spleen weight and tumor cell burden per milligram of spleen at the study end point. (K) Tumor cell burden in the blood at the study end point, as determined by CD45 staining. (L-M) Fraction of eGFP-positive cells in % of all human CD45-positive tumor cells in the spleens (L) and blood (M) of the indicated groups at the study end point. Horizontal lines indicate the medians, each symbol represents one tumor. *P < .05, **P < .01, and ***P < .001 (2-tailed Mann-Whitney U test for all panels except B, G, and N). (N) Kaplan-Meyer plot of S1PR2+/+/Emu-MYC-transgenic (MYC-tg), S1PR2+/− and S1PR2+/−/MYC-tg mice (4 per group). **P < .01; calculated with log-rank (Mantel-Cox) test. DOX, doxycycline; n.s., not significant.
We next established an orthotopic/systemic model of DLBCL by subcutaneously passaging GFP-positive and GFP-negative SU-DHL6 cells prior to their ex vivo expansion and intravenous injection into NSG mice. Cell populations were ∼95% pure at injection (data not shown). Doxycycline was administered to one-half of the recipients of GFP-positive cells and all GFP-negative cell recipients once tumor cells appeared in the circulation after 15 days of engraftment, as judged by positive staining for the human-specific leukocyte marker CD45 (data not shown). Whereas the recipients of GFP-negative cells and the recipients of GFP-positive cells not fed doxycycline began to lose weight at 17 days postengraftment, the weight of GFP-positive cell recipients remained relatively stable until the study end point (20 days postengraftment; Figure 6G-H). The overall tumor burden in both spleen and blood was highest in recipients of GFP-negative cells and similar in recipients of GFP-positive cells irrespective of doxycycline exposure (Figure 6I-K). However, as in the xenograft model, GFP-negative (doxycycline-unresponsive) cells outcompeted GFP-positive cells in all mice on doxycycline relative to mice not under selective pressure, increasing from only 5% of the tumor cell population at the time of injection to >30% of the population in blood and spleen at the study end point (Figure 6L-M). The combined results confirm that S1PR2 acts as a bona fide tumor suppressor in DLBCL in vivo in both subcutaneous and orthotopic models of the disease and delays or restricts tumor cell outgrowth upon inducible expression.
To confirm the tumor suppressor function of S1PR2 in another model, we generated mice that are either wild-type or harbor a heterozygous deletion of the S1PR2 gene and express MYC under the control of the immunoglobulin heavy chain enhancer (Emu-MYC). Interestingly, the loss of only 1 S1PR2 allele was sufficient to significantly accelerate the formation of MYC-driven nodal B-cell lymphomas (Figure 6N); once MYC+S1PR2+/− tumors had formed (in the spleen and various lymph nodes, especially cervical, mediastinal, brachial, and inguinal), they grew with similar kinetics as MYC+S1PR2+/+ tumors and were morphologically indistinguishable (data not shown). This model thus provides another piece of evidence for the tumor suppressive properties of S1PR2 in B cells and suggests that the loss of S1PR2 function is an early event in DLBC lymphomagenesis.
S1PR2 is a positive prognostic marker in DLBCL patients
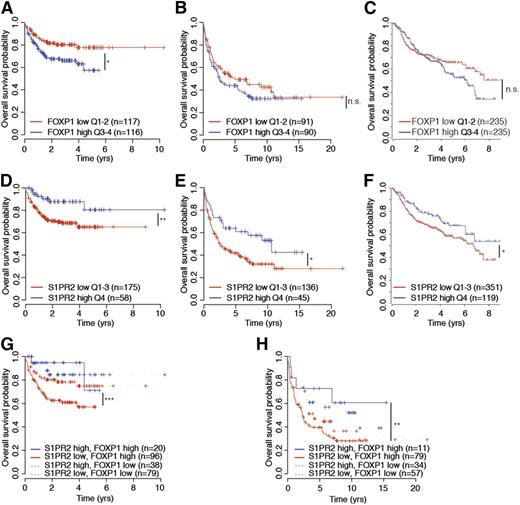
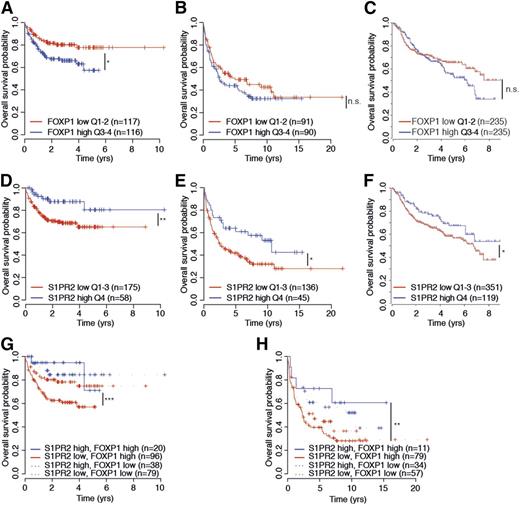
To assess a possible prognostic value of S1PR2 expression, alone and in combination with FOXP1 expression, we examined S1PR2 and FOXP1 transcript levels in 470 patients on R-CHOP therapy in the International DLBCL Rituximab-CHOP Consortium Program Study14 and the 181 and 233 patients on CHOP and R-CHOP therapy, respectively, in the Lymphoma/Leukemia Molecular Profiling Project23 in relation to their overall survival. High expression of FOXP1 was associated with inferior survival in all 3 cohorts, although the difference was not statistically significant in all cases (Figure 7A-C). Interestingly, high expression of S1PR2, which is inversely correlated with FOXP1 expression in all 3 cohorts as shown earlier (Figure 2), was a clear prognosticator of superior survival, alone and especially in combination with low FOXP1 expression (Figure 7D-F and Figure 7G-H, respectively) and predominantly in the ABC subtype of DLBCL (data not shown). The likelihood of survival was particularly dismal in patients with FOXP1hiS1PR2lo tumors and especially favorable in FOXP1loS1PR2hi cases, and high S1PR2 expression even allowed for accurate survival prognostication of FOXPhi cases (Figure 7G-H). Overall, the beneficial effect of S1PR2 expression on patient survival is consistent with its strong proapoptotic properties in DLBCL cell lines and provides an explanation for the robust survival advantage of DBLCL cells that is associated with FOXP1-mediated S1PR2 repression.
S1PR2 expression correlates directly with overall survival in DLBCL patients. (A-H) Kaplan–Meier curves displaying overall survival probability of 3 DLBCL patient cohorts (Gene Expression Omnibus accession numbers GSE31312 and GSE10846) treated either with R-CHOP (rituximab, cyclophosphamide, hydroxydaunorubicin, vincristine, and prednisone; A,C,D,F,G) or with CHOP only (B,E,H) as a function of FOXP1 expression (A-C), S1PR2 expression (D-F), and FOXP1/S1PR2 expression combined (G-H). All cohorts were subdivided based on low (<median) or high (>median) FOXP1 expression and low (first to third quartile) and high (fourth quartile) S1PR2 expression. The log-rank test was used for statistical analysis (*P < .05, **P < .01, and ***P < .001). The patient cohorts shown were enrolled in the Lymphoma/Leukemia Molecular Profiling Project (A-B,D-E,G-H) and in the International DLBCL Rituximab-CHOP Consortium Program Study (C,F). n.s., not significant.
S1PR2 expression correlates directly with overall survival in DLBCL patients. (A-H) Kaplan–Meier curves displaying overall survival probability of 3 DLBCL patient cohorts (Gene Expression Omnibus accession numbers GSE31312 and GSE10846) treated either with R-CHOP (rituximab, cyclophosphamide, hydroxydaunorubicin, vincristine, and prednisone; A,C,D,F,G) or with CHOP only (B,E,H) as a function of FOXP1 expression (A-C), S1PR2 expression (D-F), and FOXP1/S1PR2 expression combined (G-H). All cohorts were subdivided based on low (<median) or high (>median) FOXP1 expression and low (first to third quartile) and high (fourth quartile) S1PR2 expression. The log-rank test was used for statistical analysis (*P < .05, **P < .01, and ***P < .001). The patient cohorts shown were enrolled in the Lymphoma/Leukemia Molecular Profiling Project (A-B,D-E,G-H) and in the International DLBCL Rituximab-CHOP Consortium Program Study (C,F). n.s., not significant.
Discussion
In this study, we have combined ChIP sequencing and RNA sequencing with the functional analysis of individual target genes to identify novel FOXP1-regulated tumor suppressors in DLBCL. We found all our DLBCL cell lines to depend heavily on FOXP1 expression for growth and survival, irrespective of whether they were of ABC or GCB subtype. Consistent with a previous report,6 we found the shorter isoforms of FOXP1 to be somewhat more critical to cell survival than the full-length isoforms, although our siRNAs were not entirely specific for either one or the other. Of the 27 direct FOXP1 targets uncovered by our integrative approach, 10 exhibited proapoptotic activity upon ectopic expression and therefore represent candidates whose repression by FOXP1 is likely to contribute to FOXP1-driven tumor cell survival. We focused on the repressed target S1PR2, a GPCR, because its expression was strongly negatively correlated with FOXP1 expression in 2 large DLBCL patient cohorts. S1PR2 could be validated as a bona fide target of FOXP1 with strong proapoptotic activity in multiple cell lines. Ectopic expression of wild-type S1PR2 kills cells of both DLBCL subtypes with equal efficiency, suggesting that loss of S1PR2 expression is a critical pathogenetic event in both GCB as well as ABC DLBCL. Indeed, the loss of S1PR2 activity in (predominantly FOXP1-negative) GCB DLBCL was recently attributed to inactivating point mutations in the S1PR2 coding sequence, which either abrogate expression of the protein or are structurally damaging.26 Interestingly, such mutations are almost exclusively found in GCB DLBCL and hardly ever occur in (FOXP1-positive) ABC DLBCL.26 Earlier work had already identified numerous somatic mutations in the 5′ untranslated region of S1PR2 in DLBCL, with the location and context of the mutations pointing to aberrant somatic hypermutation as the underlying mechanism.27 Our data on FOXP1-driven S1PR2 repression imply that the conservation of 2 wild-type S1PR2 alleles in ABC DLBCL26 may be due to this alternative, transcriptional mechanism of abrogating S1PR2 expression, which should relieve negative selective pressure on the S1PR2 gene.
In GCB DLBCL, the critical contribution of S1PR2 has been attributed to its dual role in confining germinal center B cells to lymph nodes and thus preventing their recirculation and in growth inhibition; consequently, mice lacking direct downstream effectors of the S1PR2-regulated signaling pathway, ie, Gα13 or ARHGEF1, are characterized by the systemic dissemination of germinal center B cells and their seeding and growth in distant organs.26 Similarly, mice lacking both alleles of S1PR2 exhibit higher frequencies and greater size of spontaneously occurring germinal centers, and half of all mice develop B-cell lymphomas of GCB morphology and molecular characteristics by 1.5 to 2 years of age.27 Here, we show that S1PR2, in addition to its role in GC B-cell confinement and growth inhibition, exerts a direct tumor suppressive function in B cells by promoting tumor cell apoptosis: the ectopic expression of S1PR2, either upon electroporation of DLBCL cell lines with cDNA expression constructs or upon doxycycline-driven, inducible transgene expression from a genomic locus, rapidly induces tumor B-cell death in vitro and in vivo. Inducible S1PR2 expression alone is sufficient to strongly delay tumor development in vivo in a subcutaneous xenograft model. Additional results obtained using a novel systemic model of DLBCL engraftment and growth in the spleen and blood lend further support to the notion that S1PR2 functions as a general proapoptotic tumor suppressor in B cells. Apoptosis induction by S1PR2 involves its downstream mediator, Gα13, as a mutant incapable of interacting with this small G protein fails to trigger cell death, the ectopic expression of Gα13 (and also of the closely related Gα12) phenocopies the effects of ectopic S1PR2 expression, and the depletion of Gα13 rescues the proapoptotic effects of ectopic S1PR2 expression. Whereas the receptor-proximal signaling events via small G proteins thus promote both germinal center confinement26 and tumor cell apoptosis as shown here, we could not find evidence for a role of AKT inhibition in S1PR2-driven tumor cell death. Several lines of evidence indicate that although most DLBCL cell lines are modestly sensitive to AKT inhibitors, this may represent an off-target effect as sensitivity is not correlated with active AKT signaling. Furthermore, the ectopic expression of constitutively active, myristoylated AKT fails to rescue DLBCL cells from S1PR2-driven apoptosis, as would be expected if AKT-driven signaling were critical to cell survival. In conclusion, although the receptor-proximal signaling events, as well as the biological consequences of S1PR2 expression on cell survival, have now been elucidated in detail, the exact mechanism of apoptosis induction remains elusive. More work will be required to clarify the link between this GPCR, caspase activation, and apoptosis.
Aside from the implications of the newly identified FOXP1 target genes for DLBCL pathogenesis, our findings are also of interest with regard to normal GC B-cell function. We propose that the regulation of S1PR2 as well as of activation-induced cytidine deaminase (AID) by FOXP1, which we picked up in our ChIP of FOXP1-bound promoters and were able to confirm by ChIP-PCR and RNA sequencing after FOXP1 knockdown (data not shown), accounts for the negative regulatory effects of FOXP1 on the germinal center reaction. FOXP1 downregulation in GC B cells on the one hand allows for S1PR2 re-expression, GC retention, and negative selection of GC B cells and on the other hand promotes re-expression of AID and AID-induced class switching. We propose a model in which the downregulation of FOXP1 and subsequent derepression of S1PR2 and AID promote various key properties of GC B cells such as class switching, the ability to undergo apoptosis and allow for negative selection, and confinement to the GC area of the lymph node (see model in supplemental Figure 6). In summary, S1PR2 is a biologically relevant target of FOXP1 under physiological conditions as well as in tumor cells with aberrant FOXP1 expression, warranting further research into the pathways that are regulated by the FOXP1/S1PR2 signaling axis in health and disease states.
The online version of this article contains a data supplement.
The publication costs of this article were defrayed in part by page charge payment. Therefore, and solely to indicate this fact, this article is hereby marked “advertisement” in accordance with 18 USC section 1734.
Acknowledgments
The authors thank Carmelo C. Stella for sharing DLBCL cell lines and are very grateful to Richard L. Proia for donating S1PR2−/− mice. RNA sequencing and ChIP sequencing were performed at the Functional Genomics Center Zurich.
This work was supported by grants from the Swiss Cancer League (KFS-02640-08-2010 and KLS-3612-02-2015) and the Cancer League of the Canton of Zurich (A.M.). M.D.R. acknowledges financial support from the Swiss National Science Foundation (project grant 143883) and from the European Commission through the 7th Framework Collaborative Project RADIANT (grant 305626). A.T. is supported by the Foundation for the Fight against Cancer, Zurich.
Authorship
Contribution: C.W.L. and M.D.R. helped with analysis of sequencing data; M.F., C.A.S., A.T., and E.T.S. performed research; and M.F. and A.M. designed research, analyzed data, and wrote the manuscript.
Conflict-of-interest disclosure: The authors declare no competing financial interests.
Correspondence: Anne Müller, Institute of Molecular Cancer Research, University of Zürich, Winterthurerstrasse 180, 8057 Zürich, Switzerland; e-mail: mueller@imcr.uzh.ch.

