Key Points
LSD1 is barely expressed in normal hematopoietic stem cells, but is overexpressed in leukemias especially those of a T-cell origin.
LSD1 overexpression forms preleukemic stem cells with an increased self-renewal potential in a transgenic mice model.
Abstract
Recent investigations indicate that epigenetic regulators act at the initial step of myeloid leukemogenesis by forming preleukemic hematopoietic stem cells (HSCs), which possess the increased self-renewal potential but retain multidifferentiation ability, and synergize with genetic abnormalities in later stages to develop full-blown acute myeloid leukemias. However, it is still unknown whether this theory is applicable to other malignancies. In this study, we demonstrate that lysine-specific demethylase 1 (LSD1) overexpression is a founder abnormality for the development of T-cell lymphoblastic leukemia/lymphoma (T-LBL) using LSD1 transgenic mice. LSD1 expression is tightly regulated via alternative splicing and transcriptional repression in HSCs and is altered in most leukemias, especially T-LBL. Overexpression of the shortest isoform of LSD1, which is specifically repressed in quiescent HSCs and demethylates histone H3K9 more efficiently than other isoforms, increases self-renewal potential via upregulation of the HoxA family but retains multidifferentiation ability with a skewed differentiation to T-cell lineages at transcriptome levels in HSCs. Transgenic mice overexpressing LSD1 in HSCs did not show obvious abnormalities but developed T-LBL at very high frequency after γ-irradiation. LSD1 overexpression appears to be the first hit in T-cell leukemogenesis and provides an insight into novel strategies for early diagnosis and effective treatment of the disease.
Introduction
Epigenetic modifications have been implicated in various biological processes of considerable importance, such as cell proliferation and differentiation.1 Recent systematic investigations revealed that epigenetic deregulation plays fundamental roles in oncogenesis, especially the development of hematologic malignancies.2,3 More importantly, epigenetic abnormalities generally act as initiating mutations, which transform normal stem cells into cancer stem cells at the initial step of oncogenesis. For example, recurrent mutations of DNA methyltransferase 3A (DNMT3A) or isocitrate dehydrogenase (IDH) 1/2 give rise to preleukemic hematopoietic stem cells (HSCs), which possess a higher self-renewal potential than normal counterparts but retain multidifferentiation capacity.4-6 Additional genetic abnormalities, such as nucleophosmin 1 mutations and FLT3-internal tandem duplication, confer further growth advantages and malignant phenotypes to preleukemic HSCs, leading to the development of full-blown acute myeloid leukemias (AML). Similar initiator functions have been demonstrated in other epigenetic regulators, such as the methylcytosine hydroxylase TET2, histone methyltransferase EZH2, and Polycomb-related protein ASXL2, in myeloid leukemogenesis.7-10 However, it is still unknown whether this theory is applicable to other malignancies.
Lysine-specific demethylase 1 (LSD1 also named KDM1A/AOF2/BHC110) is an flavin adenine dinucleotide (FAD)-dependent histone demethylase that specifically removes the monomethyl and dimethyl groups from lysine-4 and lysine-9 residues of histone H3.11 Hence, LSD1 bifunctionally modulates the enhancer/promoter functions of target genes in a context-dependent manner.12 LSD1 mediates a repressive function via H3K4 demethylation as a component of the REST corepressor (CoREST) and nucleosome remodeling and deacetylase (NuRD) complexes,13 whereas it activates hormone-regulated genes via H3K9 demethylation when associated with androgen or estrogen receptors.14 Moreover, LSD1 has 4 isoforms with different histone demethylating activities and affinities to CoREST, offering an additional layer of functional regulation.15
Recent genetic approaches revealed that LSD1 is indispensable for broad tissue homeostasis and proper development.16 In the hematopoietic system, Sprüssel et al17 demonstrated that short hairpin RNA (shRNA)-mediated knockdown of LSD1 impairs maturation of blood cells in association with the expansion of undifferentiated hematopoietic stem/progenitor cells (HSPCs) and committed progenitors in mice. On the other hand, LSD1 was shown to be essential for the self-renewal and proper differentiation of HSCs in conditional LSD1 knockout mice.18 Furthermore, it is of note that LSD1 expression is elevated in neuroblastoma and bladder cancer19,20 and is correlated with a poor prognosis in hormone-dependent prostate and breast cancers.21
From these observations, we hypothesized that the expression levels and function of LSD1 are tightly regulated in HSPCs and their deregulation underlies the development of hematologic malignancies. This idea is compatible with the initiating role of epigenetic deregulation in leukemogenesis, but has not yet been experimentally proven. In the present study, we investigated whether the abnormalities of LSD1 cause the malignant transformation of HSPCs by generating transgenic mice that overexpress an LSD1 isoform in HSPCs under the control of the Sca-1 promoter.
Methods
Cells
Human bone marrow mononuclear cells and CD34+ progenitors were purchased from Takara Bio. CD34−/lineage markers (Lin)− and CD34−/Lin+ cells were separated with CD34 microbeads and lineage cell depletion kits (Miltenyi Biotec). CD34+/CD38+ and CD34+/CD38− cells were purified with an anti-human CD38 antibody in the Easy Sep system (StemCell Technologies). Leukemic cell lines were handled as described previously.22 Primary leukemic cells were isolated at the time of diagnostic procedure from patients after obtaining informed consent in accordance with the Declaration of Helsinki and the protocol approved by the institutional review board of Jichi Medical University. We used specimens containing >90% blasts on morphological and phenotypic examinations. Fractionation of murine HSCs and HSPCs was performed according to the protocol of Oguro et al.23
Colony formation and replating assays
Purified Lin−/Sca-1+/c-Kit+ (LSK) and Lin−/Sca-1−/c-Kit+ cells (5 × 10⁵ cells) were plated in triplicate in methylcellulose M3231 medium (StemCell Technologies) supplemented with stem cell-oriented cytokines. The colony number was scored after 7 days, followed by second and third platings.
Polymerase chain reaction
We performed reverse transcription–polymerase chain reaction (RT-PCR) and real-time quantitative RT-PCR as described previously.15,24 TCRβ rearrangement was analyzed by genomic PCR according to Shen et al.25 Primer sequences are listed in supplemental Table 1 (see supplemental Data available at the Blood Web site).
Plasmids and transfection
Full-length complementary DNAs (cDNAs) for LSD1 transcript variants 1 (BC040194, E2a+/E8a+) and 2 (BC048134, E2a−/E8a−) were purchased from Open Biosystems. We constructed cDNA for LSD1 isoform E2a+/E8a− from variants 1 and 2 as described by Zibetti et al.15 Lentiviral expression vectors were constructed by inserting full-length cDNAs into a CSII-CMV-MCS-IRES DsRed vector as reported.26
Immunoblotting
We carried out immunoblotting using specific antibodies against LSD1 (Diagenode and Cell Signaling Technology), G9a, Suv39H1 (Cell Signaling Technology), PHF8/JHDM1F (Active Motif), JARID1B (Sigma-Aldrich), dimethylated H3K4 (Active Motif), dimethylated H3K9 (Abcam), histone H3, and glyceraldehyde-3-phosphate dehydrogenase (GAPDH; Cell Signaling Technology).
In vitro histone demethylase assay
In vitro translated LSD127 (0-20 μg) was incubated with 8 μg of calf thymus histones (Roche) or 0.3 μg of purified HeLa mononucleosomes (EpiCypher) with or without 3.9 µM recombinant CoREST (BPS BioScience), followed by immunoblotting using methyl-specific antibodies.
Mice
To generate the LSD1 transgenic mice C57BL/6J-Tg(Ly6a-KDM1A*v2), human LSD1 cDNA encoding the shortest isoform (E2a−/E8a−) and an SV40 early polyadenylation (pA) signal were inserted into the Ly-6A cassette (pLy-6A14) that contains the mouse Sca-1 gene and its regulatory regions.28 The DNA fragment containing the mouse Sca-1 promoter and human LSD1 cDNA with a pA signal was excised with NotI and microinjected into the pronuclei of C57BL/6 mice as described.29 The copy number of the transgene was determined by blotting mouse tail DNA with human LSD1 cDNA as a probe and comparing the band intensity with copy controls of the injection fragment. Pathological examination of mice was conducted by outside experts. All animal studies were approved by the Institutional Animal Ethics Committee and performed in accordance with the Guide for the Care and Use of Laboratory Animals formulated by the National Academy of Sciences.
Stem cell transplantation in syngeneic mice
Bone marrow mononuclear cells were isolated from LSD1 transgenic and control mice at 8 to 12 weeks of age, and injected via the tail vein into lethally irradiated (9.5 Gy) C57BL/6 (CD45.1) recipient mice (8-12 weeks of age) with 2 × 10⁵ backup cells.30 Engraftment was confirmed by measuring the percentage of CD45.2+ cells in the peripheral blood. Subsequent transplantations were similarly performed using 2 × 10⁶ bone marrow cells with a 12-week interval.
Cell cycle analysis in vivo
Bone marrow cells were harvested 40 minutes after IP injection of bromodeoxyuridine (1.5 mg/150 μL) and stained with the APC BrdU Flow kit (BD Pharmingen) to determine cell cycle distribution on flow cytometry.
Global analysis of messenger RNA expression
RNA samples (3 μg) were labeled using T4 RNA ligase in duplicate, and hybridized with the Gene Chip Mouse Genome 430 2.0 Array (Affymetrix). The hybridized arrays were scanned with a GeneChip Scanner 3000, and the scanned images were processed using GeneChip operating software (Affymetrix).
Results
LSD1 is barely expressed in normal HSPCs, but is overexpressed in leukemic cells
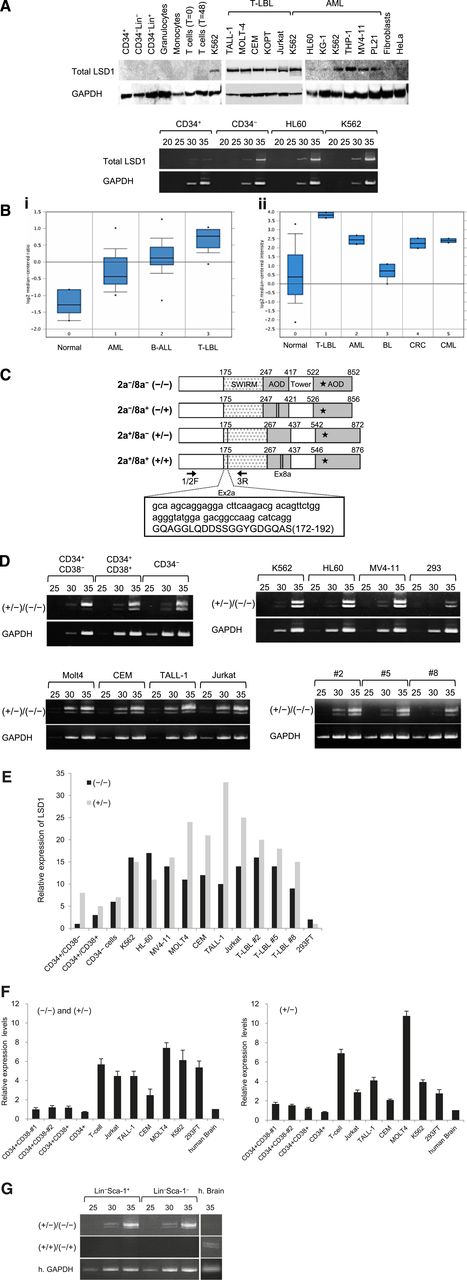
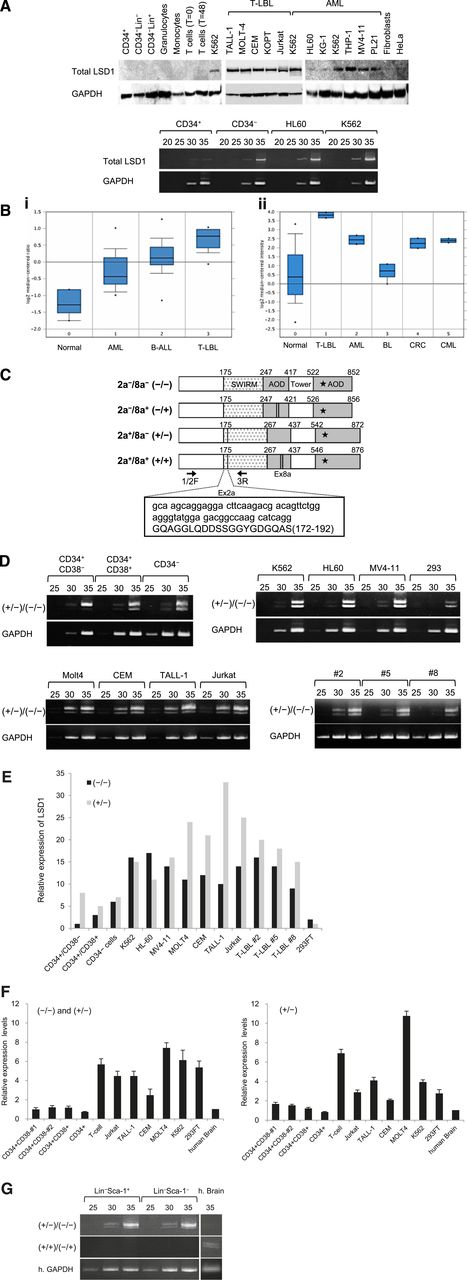
In an initial effort to clarify the role of LSD1 in leukemogenesis, we compared the expression of LSD1 between normal human hematopoietic cells and leukemic cell lines at protein and messenger RNA (mRNA) levels. LSD1 protein was under the detection limit in normal human hematopoietic cells including CD34+ HSPCs, CD34− bone marrow progenitors, lineage marker-positive bone marrow cells, and mature blood cells (Figure 1A top panel). LSD1 expression was also very low in CD34+ HSPCs but was slightly upregulated in CD34−/Lin– progenitors at the mRNA level (Figure 1A bottom panel). In contrast, LSD1 was strongly expressed in most leukemic cell lines, especially those derived from T-lymphoblastic leukemia/lymphoma (T-LBL) and those harboring leukemic fusion proteins such as K562 (BCR-ABL+), THP-1 (MLL-AF9+), MV4-11 (MLL-AF4+), and PL-21 (PML-RARα+) (Figure 1A top panel). LSD1 overexpression was confirmed at the mRNA level in leukemic cell lines (Figure 1A bottom panel). In addition, we analyzed LSD1 mRNA expression in primary samples using published data sets from the Oncomine microarray database and verified LSD1 overexpression in primary leukemic cells relative to normal bone marrow cells. Consistent with the results of the cell line studies, LSD1 expression was the highest in primary T-LBL cells, followed by BCR-ABL carrying chronic myelogenous leukemia and AML in primary samples (Figure 1B).
LSD1 is barely expressed in normal HSPCs, but is overexpressed in leukemic cells. (A) Top panel, We isolated whole-cell lysates from normal human bone marrow cells (CD34+ HSPCs, CD34−/Lin− progenitors, and Lin+ cells), mature blood cells (granulocytes, monocytes, uncultured T lymphocytes, and 24-hour–stimulated T lymphocytes), T-LBL cell lines (TALL-1, MOLT-4, CEM, KOPT-K1, and Jurkat), myeloid leukemia cell lines (K562, HL-60, KG-1, THP-1, MV4-11, and PL-21), normal human fibroblasts, and the cervical carcinoma cell line HeLa for immunoblot analyses on the expression of LSD1 and GAPDH (internal control). Bottom panel, We isolated total cellular RNA from the indicated cells and subjected them to semiquantitative RT-PCR analysis for the expression of LSD1 and GAPDH. The PCR products of suboptimal amplification cycles, 20 to 35 cycles, were electrophoresed (5 μL per lane). (B) LSD1 mRNA expression in primary samples according to the Oncomine database (http://www.oncomine.org). Panel Bi: 0, normal bone marrow mononuclear cells (n = 6); 1, AML (n = 23); 2, B-cell acute lymphoblastic leukemia (n = 87); 3, T-LBL (n = 11). Panel Bii: 0, various normal somatic cells (n = 146); 1, T-LBL (n = 2); 2, AML (n = 2); 3, Burkitt lymphoma (n = 4); 4, colorectal cancer (n = 2); 5, chronic myelogenous leukemia (n = 2). *P < .05 determined by a 1-way ANOVA with the Bonferroni post hoc test. (C) The structure of 4 LSD1 isoforms generated by either the single or double inclusion of 2 alternative exons 2a (Ex2a) and 8a (Ex8a). *The FAD-binding domain. We designed PCR primers 1/2F and 3R (arrows) to detect LSD1 isoforms (−/−) and (+/−) discriminately based on differences in sizes (60 bp as shown in the box). (D) We performed semiquantitative RT-PCR for the expression of LSD1 isoforms in normal human hematopoietic progenitors, leukemic cell lines, and primary T-LBL cells from 3 patients (cases 2, 5, and 8). The cDNAs were amplified with primers covering the entire exons (1F and 19R; see supplemental Table 1 for nucleotide sequences), followed by nested PCR with primers 1/2F and 3R as reported by Zibetti et al.15 (E) The signal intensities of each band at 35 cycles in panel D were quantified by NIH Image J software, normalized to those of corresponding GAPDH, and shown as relative values setting the expression level of LSD1 (−/−) in CD34+/CD38− cells to 1.0. (F) We quantified the mRNA expression of total LSD1, mostly (−/−) and (+/−), with 1/2F and 3R primers and the isoform (+/−) with 1/2F and 2aR (within exon 2a) primers using the Power SYBR Green PCR Master Mix (Life Technologies). The expression level was normalized to that of GAPDH and quantified by the 2-ΔΔCt method. The means ± SD (bars) of 3 independent experiments are shown. (G) We isolated total cellular RNA from murine Lin–/Sca-1+/c-Kit+ and Lin−/Sca-1−/c-Kit+ cells, and subjected them to nested RT-PCR for the expression of murine LSD1 isoforms with primer pairs of 2F and 3R (top panel) or 2F and 8/9R (middle panel) (see supplemental Table 1 for nucleotide sequences). ANOVA, analysis of variance; CT, cycle threshold; SD, standard deviation.
LSD1 is barely expressed in normal HSPCs, but is overexpressed in leukemic cells. (A) Top panel, We isolated whole-cell lysates from normal human bone marrow cells (CD34+ HSPCs, CD34−/Lin− progenitors, and Lin+ cells), mature blood cells (granulocytes, monocytes, uncultured T lymphocytes, and 24-hour–stimulated T lymphocytes), T-LBL cell lines (TALL-1, MOLT-4, CEM, KOPT-K1, and Jurkat), myeloid leukemia cell lines (K562, HL-60, KG-1, THP-1, MV4-11, and PL-21), normal human fibroblasts, and the cervical carcinoma cell line HeLa for immunoblot analyses on the expression of LSD1 and GAPDH (internal control). Bottom panel, We isolated total cellular RNA from the indicated cells and subjected them to semiquantitative RT-PCR analysis for the expression of LSD1 and GAPDH. The PCR products of suboptimal amplification cycles, 20 to 35 cycles, were electrophoresed (5 μL per lane). (B) LSD1 mRNA expression in primary samples according to the Oncomine database (http://www.oncomine.org). Panel Bi: 0, normal bone marrow mononuclear cells (n = 6); 1, AML (n = 23); 2, B-cell acute lymphoblastic leukemia (n = 87); 3, T-LBL (n = 11). Panel Bii: 0, various normal somatic cells (n = 146); 1, T-LBL (n = 2); 2, AML (n = 2); 3, Burkitt lymphoma (n = 4); 4, colorectal cancer (n = 2); 5, chronic myelogenous leukemia (n = 2). *P < .05 determined by a 1-way ANOVA with the Bonferroni post hoc test. (C) The structure of 4 LSD1 isoforms generated by either the single or double inclusion of 2 alternative exons 2a (Ex2a) and 8a (Ex8a). *The FAD-binding domain. We designed PCR primers 1/2F and 3R (arrows) to detect LSD1 isoforms (−/−) and (+/−) discriminately based on differences in sizes (60 bp as shown in the box). (D) We performed semiquantitative RT-PCR for the expression of LSD1 isoforms in normal human hematopoietic progenitors, leukemic cell lines, and primary T-LBL cells from 3 patients (cases 2, 5, and 8). The cDNAs were amplified with primers covering the entire exons (1F and 19R; see supplemental Table 1 for nucleotide sequences), followed by nested PCR with primers 1/2F and 3R as reported by Zibetti et al.15 (E) The signal intensities of each band at 35 cycles in panel D were quantified by NIH Image J software, normalized to those of corresponding GAPDH, and shown as relative values setting the expression level of LSD1 (−/−) in CD34+/CD38− cells to 1.0. (F) We quantified the mRNA expression of total LSD1, mostly (−/−) and (+/−), with 1/2F and 3R primers and the isoform (+/−) with 1/2F and 2aR (within exon 2a) primers using the Power SYBR Green PCR Master Mix (Life Technologies). The expression level was normalized to that of GAPDH and quantified by the 2-ΔΔCt method. The means ± SD (bars) of 3 independent experiments are shown. (G) We isolated total cellular RNA from murine Lin–/Sca-1+/c-Kit+ and Lin−/Sca-1−/c-Kit+ cells, and subjected them to nested RT-PCR for the expression of murine LSD1 isoforms with primer pairs of 2F and 3R (top panel) or 2F and 8/9R (middle panel) (see supplemental Table 1 for nucleotide sequences). ANOVA, analysis of variance; CT, cycle threshold; SD, standard deviation.
LSD1 isoforms are differentially expressed in normal HSCs and leukemic cells
Mammals have 4 LSD1 isoforms generated by either the single or double inclusion of 2 alternative exons 2a and 8a, which are located in the Swi3p, Rsc8p and Moira (SWIRM) and amine oxidase domains, respectively (Figure 1C). Although the neuron-specific expression of exon 8a-retaining splice variants has been reported previously,15 no information is available regarding the expression pattern and biological functions of LSD1 isoforms in the hematopoietic system. To address this issue, we attempted to detect LSD1 isoforms discriminately using isoform-specific RT-PCR (supplemental Table 1). Hematopoietic cells expressed the isoform (−/−), which carries no additional exons, and the isoform (+/−), which has the insertion of exon 2a (Figure 1D). Neuron-specific isoforms (+/+) and (−/+) were undetectable in either normal or malignant hematopoietic cells (supplemental Figure 1A). Among normal bone marrow cells, the isoform (−/−) was barely detected in CD34+/CD38− HSCs and was upregulated in CD34+/CD38+ multipotent progenitors and CD34−/Lin− committed progenitors by semiquantitative RT-PCR (Figure 1D-E) and real-time quantitative RT-PCR (Figure 1F). In contrast, leukemic cells, including primary samples from 3 patients with T-LBL, apparently overexpressed both (−/−) and (+/−) forms (Figure 1D-F). Finally, we investigated whether the same expression pattern of LSD1 isoforms is retained in murine HSPCs. The isoform (−/−) was faintly expressed in LSK and Lin−/Sca-1−/c-Kit+ fractions, as observed in human CD34+/CD38− HSCs, whereas the expression of the isoform (+/−) was relatively strong (Figure 1G). Neuron-specific isoforms (+/+) and (−/+) were also undetectable in murine hematopoietic cells.
The shortest isoform of LSD1 displays robust histone H3K9 demethylating activity in vivo
To gain insights into functional differences between the LSD1 isoforms, we compared histone demethylating activity of the 2 isoforms in vitro and in vivo. The in vitro histone demethylation assay revealed that the isoform (−/−) readily demethylated both H3K4 and H3K9 in naked histones even in the absence of CoREST, whereas the isoform (+/−) had little if any H3K9 demethylating activity and weak H3K4 demethylating activity (Figure 2A left half). The same assay using nucleosomes yielded slightly different results: H3K4 demethylation was detected only with the isoform (−/−) in the presence of CoREST and very weak H3K9 demethylation was observed with the isoform (+/−) in the absence of CoREST (Figure 2A right half). As the experiments with nucleosomes might reflect the in vivo situation more accurately, we attempted to confirm these results by analyzing the methylation status of endogenous histones in HEK293 cells after the overexpression of each isoform. The isoform (−/−) demethylated H3K9 robustly and H3K4 moderately, whereas the isoform (+/−) displayed very weak activity for both residues in HEK293 cells (Figure 2B left panel; supplemental Figure 1B). The discrepancy between the results of in vitro demethylation and in vivo transfection assays might be due to the effects of LSD1 on other histone modification enzymes. To investigate this possibility, we examined the expression of H3K9 methyltransferases G9a and Suv39H1, H3K9 demethylase PHF8/JHDM1F and H3K4 demethylase JARID1B in LSD1-overexpressing HEK293 cells. As shown in Figure 2B (right panel), LSD1 readily increased and decreased the expression levels of PHF8/JHDM1F and JARID1B, respectively. Combined with the expression data, we propose the model that low LSD1 activity is required to maintain HSCs in a quiescent state and an increase in LSD1 activity, especially that against H3K9, via the upregulation of the isoform (−/−) shifts quiescent HSCs to an active/cycling state (Figure 2C).
Differential functions of LSD1 isoforms. (A) Calf thymus histones or HeLa mononucleosomes were incubated with purified LSD1 (0, 2, and 20 μg) with or without recombinant CoREST, followed by immunoblotting using specific antibodies or silver staining (LSD1 and histones) (top panel). Signal intensities were quantified and shown as relative values of corresponding untreated controls (bottom panel). (B) Whole-cell lysates were prepared from HEK293 cells transfected with expression vectors for LSD1 isoform (−/−) or (+/−), and subjected to immunoblotting with the indicated antibodies. Signal intensities were quantified and shown as relative values of corresponding mock transfectants. (C) LSD1 expression and activity in HSPCs (see “Results” for details).
Differential functions of LSD1 isoforms. (A) Calf thymus histones or HeLa mononucleosomes were incubated with purified LSD1 (0, 2, and 20 μg) with or without recombinant CoREST, followed by immunoblotting using specific antibodies or silver staining (LSD1 and histones) (top panel). Signal intensities were quantified and shown as relative values of corresponding untreated controls (bottom panel). (B) Whole-cell lysates were prepared from HEK293 cells transfected with expression vectors for LSD1 isoform (−/−) or (+/−), and subjected to immunoblotting with the indicated antibodies. Signal intensities were quantified and shown as relative values of corresponding mock transfectants. (C) LSD1 expression and activity in HSPCs (see “Results” for details).
The shortest isoform of LSD1 positively regulates the self-renewal of HSCs
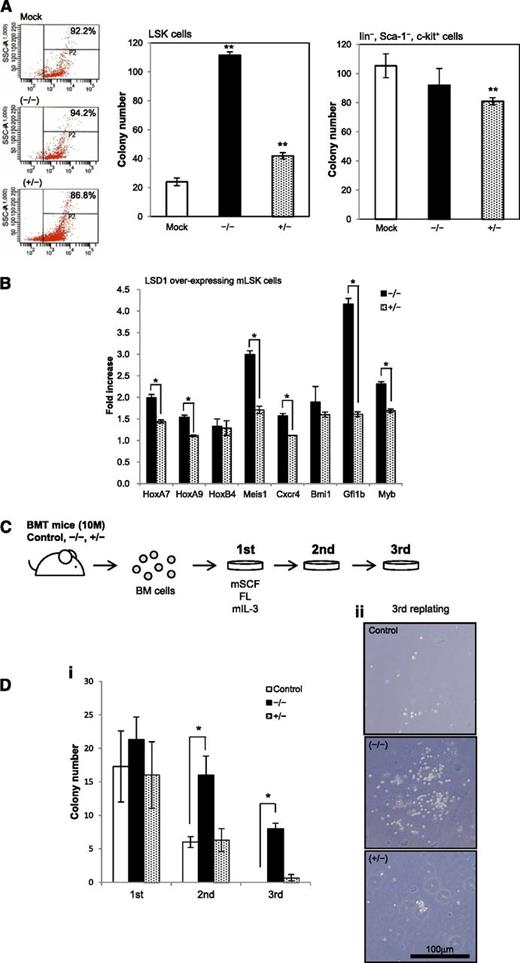
To verify the proposed model, we performed colony assays using mouse bone marrow cells transduced with each LSD1 isoform by the aid of the lentiviral expression system. When LSD1 isoform (−/−) was overexpressed, LSK cells formed fivefold more colonies than mock-transduced control (Figure 3A). The isoform (+/−) also significantly increased the colony numbers of LSK cells, but the effect was less prominent than that of the isoform (−/−). This isoform significantly inhibited the clonogenic growth of c-Kit–positive differentiated progenitors, suggesting that the expression level of the isoform (+/−) should be maintained at appropriate levels in progenitor cells. These results prompted us to examine the expression of genes that govern the expansion of HSCs in LSD1-overexpressing LSK cells using real-time RT-PCR. LSD1 induced the upregulation of HoxA7, HoxA9, Meis1, Cxcr4, Gfi1b, and c-Myb in LSK cells, which was obviously stronger with the isoform (−/−) than the isoform (+/−) (Figure 3B). Via the induction of these genes, LSD1 especially the isoform (−/−) may increase the self-renewal capacity of HSCs.
The shortest isoform of LSD1 positively regulates the self-renewal of HSCs. (A) We transduced LSK and Lin−/Sca-1−/c-Kit+ cells from normal mouse bone marrow with an empty plasmid (Mock) or expression vectors for LSD1 isoforms (−/−) and (+/−) for 48 hours, and cultured them in methylcellulose medium for 7 days to evaluate the clonogenic growth. Signal intensity of DsRed is shown in the left panel as a surrogate marker of LSD1 expression in starting materials. (B) Total cellular RNA was isolated from LSK cells transduced with LSD1 isoforms (−/−) or (+/−), and subjected to real-time quantitative RT-PCR for the expression of the indicated genes. Data were quantified by the 2-∆∆Ct method using simultaneously amplified GAPDH as a reference and shown as fold increases against mock-transfected controls. (C) c-Kit–positive bone marrow mononuclear (BM) cells were transduced with an empty vector (Control), LSD1 isoform (−/−) or (+/−), and transplanted into lethally irradiated recipient mice. We isolated bone marrow mononuclear cells from recipient mice 10 months after transplantation and performed colony-replating assays in the presence of murine stem cell factor (mSCF), FLT3 ligand (FL), and murine interleukin-3 (IL-3) at 50, 50, and 10 ng/mL, respectively. (D) The means ± SD (bars) of colony numbers in each passage (i) and representative photographs of colonies (ii) are shown. *P < .01 and **P < .05 determined by a 1-way ANOVA with the Bonferroni post hoc test (n = 3).
The shortest isoform of LSD1 positively regulates the self-renewal of HSCs. (A) We transduced LSK and Lin−/Sca-1−/c-Kit+ cells from normal mouse bone marrow with an empty plasmid (Mock) or expression vectors for LSD1 isoforms (−/−) and (+/−) for 48 hours, and cultured them in methylcellulose medium for 7 days to evaluate the clonogenic growth. Signal intensity of DsRed is shown in the left panel as a surrogate marker of LSD1 expression in starting materials. (B) Total cellular RNA was isolated from LSK cells transduced with LSD1 isoforms (−/−) or (+/−), and subjected to real-time quantitative RT-PCR for the expression of the indicated genes. Data were quantified by the 2-∆∆Ct method using simultaneously amplified GAPDH as a reference and shown as fold increases against mock-transfected controls. (C) c-Kit–positive bone marrow mononuclear (BM) cells were transduced with an empty vector (Control), LSD1 isoform (−/−) or (+/−), and transplanted into lethally irradiated recipient mice. We isolated bone marrow mononuclear cells from recipient mice 10 months after transplantation and performed colony-replating assays in the presence of murine stem cell factor (mSCF), FLT3 ligand (FL), and murine interleukin-3 (IL-3) at 50, 50, and 10 ng/mL, respectively. (D) The means ± SD (bars) of colony numbers in each passage (i) and representative photographs of colonies (ii) are shown. *P < .01 and **P < .05 determined by a 1-way ANOVA with the Bonferroni post hoc test (n = 3).
To confirm the ability of LSD1 isoform (−/−) to enhance the self-renewal of HSCs, we conducted long-term reconstitution and replating assays. c-Kit–positive bone marrow cells were prepared from donor mice, transduced with either LSD1 isoform (−/−) or (+/−), and injected into lethally irradiated recipient mice. As illustrated in Figure 3C, we isolated bone marrow mononuclear cells from recipient mice 10 months after transplantation and performed colony assays. The replating ability of bone marrow cells from LSD1 (−/−)-transduced mice was significantly stronger than that of bone marrow cells from mock- and LSD1 (+/−)-transduced mice. Notably, LSD1 (−/−)-transduced cells were able to form colonies after third replating (Figure 3D). These results imply that the overexpression of the shortest isoform of LSD1 could cause leukemic conversion of HSCs. However, recipient mice did not develop leukemias or any hematopoietic deregulation by 16 months after transplantation, suggesting that LSD1 overexpression alone is not sufficient for malignant transformation. In support of this view, LSD1-transduced cells were not able to survive beyond 3 passages in colony replating assays (data not shown).
The shortest isoform of LSD1 enhances the stemness and self-renewal of HSPCs in vivo
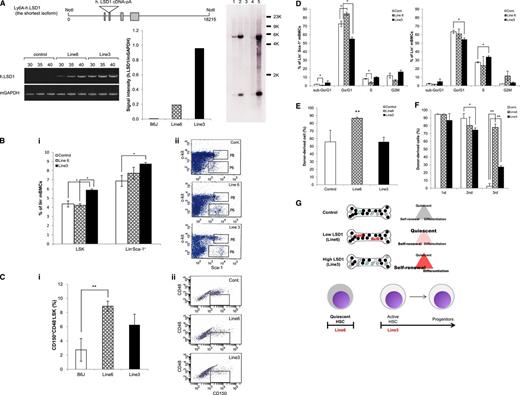
The results so far suggest that the shortest isoform of LSD1 is repressed in normal HSCs and its overexpression predisposes to the development of acute leukemias via transactivation of genes involved in self-renewal and leukemogenesis such as HoxA9. To obtain compelling evidence supporting this notion, we generated a transgenic mouse overexpressing LSD1 isoform (−/−) in HSPCs under the control of the Sca-1 promoter (Figure 4A top panel). We established 2 transgenic lines with different copy numbers and expression of integrated LSD1. As shown in Figure 4A (bottom panel), the expression level of human LSD1 mRNA was fivefold higher in line 3 than in line 6, possibly reflecting the copy numbers of the transgene: one copy in line 6 and ∼30 copies in line 3 (Figure 4A right panel; see supplemental Table 2 for possible integration sites). To investigate the effects of LSD1 overexpression on the self-renewal capacity of HSPCs in vivo, we measured the size of LSK and Lin−/Sca-1+ fractions of these mice using flow cytometry. The proportions of cells in both fractions were significantly increased in the high-expression line (Figure 4B). As LSK fractions contain HSCs and multipotent progenitors, we further fractionated LSK cells using CD150 and CD48, and found that CD150+/CD48−/LSK cells, which are highly enriched for long-term HSCs,23 were exclusively increased in the low-expression line (Figure 4C). Consistent with these results, Lin−/Sca-1+ cells in the low-expression line showed an increase in the G0/G1 phase and a decrease in sub-G0/G1 and S phases in vivo. The high-expression line showed a significant decrease in the G0/G1 phase in both Lin−/Sca-1+ and Lin− bone marrow cells and an increase in the S phase in the latter (Figure 4D).
The shortest isoform of LSD1 enhances the stemness and self-renewal of HSPCs in vivo. (A) Top panel, schematic view of the injected fragment for the generation of LSD1 transgenic mice. Bottom panel, we quantified the expression of human LSD1 and murine GAPDH (internal control) transcripts in 2 lines of LSD1 transgenic and B6J (Control) mice using specific primers (supplemental Table 1). Right panel, genomic DNA (5 µg) was digested with BamHI and hybridized with LSD1 cDNA as a probe to estimate copy numbers of transgene. Lane 1, DNA from wild-type mice + 2 copies of the injection fragment; lane 2, DNA from wild-type mice + 20 copies of the injection fragment; lane 3, DNA from wild-type mice; lane 4, DNA from line 6 mice; lane 5, DNA from line 3 mice. (B) We determined the percentage of LSK and Lin−/Sca-1+ cells in the bone marrow of 2 lines of LSD1 transgenic and B6J (Control) mice using flow cytometry. Representative data are shown in panel ii (P8 and P6 correspond to LSK and Lin−/Sca-1+ fractions, respectively). (C) We determined the percentage of CD150+/CD48− cells in LSK fractions of 2 lines of LSD1 transgenic and B6J mice using flow cytometry. Representative data are shown in panel ii (the boxed area corresponds to CD150+/CD48−/LSK fractions). (D) We determined the cell cycle profile of Lin−/Sca-1+ and Lin− bone marrow mononuclear cells in 2 lines of LSD1 transgenic and B6J (Control) mice in vivo. (E) Bone marrow cells from 2 lines of LSD1 transgenic and B6J (Control) mice (CD45.2) were transplanted into lethally irradiated C57BL/6 (CD45.1) mice. We determined the percentage of CD45.2+ cells in the peripheral blood 24 weeks after transplantation. (F) Bone marrow cells were collected from control- and LSD1-recipient mice 12 weeks after primary transplantation, and transplanted into lethally irradiated C57BL/6 mice. Tertiary transplantation was similarly performed 12 weeks after secondary transplantation. The means ± SD (bars) of 3 independent experiments are shown. *P < .05 and **P < .01 determined by 1-way ANOVA with the Bonferroni post hoc test. (G) Cell cycle status of HSPCs in LSD1 transgenic mice (see “Results” for details).
The shortest isoform of LSD1 enhances the stemness and self-renewal of HSPCs in vivo. (A) Top panel, schematic view of the injected fragment for the generation of LSD1 transgenic mice. Bottom panel, we quantified the expression of human LSD1 and murine GAPDH (internal control) transcripts in 2 lines of LSD1 transgenic and B6J (Control) mice using specific primers (supplemental Table 1). Right panel, genomic DNA (5 µg) was digested with BamHI and hybridized with LSD1 cDNA as a probe to estimate copy numbers of transgene. Lane 1, DNA from wild-type mice + 2 copies of the injection fragment; lane 2, DNA from wild-type mice + 20 copies of the injection fragment; lane 3, DNA from wild-type mice; lane 4, DNA from line 6 mice; lane 5, DNA from line 3 mice. (B) We determined the percentage of LSK and Lin−/Sca-1+ cells in the bone marrow of 2 lines of LSD1 transgenic and B6J (Control) mice using flow cytometry. Representative data are shown in panel ii (P8 and P6 correspond to LSK and Lin−/Sca-1+ fractions, respectively). (C) We determined the percentage of CD150+/CD48− cells in LSK fractions of 2 lines of LSD1 transgenic and B6J mice using flow cytometry. Representative data are shown in panel ii (the boxed area corresponds to CD150+/CD48−/LSK fractions). (D) We determined the cell cycle profile of Lin−/Sca-1+ and Lin− bone marrow mononuclear cells in 2 lines of LSD1 transgenic and B6J (Control) mice in vivo. (E) Bone marrow cells from 2 lines of LSD1 transgenic and B6J (Control) mice (CD45.2) were transplanted into lethally irradiated C57BL/6 (CD45.1) mice. We determined the percentage of CD45.2+ cells in the peripheral blood 24 weeks after transplantation. (F) Bone marrow cells were collected from control- and LSD1-recipient mice 12 weeks after primary transplantation, and transplanted into lethally irradiated C57BL/6 mice. Tertiary transplantation was similarly performed 12 weeks after secondary transplantation. The means ± SD (bars) of 3 independent experiments are shown. *P < .05 and **P < .01 determined by 1-way ANOVA with the Bonferroni post hoc test. (G) Cell cycle status of HSPCs in LSD1 transgenic mice (see “Results” for details).
To investigate whether LSD1 overexpression expands functionally active HSCs in vivo, we conducted stem cell transplantation assays. In line 6 of LSD1 transgenic mice, long-term HSCs were obviously expanded compared with line 3 and control mice 24 weeks after transplantation (Figure 4E). Serial transplantation assays revealed that HSCs from LSD1 transgenic mice but not control mice retained a high repopulating capacity at the third transplantation. Notably, the repopulating activity was significantly stronger in line 6-derived cells than in line 3-derived cells (Figure 4F). Taken together, these results suggest that the shortest isoform of LSD1 regulates stem cell quiescence and activity depending on expression levels (Figure 4G). HSCs in the low-expression line show a quiescent phenotype with long-term repopulating ability, whereas those in the high-expression line have higher self-renewal potential and commitment to differentiation. This is in agreement with the expression pattern and functions of LSD1 isoforms in HSPCs.
The shortest isoform of LSD1 modifies the gene expression program in favor of increasing the self-renewal and T-cell priming of HSPCs
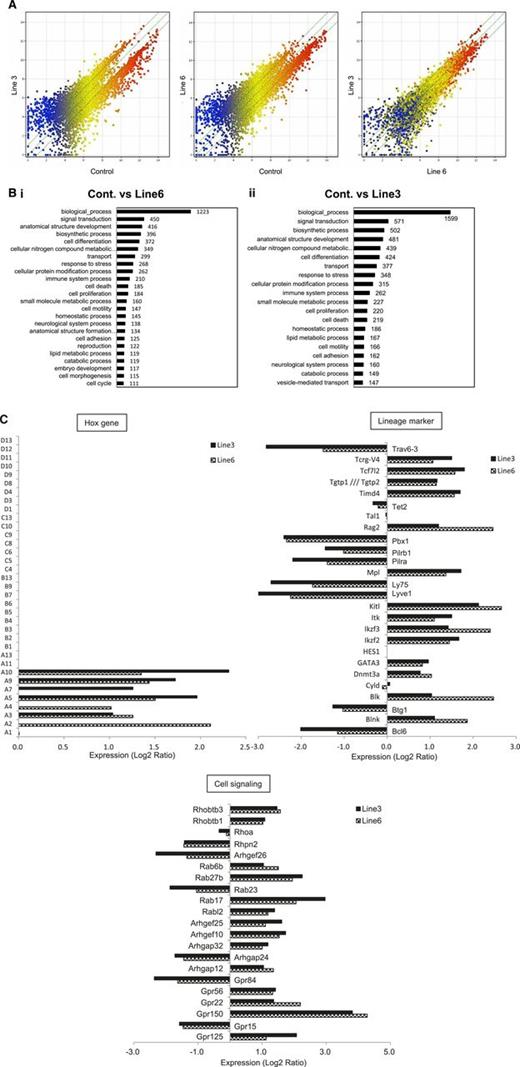
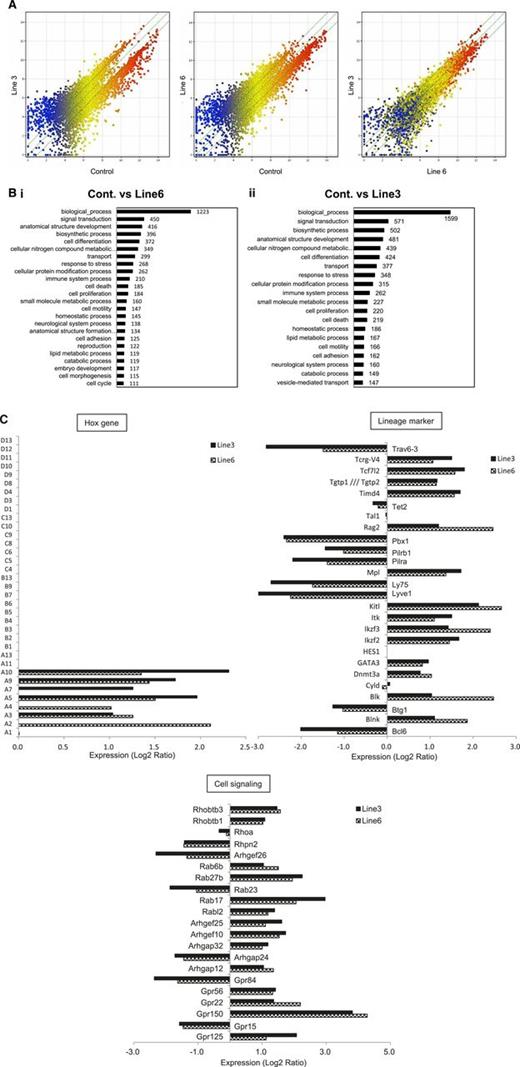
To more clearly understand the molecular basis responsible for the changes in HSC functions of LSD1 transgenic mice, we performed microarray-based gene expression profiling using Lin−/Sca-1+ bone marrow cells. The overall pattern of gene expression indicated that LSD1 upregulated the genes with relatively low levels of expression (blue dots) and downregulated the genes with higher levels of expression (red dots) in both lines with a negligible difference (Figure 5A; supplemental Table 3). Gene ontology analyses revealed the unique pattern of gene regulation affecting various biological processes by LSD1 (Figure 5B). Of these, we focused on the homeobox group, lineage markers, and cell signaling-related genes to estimate stem cell functions. In the homeobox gene cluster, HoxA2-10 were selectively upregulated in LSD1-overexpressing Lin−/Sca-1+ cells, whereas others, including HoxB4, were unaffected relative to control cells (Figure 5C), confirming the results of RT-PCR in vitro (Figure 3B). Among lineage markers, there was a considerable increase in the expression of genes encoding stem cell and T-cell markers, such as c-Kit ligand, c-Mpl, DNMT3A, GATA3, IL-2–inducible T-cell kinase, TCF7, and Rag2. In contrast, B-cell–related genes, including Bcl-6, Btg1, Ly75, and Pbx1, were generally suppressed. These results at least partly explain LSD1-mediated increase in the self-renewal capacity of HSCs and further suggest that LSD1 overexpression may skew the differentiation program of HSPCs into T-cell lineages.
The shortest isoform of LSD1 modifies the gene expression program in favor of increasing the self-renewal and T-cell priming of HSPCs. (A) We performed microarray-based gene expression profiling in Lin−/Sca-1+ bone marrow cells from LSD1 transgenic (line 6 and 3) and control mice. A pairwise comparison of 39 000 genes is shown with signal intensities in both axes. (B) Gene ontology enrichment analysis for genes whose expression was altered more than twofold in line 6 (Bi) and line 3 (Bii) of LSD1 transgenic mice compared with control mice (P < .05 with an FDR threshold of 0.05). (C) Examples of genes whose expression was altered in line 3 and line 6 of LSD1 transgenic mice compared with control mice in 3 categories (Hox family, hematopoietic cell lineage markers, and cell signaling-related). FDR, false discovery rate.
The shortest isoform of LSD1 modifies the gene expression program in favor of increasing the self-renewal and T-cell priming of HSPCs. (A) We performed microarray-based gene expression profiling in Lin−/Sca-1+ bone marrow cells from LSD1 transgenic (line 6 and 3) and control mice. A pairwise comparison of 39 000 genes is shown with signal intensities in both axes. (B) Gene ontology enrichment analysis for genes whose expression was altered more than twofold in line 6 (Bi) and line 3 (Bii) of LSD1 transgenic mice compared with control mice (P < .05 with an FDR threshold of 0.05). (C) Examples of genes whose expression was altered in line 3 and line 6 of LSD1 transgenic mice compared with control mice in 3 categories (Hox family, hematopoietic cell lineage markers, and cell signaling-related). FDR, false discovery rate.
LSD1 transgenic mice show the focal hyperplasia of T lymphocytes, but do not develop lymphoid malignancies for up to 16 months of observation
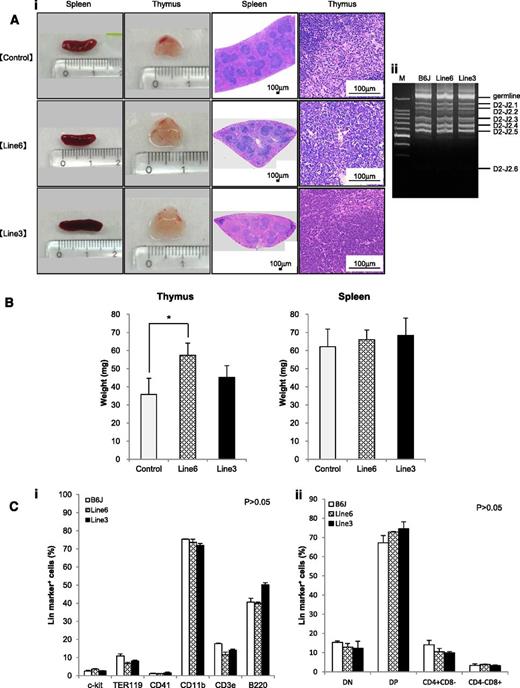
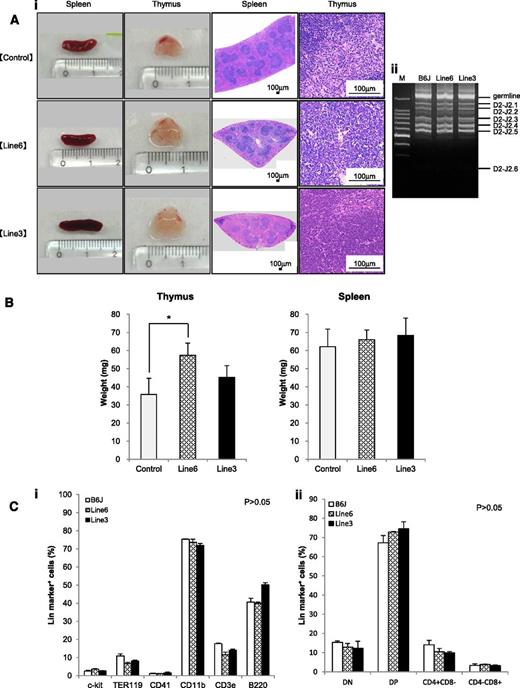
The shortest isoform of LSD1 is overexpressed in T-LBL, and its overexpression renders an increase in the self-renewal potential and T-cell priming of HSPCs. From these findings, it is tempting to speculate that overexpression of the shortest isoform of LSD1 triggers T leukemogenesis. The 2 lines of LSD1 transgenic mice serve as the ideal system to test this hypothesis. Toward this end, we first analyzed the spleen and thymus of 12-week-old LSD1 transgenic mice and found that thymus but not spleen was significantly enlarged in line 6 mice compared with age-matched controls (Figure 6A-B). Histopathological examination revealed no proliferation or invasion of malignant cells in the thymus, spleen, kidney, liver, or bone marrow of LSD1 transgenic mice; however, the thymus of LSD1 transgenic mice, especially line 6, showed the focal hyperplasia of T lymphocytes. The pattern of TCRβ rearrangements of thymocytes was the same between LSD1 transgenic and normal B6J mice, suggesting that the proliferating T lymphocytes of LSD1 transgenic mice are nonmalignant (Figure 6Aii). A periodic examination of peripheral blood showed a tendency of leukocytosis in 7- to 10-month-old LSD1 transgenic mice, but there was no statistically significant difference (supplemental Figure 2). In addition, no increase in specific lineage cells was noted in the peripheral blood (data not shown), bone marrow, or thymus (Figure 6C). Overall, LSD1 transgenic mice had the focal hyperplasia of normal T lymphocytes in the thymus, but did not develop hematological abnormalities, including lymphoid malignancies, for up to 16 months of observation (Figure 7A broken line).
LSD1 transgenic mice show the focal hyperplasia of lymphocytes but do not develop lymphoid malignancies for up to 12 months of observation. (Ai) Representative photographs of the spleen and thymus from 2 lines of LSD1 transgenic and age-matched (10-18 weeks) control mice and their histologic sections. (Aii) Genomic DNA was extracted from thymocytes of LSD1 transgenic and B6J control mice, and subjected to PCR analysis for TCRβ rearrangement. M, molecular size marker. (B) The actual weights of thymus and spleen from 12-week-old mice. The means ± SD (bars) of 5 independent samples are shown (*P < .05). (C) Bone marrow mononuclear cells (i) and thymic cells (ii) were subjected to flow cytometric analysis for the expression of the indicated lineage markers. The means ± SD (bars) of 3 independent experiments performed between 10 and 12 months of age. P values were determined by 1-way ANOVA with the Bonferroni post hoc test.
LSD1 transgenic mice show the focal hyperplasia of lymphocytes but do not develop lymphoid malignancies for up to 12 months of observation. (Ai) Representative photographs of the spleen and thymus from 2 lines of LSD1 transgenic and age-matched (10-18 weeks) control mice and their histologic sections. (Aii) Genomic DNA was extracted from thymocytes of LSD1 transgenic and B6J control mice, and subjected to PCR analysis for TCRβ rearrangement. M, molecular size marker. (B) The actual weights of thymus and spleen from 12-week-old mice. The means ± SD (bars) of 5 independent samples are shown (*P < .05). (C) Bone marrow mononuclear cells (i) and thymic cells (ii) were subjected to flow cytometric analysis for the expression of the indicated lineage markers. The means ± SD (bars) of 3 independent experiments performed between 10 and 12 months of age. P values were determined by 1-way ANOVA with the Bonferroni post hoc test.
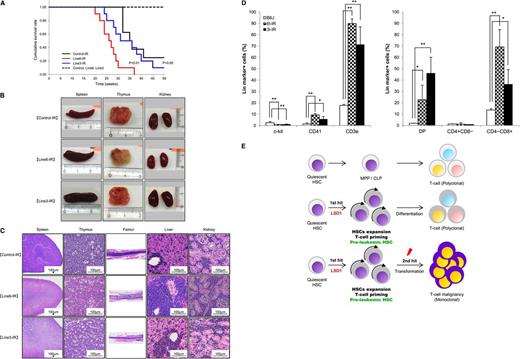
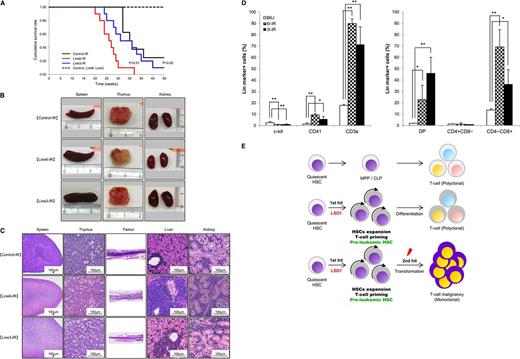
LSD1 overexpression in quiescent HSCs accelerates γ-irradiation-induced development of T-LBL. (A) Kaplan-Meier survival curves of line 6 (n = 10) and line 3 (n = 8) of LSD1 transgenic and B6J control mice (n = 8) with (solid lines) or without (broken lines) γ-irradiation. P values were determined by the log-rank test. (B) Representative photographs of the spleen, thymus, and kidney dissected from LSD1 transgenic (lines 6 and 3) and control mice. (C) Representative photographs of histopathologic sections of the indicated organs. The diagnosis of T-LBL was made by outside experts of animal pathology. (D) Surface marker expression of bone marrow cells from LSD1 transgenic and control mice. *P < .05 and **P < .01 determined by a 1-way ANOVA with the Bonferroni post hoc test (n = 3). (E) Graphical abstract: LSD1 overexpression generates preleukemic HSCs with T-lineage priming, which are transformed to T-cell malignancy by second hits such as γ-irradiation.
LSD1 overexpression in quiescent HSCs accelerates γ-irradiation-induced development of T-LBL. (A) Kaplan-Meier survival curves of line 6 (n = 10) and line 3 (n = 8) of LSD1 transgenic and B6J control mice (n = 8) with (solid lines) or without (broken lines) γ-irradiation. P values were determined by the log-rank test. (B) Representative photographs of the spleen, thymus, and kidney dissected from LSD1 transgenic (lines 6 and 3) and control mice. (C) Representative photographs of histopathologic sections of the indicated organs. The diagnosis of T-LBL was made by outside experts of animal pathology. (D) Surface marker expression of bone marrow cells from LSD1 transgenic and control mice. *P < .05 and **P < .01 determined by a 1-way ANOVA with the Bonferroni post hoc test (n = 3). (E) Graphical abstract: LSD1 overexpression generates preleukemic HSCs with T-lineage priming, which are transformed to T-cell malignancy by second hits such as γ-irradiation.
LSD1 overexpression in quiescent HSCs accelerates γ-irradiation–induced development of T-cell lymphoblastic leukemia/lymphoma
Recent investigations indicate that some epigenetic regulators act at the initial step of myeloid leukemogenesis to form preleukemic HSCs.4-6 We assumed that HSCs of LSD1 transgenic mice were also preleukemic because they exhibited an increased self-renewal potential but retained the ability of normal differentiation. It is therefore likely that LSD1 transgenic mice develop hematological malignancies, especially T-cell leukemias, when they are exposed to additional genotoxic insults. To substantiate this hypothesis, we irradiated 4-week-old LSD1 transgenic and control mice with a dose of 1.7 Gy per week 4 times, followed by regular blood cell counting and close inspections. As anticipated, line 6 mice, which overexpress LSD1 in quiescent HSCs, developed T-LBL earlier and with higher frequency than control and line 3 mice, which express LSD1 in activated HSCs and more differentiated progenitors, after γ-irradiation (Figure 7A). The mean overall survival periods were 26, 31, and 35 weeks for irradiated line 6, line 3, and control mice, respectively (P < .01 between line 6 and either line 3 or control). Malignant cells were detected in the thymus, spleen, bone marrow, liver, and kidney at autopsy (Figure 7B-C). From a pathological standpoint, malignant cells seemed to be originated in the thymus or bone marrow, and then invaded into other organs (Figure 7C). Immunophenotypic analyses revealed a striking increase in the number of CD3+ T lymphocytes especially CD4/CD8 double-positive and CD8 single-positive cells in the bone marrow (Figure 7D). Moreover, preliminary studies detected Notch1 mutations, a hallmark of T-LBL, in thymic tumors of LSD1 transgenic mice (supplemental Table 4). These findings are fully consistent with the pathological diagnosis of T-LBL. Taken together, the shortest isoform of LSD1 drives quiescent HSCs to preleukemic HSCs with an increased self-renewal potential and T-cell priming, which are subject to a second hit such as γ-irradiation to develop T-LBL (Figure 7E).
Discussion
Recent studies indicate that certain epigenetic abnormalities, such as recurrent mutations of DNMT3A and IDH1/2, generate preleukemic HSCs, which progress to full-blown leukemias by additional oncogenic stimuli.4-6 In the present study, we demonstrate that another epigenetic modifier, LSD1, acts in a similar manner to generate preleukemic stem cells for the development of T-cell malignancies. To the best of our knowledge, this is the first demonstration of a founder abnormality specific for T-cell leukemogenesis; however, it is possible that LSD1 overexpression predisposes to other types of malignancies depending on second hits, given the fact that T-LBL is the most common tumor induced by γ-irradiation in B6 mice.31,32 To test this possibility, we are currently cross-breeding LSD1 transgenic mice with other cancer-prone mice such as p53-deficient mice, Lck-NotchIC9 transgenic mice33 and BCR-ABL transgenic mice.34
We found that LSD1 increases self-renewal potential by upregulating the expression of HoxA family members such as A9, A7, A10, and A5 (supplemental Figure 3 and “Discussion”). This is fully compatible with the involvement of the HoxA family in stem cell expansion and leukemogenesis.35-38 Using RNA interference-based functional screening, Cellot et al39 identified the H3K4 demethylase JARID1B as a negative regulator of HSC functions among the Jumonji domain-containing family of histone demethylases. The shRNA-mediated knockdown of JARID1B leads to the in vitro expansion of HSCs, which is accompanied by the upregulation of HoxA7, HoxA9, and HoxA10, with preserved long-term reconstitution potential. They speculated that PHF8/JHDM1F, an H3K9 demethylase of the Jumonji family, regulates HSC functions in collaboration with JARID1B, but did not provide direct evidence. Our present finding suggests that the LSD isoform (−/−) is implicated in this process as another H3K9 demethylase and a modulator of the abundance of JARID1B and PHF8/JHDM1F in favor of HoxA transactivation, thereby providing a clearer picture of stemness regulation within a complex network of histone modifications.40
The mechanisms by which LSD1 (−/−) acts primarily as H3K9 demethylase in vivo is a subject of future investigations. The discrepancy between the results of biochemical studies in vitro and in vivo strongly suggests the presence of cofactors regulating the substrate specification by LSD1 isoforms. We speculate that some cells, including HSCs, possess a unique factor that facilitates the tethering of LSD1 (−/−) to H3K9 as CoREST does so to H3K4. It is also possible that inhibitory molecules bind to the exon 2a sequence, thereby reducing the activity of the isoform (+/−). This hypothesis is partly substantiated by a recent report of Laurent et al,41 in which the full-length isoform of LSD1 fails to show demethylating activity against both H3K4 and H3K9 in vitro, but it effectively demethylates H3K9 but not H3K4 in neuronal cells. They identified the SVIL protein as an auxiliary molecule for LSD1 (+/+) to mediate specific H3K9 demethylation and subsequent transactivation of target genes in vivo. We also demonstrated that LSD1 (+/+) acts predominantly as H3K9 demethylase in HEK293 cells, which express the SVIL protein (supplemental Figure 1B).
The oncogenic LSD1 complexes could be novel therapeutic targets. As overexpressed LSD1 impedes the repair of DNA double-strand breaks and may cause genomic instability (supplemental Figure 4), it is anticipated that LSD1 inhibition retards the progression of preleukemic HSCs to full-blown leukemias. Indeed, recent studies showed that small molecular inhibitors for LSD1 induce differentiation and cell death in acute leukemias with MLL-AF9 and PML-RARα fusion proteins,42-44 which overexpress LSD1 more prominently than other AMLs. Our present finding is not only confirmatory of these observations, but also provides an insight into novel strategies for the early detection at preleukemic stages, prevention of disease progression, and eradication of drug-tolerant persisters using LSD1 inhibitors in hematologic malignancies.
The microarray data reported in this article have been deposited in the MIAME-compliant Gene Expression Omnibus database (accession number GSE66074).
The online version of this article contains a data supplement.
The publication costs of this article were defrayed in part by page charge payment. Therefore, and solely to indicate this fact, this article is hereby marked “advertisement” in accordance with 18 USC section 1734.
Acknowledgments
The authors thank Dr Elanine Dzierzak (Erasmus University Rotterdam in Holland) for providing them with the Ly6A/Sca-1 transgenic cassette.
This work was supported in part by a Grant-in-Aid for Scientific Research on Innovative Area “Cell fate control”, Scientific Research (B) and (C), and grants from the Asteras Foundation for Research on Metabolic Disorders, the Japan Leukemia Research Fund, and the Takeda Science Foundation (T.W., Y.F.).
T.W. received a postdoctoral fellowship and the Young Scientist Award from Jichi Medical University.
Authorship
Contribution: T.W. designed and performed experiments, analyzed data, and drafted the manuscript; D.K., J.K., and H.H. provided materials and critically reviewed the manuscript; T.W. and H.H. generated transgenic mice; and Y.F. designed and supervised research and compiled the manuscript.
Conflict-of-interest disclosure: The authors declare no competing financial interests.
Correspondence: Yusuke Furukawa, Division of Stem Cell Regulation, Center for Molecular Medicine, Jichi Medical School, 3311-1 Yakushiji, Shimotsuke, Tochigi 329-0498, Japan; e-mail: furuyu@jichi.ac.jp.

