Key Points
Human splenic TFH expansion during ITP participates in B-cell differentiation and antiplatelet-antibody production.
IL-21 and CD40 are key TFH molecules that could be promising targets in the treatment of ITP.
Abstract
Antiplatelet-antibody-producing B cells play a key role in immune thrombocytopenia (ITP) pathogenesis; however, little is known about T-cell dysregulations that support B-cell differentiation. During the past decade, T follicular helper cells (TFHs) have been characterized as the main T-cell subset within secondary lymphoid organs that promotes B-cell differentiation leading to antibody class-switch recombination and secretion. Herein, we characterized TFHs within the spleen of 8 controls and 13 ITP patients. We show that human splenic TFHs are the main producers of interleukin (IL)-21, express CD40 ligand (CD154), and are located within the germinal center of secondary follicles. Compared with controls, splenic TFH frequency is higher in ITP patients and correlates with germinal center and plasma cell percentages that are also increased. In vitro, IL-21 stimulation combined with an anti-CD40 agonist antibody led to the differentiation of splenic B cells into plasma cells and to the secretion of antiplatelet antibodies in ITP patients. Overall, these results point out the involvement of TFH in ITP pathophysiology and the potential interest of IL-21 and CD40 as therapeutic targets in ITP.
Introduction
T follicular helper cells (TFHs) have been characterized as the main CD4+ T-cell subset that stimulates antibody production by antigen-specific B cells within secondary lymphoid organs.1 Therefore, they may play a key role in autoimmune diseases (AIDs), particularly the ones supported by an aberrant humoral response such as immune thrombocytopenia (ITP). TFH implication during autoimmunity was first demonstrated in murine models, particularly the sanroque mice, which display a lupus-like phenotype associating glomerulonephritis, lymphadenopathies, anti-DNA antibodies, anemia, and ITP.2 Their secondary lymphoid organs show spontaneous germinal center (GC) formation and plasma cell (PC) accumulation because of TFH expansion.2,3 Indeed, the adoptive transfer of splenic TFHs into the wild-type strain induces similar changes and triggers the disease. Conversely, the inactivation of an adaptor protein involved in T-cell receptor signaling, signaling lymphocytic activation molecule–associated protein (SAP), decreases TFH, thus abrogating spontaneous GC formation and autoimmune manifestations.3 Although these data strongly argue for the participation of TFHs to the stimulation of autoreactive B cells, TFHs have not been studied in secondary lymphoid organs in humans during AID, mostly because of accessibility issues. However, an increase in CD4+CXCR5+ TFH-like cells has been observed in blood during systemic lupus erythematosus4,5 and primary Sjögren syndrome.4,6 Interestingly, circulating TFH frequency correlates with specific antibody titers, disease activity,4,6 circulating GC B cells,5 and serum interleukin (IL)-21 levels.6 Circulating TFH frequency is also increased during other antibody-mediated AIDs such as myasthenia gravis,7 granulomatosis with polyangeitis,8 and bullous pemphigoid.9
Generated from naïve T cells activated by antigen-presenting dendritic cells, TFHs expressed the transcription factor B-cell lymphoma 6 protein (Bcl6) following the activation of the inducible T-cell costimulatory (ICOS) pathway.10-12 Bcl6 leads to their follicular homing by upregulating chemokine C-X-C motif receptor (CXCR) 5 expression, while downregulating chemokine C-C motif receptor (CCR)7. Thus, TFHs leave T-cell areas13 and enter into the light zone of GC where the ligand of CCR5, chemokine CXC motif ligand (CXCL) 13, is produced by follicular dendritic cells (FDCs).14 TFH attraction into GC is also sustained by the autocrine production of CXCL13.15 CXCR4 expression following TFH interaction with FDCs drives them to the dark zone of GC.14,15 Once activated, TFHs mainly produce IL-21, which maintains their phenotype by inducing Bcl6 expression via an autocrine loop.16 On the contrary, the ligation of the programmed cell death protein-1 (PD-1) to its ligand PD-L1 expressed on B cells downregulates ICOS and reduces IL-21 and IL-4 productions.17 Thus, TFH phenotype is usually defined as CD3+CD4+CXCR5+ICOS+PD-1+CCR7low. The interactions of TFHs with B cells participate in their differentiation into memory and PCs together with immunoglobulin class-switch recombination.10 Thus, both IL-21−/− and CD40−/− mice display an altered GC formation with a low antibody production following antigen stimulation because of a low PC differentiation.18,19 Similarly, treatment of monkeys with an anti-CD40 antagonist antibody also disrupts GC formation.20
ITP is an AID in which the humoral response plays a key role.21 Indeed, platelet destruction mostly relies on the phagocytosis of platelets by splenic macrophages,22 which is facilitated by their opsonization by autoantibodies targeting membrane glycoproteins (GPs) such as GPIIb/IIIa, GPIb/IX, and GPIa/IIa.23,24 Immunoglobulin (Ig)G is the main isotype of antiplatelet antibodies,23 underlining class-switch recombination, a mechanism supported by CD154 (CD40 ligand [CD40L]).19 Hitherto, circumstantial evidence argues for a role for TFH in ITP, like changes of expression within circulating T cells of several microRNAs that target TFH markers such as CXCL13, IL-21, and Bcl6.25 Moreover, plasma CXCL1325 and IL-21 levels,26 which are both produced by TFHs, are higher in active ITP patients compared with controls. Taken together with data from the murine model of AID showing the major role of TFHs during autoimmunity, we hypothesized that aberrant TFHs that recognized platelet antigens could participate in the proliferation and differentiation of autoreactive B cells recruited into GC, thus favoring antiplatelet-antibody production.
As spleen is the primary site of the autoimmune response during ITP, we thought that TFHs, specifically localized in this secondary lymphoid organ, would be of particular interest in the pathogenesis of this AID. To date, TFHs have been characterized in tonsils1 during chronic infections and, more recently, in lymph nodes during HIV.27 Only 2 publications assessed human splenic TFHs. In the first report, TFHs were hardly found within the spleens of 2 organ donors when compared with the percentage observed in tonsils, probably because of the absence of a sustained antigen stimulation.28 In the second report, TFHs were quantified in the spleens of 6 ITP patients and 6 controls by assessing PD-1 expression by immunochemistry.29 PD-1–positive cells tended to be less frequent in ITP patients compared with controls. However, concomitant measurement of additional differentiation markers is usually required to identify TFHs because PD-1 is also expressed by activated non-TFH CD4+ T cells30 and by regulatory T follicular cells (TFRegs) that are decreased in the spleen of ITP patients.29
Taking advantage of splenectomy as part of the treatment of ITP, we quantified and localized TFHs within the spleen during a B-cell–mediated AID. Given the importance of TFHs in promoting B-cell differentiation, we assessed whether TFHs could participate in the increase in secondary follicles and GC usually observed in the spleen of ITP patients.31-33 Finally, we investigated the role of CD154 and IL-21 expressed by TFHs in the stimulation of autoreactive B cells producing antiplatelet antibodies that are usually abundantly found in the spleen during ITP.34,35
Methods
Patients
ITP patients, admitted to the university hospital of Dijon, France, were enrolled in the study after giving written informed consent in accordance with the Declaration of Helsinki. The study was approved by the institutional review board and the hospital ethics committee. Primary ITP patients were included (ie, with a platelet count <100 × 109/L and exclusion of familial, viral, drug-induced thrombocytopenia and other AID-related thrombocytopenia). Treatments were initiated when platelet count was <30 × 109/L and/or bleeding symptoms were observed, as recommended.36,37 Most of the patients were treated with short-course steroids and, if necessary, intravenous immunoglobulin (IVIg) as first-line therapies, followed by dapsone. Splenectomy was used as a second-line therapy 1 year after the disease onset, except for a few patients for whom bleeding symptoms were unresponsive to first-line therapies. The spleens of 13 ITP patients were compared with 8 posttraumatic spleens. Patients’ characteristics are reported in Table 1. No difference was found regarding age and gender ratio between controls and ITP patients. Peripheral blood mononuclear cells obtained from 10 patients were compared with 5 controls. Tonsils (n = 4) were obtained from children suffering recurrent infections. Tonsillectomies were performed at the University Medical Center of Utrecht. The use of tonsils was approved by the local ethics review committee.
Spleen preparation
Splenocytes were obtained as previously described32 and stored in liquid nitrogen until needed. Cells were rapidly thawed and washed before use.
Flow cytometry (FCM)
The following antibodies were used for staining: CD3 alexafluor700, CD4 allophycocyanin (APC)–H7, CD27 phycoerythrin (PE), CD84 PE, CD154 pacific-blue, CXCR5 peridinin chlorophyll protein complex–cyanin (Cy)5.5, CCR7 PE-Cy7 (Biolegend), ICOS APC, PD-1 fluorescein isothiocyanate, CD19 eFluor450, CD38 PE-Cy7 or APC (eBioscience), CD45RO PE-Cy7, CD69 PE, IgD fluorescein isothiocyanate, CXCR4 PE, IL-21 PE, and Bcl6 PE (BD Biosciences). To measure CD154 expression, cells were cultured in RPMI medium supplemented with 10% fetal calf serum and stimulated for 5 hours with phorbol-12-myristate-23-acetate (100 ng/mL) and ionomycin (1 µg/mL). To assess IL-21 production, cells were stimulated similarly in presence of brefeldin A (1 µL/mL; BD Biosciences). At least 500 × 103 cells were incubated for 20 minutes with the appropriate antibodies or control isotypes for membrane staining. Intracellular staining was performed after cells were fixed and permeabilized using the Foxp3/Transcription Factor Staining Buffer Set (eBioscience) following the manufacturer’s instructions. Data were acquired on a BD Biosciences LSRII cytometer and analyzed with FlowJo software. MFI refers to the median fluorescence intensity.
Cell separation
Splenocytes or peripheral blood mononuclear cells were incubated with CD4 or CD19 microbeads (Miltenyi) following fabricant’s instructions. Separations were performed with an AutoMACS (Miltenyi) device. Purity assessed by FCM was >97%.
Gene expression quantification
RNA extraction was performed by using the RNeasy RNA-DNA-miRNA Universal Kit (Qiagen) as recommended by the manufacturer. The expression of CXCR5, CXCL13, BCL6, IL-21, and glyceraldehyde-3-phosphate dehydrogenase (GAPDH) messenger RNA (mRNA) was quantified by reverse transcription quantitative polymerase chain reaction (RT-qPCR) by using the following specific primer pairs: CXCR5, forward CTGGAGGACCTGTTCTGGGA and reverse AGGAGGAAGATGAGGCTGTAG; IL-21, forward GCCACATGATTAGAATGCGTC and reverse TTCAGGGACCAAGTCATTCAC; CXCL13, forward GCTCAAGTCTGAACTCTACCTC and reverse TCTCTTGGACACATCTACACCT; Bcl6, forward GCCCTATCCCTGTGAAATCTG and reverse GACGAAAGCATCAACACTCCA; and GAPDH, forward ATGGGGAAGGTGAAGGTCG and reverse GGGGTCATTGATGGCAACAATA. RT-qPCR was performed on a Quantstudio 12K real-time PCR system using the following thermal cycle conditions: 50°C for 2 minutes, 95°C for 10 minutes, 40 cycles at 95°C for 1 second, and 60°C for 30 seconds. Gene expression values were calculated according to the comparative threshold cycle method38 using the stable expressed GAPDH as endogenous control. The value of the lowest expressed sample was set as 1 and used to calculate fold change of target genes.
B-cell differentiation and antibody production
Splenic CD19+ B cells (100 × 103 per well) were cultured in Iscove modified Dulbecco medium supplemented with 10% fetal calf serum in 96-well round bottom plates. Cells were incubated with a combination of human IL-21 (100 ng/mL; Abcam), anti-IgM antibody (5 µg/mL; Jackson Immunoresearch Laboratories), and an anti-CD40 agonist antibody (5 µg/mL; Bioceros). B-cell subsets were determined by FCM at day 6. Total IgG (Human IgG total Ready-SET-go; eBioscience) and anti-GPIIb/IIIa productions (PakAuto; Immucor GTI) were measured in supernatants collected at day 10, following the manufacturers’ instructions.
Immunochemistry
Anti-CD20, anti-CD4 (Dako, Glostrup, Denmark) and anti-PD-1 (Abcam, Cambridge, United Kingdom) antibodies were used. Staining was performed using a BenchMark Ultra instrument (Ventana Medical Systems, Roche Diagnostic). Visualization was based on enzymatic conversion of diaminobenzidine into a brown-colored precipitate by horseradish peroxidase at the site of antigen localization.
Statistics
Excepted when specified, data are given by median (interquartile range). As most of the data did not follow a Gaussian distribution, nonparametric tests were used. Mann-Whitney test or Wilcoxon matched-pairs test were used to compare quantitative data as appropriate. Fisher’s exact test was used to compare qualitative data. Correlation analyses were performed by using Spearman’s rank correlation test. P < .05 was considered significant.
Results
TFHs are identified as CD3+CD4+CXCR5+ICOS+PD-1hi within human spleens
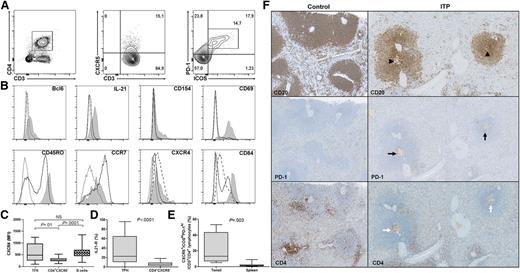
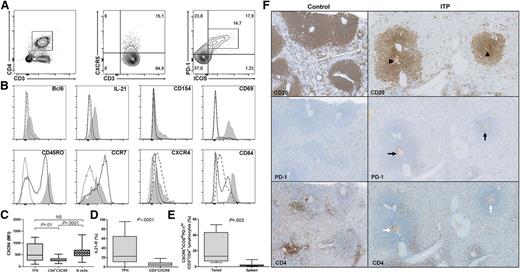
Splenic TFHs were characterized by FCM analyses as CXCR5+ICOS+PD-1hi cells among the CD3+CD4+ T cells (Figure 1A). Their phenotype was first screened for markers known to be expressed by TFHs and was compared with CD3+CD4+CXCR5− T cells (Figure 1B). As expected, CD3+CD4+CXCR5+ICOS+PD-1hi cells expressed Bcl6 and were the main IL-21 producers among splenic CD4+ T cells. CD154 (CD40L), a costimulatory molecule involved in class-switch recombination was preferentially expressed by CD3+CD4+CXCR5+ICOS+PD-1hi following polyclonal stimulation. Splenic CD3+CD4+CXCR5+ICOS+PD-1hi displayed a memory phenotype consistent with a high expression of CD45RO, whereas CD3+CD4+CXCR5− T cells were clearly divided into naïve (CD45RO−) and memory (CD45RO+) populations. CD3+CD4+CXCR5+ICOS+PD-1hi expressed the activation marker CD69 and highly expressed CD84, a homophilic adhesion molecule also detected on B cells. CCR7 was weakly expressed by CD3+CD4+CXCR5+ICOS+PD-1hi, whereas CXCR4 was expressed at a similar level as splenic B cells (MFI: 484 [255-964]) vs 573 [437-690], P = .3), but not by CD4+CXCR5− T cells (273 [226-330]; Figure 1C). IL-21R expression differed from one patient to another, with a median expression of 22.5% (10.8-64) by CD3+CD4+CXCR5+ICOS+PD-1hi (Figure 1D), which was 4 times higher than CD4+CXCR5− T cells (5.8% [2.6-8.4], P < .0001). Taken together, these results demonstrate that splenic CD3+CD4+CXCR5+ICOS+PD-1hi can be considered as TFHs with reference to their phenotype and cytokine production. To our knowledge, human splenic TFHs have been quantified by FCM only in a single study28 and were barely observed compared with what is observed in tonsils. Herein, the percentage of splenic TFHs represented 1.4% (0.5-2.6) of CD4+ T cells, which was 10 times less than the frequency in tonsils (13.3% [7-43], P = .003; Figure 1E), underlining specific features between secondary lymphoid organs.
Splenic TFH phenotype and localization. (A) To determine splenic TFH percentage by FCM, CD3+CD4+ T cells were first gated within lymphocytes and then discriminated for CXCR5 expression. Within CXCR5+ T cells, the percentage of ICOS+PD-1hi cells was measured. (B) The expression of different markers was assessed on CD3+CD4+CXCR5+ICOS+PD-1hi (gray shaded histogram) and compared with CD3+CD4+CXCR5− (full line) and for some markers with B cells (dashed lined). Representative histograms of 1 ITP patient are depicted; the dotted line represents isotype control. Cells were stimulated for 5 hours with phorbol-12-myristate-23-acetate and ionomycin to determine CD154 expression, and in the presence of brefeldin A to measure IL-21 production. (C) CXCR4 expression was compared between CD3+CD4+CXCR5+ICOS+PD-1hi (TFHs), CD4+CXCR5−, and B cells. (D) The expression of IL-21R on TFHs was compared with CD4+CXCR5−. (E) TFH frequency within tonsils (n = 4) was compared with the one in the spleens (6 controls and 13 ITP patients). Data are depicted in box-and-whisker graphs. P value derived by Mann-Whitney test. (F) TFHs were localized by immunohistochemistry. Follicles and GC (arrowheads) were identified within the spleen by using CD20 staining. Then TFHs were identified by the expression of PD-1 (black arrows) and CD4 (white arrows). Representative spleens of 1 control and 1 ITP patient (magnification ×200).
Splenic TFH phenotype and localization. (A) To determine splenic TFH percentage by FCM, CD3+CD4+ T cells were first gated within lymphocytes and then discriminated for CXCR5 expression. Within CXCR5+ T cells, the percentage of ICOS+PD-1hi cells was measured. (B) The expression of different markers was assessed on CD3+CD4+CXCR5+ICOS+PD-1hi (gray shaded histogram) and compared with CD3+CD4+CXCR5− (full line) and for some markers with B cells (dashed lined). Representative histograms of 1 ITP patient are depicted; the dotted line represents isotype control. Cells were stimulated for 5 hours with phorbol-12-myristate-23-acetate and ionomycin to determine CD154 expression, and in the presence of brefeldin A to measure IL-21 production. (C) CXCR4 expression was compared between CD3+CD4+CXCR5+ICOS+PD-1hi (TFHs), CD4+CXCR5−, and B cells. (D) The expression of IL-21R on TFHs was compared with CD4+CXCR5−. (E) TFH frequency within tonsils (n = 4) was compared with the one in the spleens (6 controls and 13 ITP patients). Data are depicted in box-and-whisker graphs. P value derived by Mann-Whitney test. (F) TFHs were localized by immunohistochemistry. Follicles and GC (arrowheads) were identified within the spleen by using CD20 staining. Then TFHs were identified by the expression of PD-1 (black arrows) and CD4 (white arrows). Representative spleens of 1 control and 1 ITP patient (magnification ×200).
To further localize TFHs within the spleen, immunohistochemistry was performed. Secondary follicles, characterized by their prominent GC, were preferentially observed in ITP patients as shown by CD20 staining (Figure 1F). Consistent with their CCR7lowCXCR4+CXCR5+ phenotype, TFHs were located within GC, as shown by the expression of PD-1 and CD4.
Splenic TFHs are expanded in ITP patients
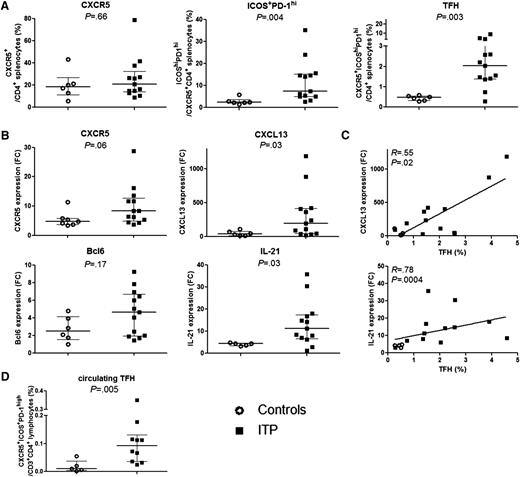
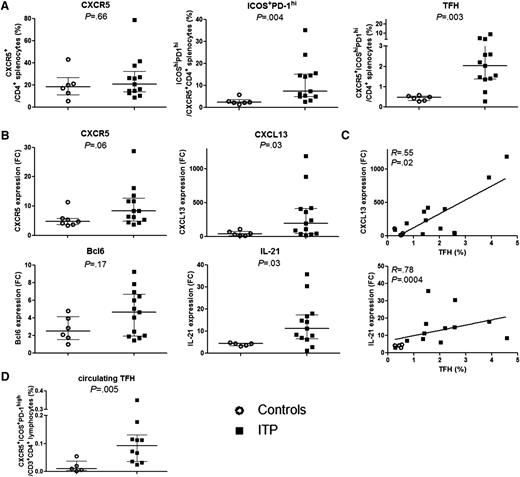
The frequencies of splenic CD4+CXCR5+ cells from controls and ITP patients were similar (18.7 [11.2-26.8] vs 20.8 [13.9-32.5], P = .7) (Figure 2A). However, the frequency of ICOS+PD-1hi among CD4+CXCR5+ cells was markedly higher in ITP patients than controls (7.5 [4.9-15.2] vs 2.4 [1.9-3.6], P = .004), resulting in an increase in TFH percentage (CXCR5+ICOS+PD-1hi) in ITP patients compared with controls (2.04 [1.4-3.2] vs 0.5 [0.3-0.6], P = .003). TFH frequency did not correlate with patient’s age (R = −0.2, P = .4) or treatment specificities (steroids or IVIg) received prior to splenectomy (data not shown). To determine the proportion of TFRegs, Foxp3 expression was measured in the spleen of 4 ITP patients and represents a median of 8.8% (2.3% to 13%) of total TFH (data not shown).
TFH quantification and mRNA expression. (A) The percentage of CXCR5+ among CD3+CD4+, of ICOS+PD-1hi within CD3+CD4+CXCR5+ T cells and the percentage of TFHs defined as CD3+CD4+CXCR5+ICOS+PD-1hi were determined in 6 controls (open circles) and 13 ITP (black squares). Data are summarized in dot plots. (B) CXCR5, CXCL13, BCL6, and IL-21 mRNA expression was quantified by RT-qPCR in total splenic CD4+ T cells of controls (n = 7, open circles) and ITP (n = 12, black squares). Results are expressed as fold change (FC) after normalization on GAPDH expression. Data are summarized in dot plots. The horizontal bar represents the median with interquartile range. P value derived by Mann-Whitney test. (C) The expression of CXCL13 and IL-21 was correlated with TFH percentage measured by FCM. Spearman’s rank correlation coefficient (R) and P value are depicted. Line represents linear regression. (D) Circulating TFH frequency in 5 controls (open circles) and 10 ITP patients (black squares) is summarized in dot plots. The horizontal bar represents the median with interquartile range. P value derived by Mann-Whitney test.
TFH quantification and mRNA expression. (A) The percentage of CXCR5+ among CD3+CD4+, of ICOS+PD-1hi within CD3+CD4+CXCR5+ T cells and the percentage of TFHs defined as CD3+CD4+CXCR5+ICOS+PD-1hi were determined in 6 controls (open circles) and 13 ITP (black squares). Data are summarized in dot plots. (B) CXCR5, CXCL13, BCL6, and IL-21 mRNA expression was quantified by RT-qPCR in total splenic CD4+ T cells of controls (n = 7, open circles) and ITP (n = 12, black squares). Results are expressed as fold change (FC) after normalization on GAPDH expression. Data are summarized in dot plots. The horizontal bar represents the median with interquartile range. P value derived by Mann-Whitney test. (C) The expression of CXCL13 and IL-21 was correlated with TFH percentage measured by FCM. Spearman’s rank correlation coefficient (R) and P value are depicted. Line represents linear regression. (D) Circulating TFH frequency in 5 controls (open circles) and 10 ITP patients (black squares) is summarized in dot plots. The horizontal bar represents the median with interquartile range. P value derived by Mann-Whitney test.
To confirm the results obtained by FCM, CXCR5 mRNA expression was quantified in total splenic CD4+ T cells (Figure 2B) and tended to be higher in ITP patients compared with controls without reaching the level of significance (8.4 [4.7-13.2] vs 4.7 [3.8-5.8], P = .07). In parallel, the expression of CXCL13 and IL-21 mRNA, which are both known to be produced by TFHs, was significantly increased in ITP patients as compared with controls (Figure 2B; 214 [57.3-418.2] vs 34.9 [13.1-78.8], P = .02 and 12.8 [7.3-17.7] vs 4.4 [3.4-4.6], P = .009, respectively) and correlated with TFH percentage measured by FCM (Figure 2C; R = 0.55, P = .02 and R = 0.78, P = .0004, respectively). The expression of TFH master transcription factor BCL6 did not consistently differ between groups but showed a trend toward upregulation in ITP patients (Figure 2B). Indeed, it has been shown that BCL6 mRNA quantification did not account for Bcl6 protein expression and function, as Bcl6 expression is highly regulated by translational and posttranslational mechanisms such as Bcl6 protein acetylation and phosphorylation, or its degradation.39
Circulating TFH and B-cell subset frequencies were determined in 10 ITP patients. Data were compared with 5 healthy donors. Although circulating TFHs represented only a small percentage of CD4+ T cells, their frequency was significantly higher in ITP patients compared with controls (0.1 [0.04-0.13], vs 0.01 [0.004-0.04], P = .005; Figure 2D). Neither difference between B-cell subsets in ITP patients compared with controls, nor any correlation between circulating TFH and B-cell subset percentages was observed (data not shown).
Splenic CD38+ B-cell subsets are increased in ITP patients and correlate with TFH percentage
To investigate the effect of splenic TFH expansion on B-cell differentiation, we analyzed splenic B-cell subsets. B cells were identified as CD19+ cells, then subsets were defined according to CD38 and IgD expression (Figure 3A). PreGC B-cell (CD38+IgD+), GC B-cell (CD38+IgD−), and PC (CD38hiIgD−) frequencies were higher in ITP patients compared with controls (14.3 [12.3-24] vs 5.7 [3.8-10.6], P = .002; 11.6 [9.9-13.3] vs 4.8 [3-6.2], P = .004 and 2.2 [1.6-2.8] vs 0.7 [0.4-1.3], P = .003, respectively; Figure 3B). Except for memory B-cell frequency (R = 0.6, P = .01), no correlation was observed between B-cell subset frequency and patient’s age (data not shown). IL-21R was differentially expressed by B-cell subsets, with the highest expression on PCs (Figure 3C). As TFHs participate in B-cell differentiation, TFH and B-cell subset frequencies were compared. Interestingly, TFH percentage positively correlated with GC B-cell (R = 0.7, P = .003), preGC B-cell (R = 0.8, P = .0002), and PC frequencies (R = 0.7, P = .003; Figure 3D).
Splenic B-cell subset phenotype and quantification. (A) B-cell subsets (naïve, memory, GC, pregerminal center [preGC], and PCs) were determined among CD19+ splenocytes by the expression of CD38 and IgD. Representative quantile contour plot of 1 ITP patient. (B) B-cell subset percentages were compared between 6 controls (open circles) and 11 ITP patients (black squares). Results are summarized in dot plots. The horizontal bar represents the median with interquartile range. P value derived by Mann-Whitney test. (C) The expression of IL-21R was assessed on B-cell subsets. IL-21R MFI measured in 6 controls and 11 ITP patients is depicted in dot plots. The horizontal bar represents the median with interquartile range. P value derived by Mann-Whitney test. *P < .05; ***P < .001. (D) TFH percentages correlate with the percentages of GC B cells, preGC B cells, and PCs. The graphs represent the results obtained in 6 controls (open circles) and 11 ITP patients (black squares). Spearman’s rank correlation coefficient (R) and P value are depicted. Line represents linear regression.
Splenic B-cell subset phenotype and quantification. (A) B-cell subsets (naïve, memory, GC, pregerminal center [preGC], and PCs) were determined among CD19+ splenocytes by the expression of CD38 and IgD. Representative quantile contour plot of 1 ITP patient. (B) B-cell subset percentages were compared between 6 controls (open circles) and 11 ITP patients (black squares). Results are summarized in dot plots. The horizontal bar represents the median with interquartile range. P value derived by Mann-Whitney test. (C) The expression of IL-21R was assessed on B-cell subsets. IL-21R MFI measured in 6 controls and 11 ITP patients is depicted in dot plots. The horizontal bar represents the median with interquartile range. P value derived by Mann-Whitney test. *P < .05; ***P < .001. (D) TFH percentages correlate with the percentages of GC B cells, preGC B cells, and PCs. The graphs represent the results obtained in 6 controls (open circles) and 11 ITP patients (black squares). Spearman’s rank correlation coefficient (R) and P value are depicted. Line represents linear regression.
In vitro IL-21 and CD40 stimulations promote splenic B-cell differentiation into GC B cells and PCs, leading to antiplatelet-antibody secretion
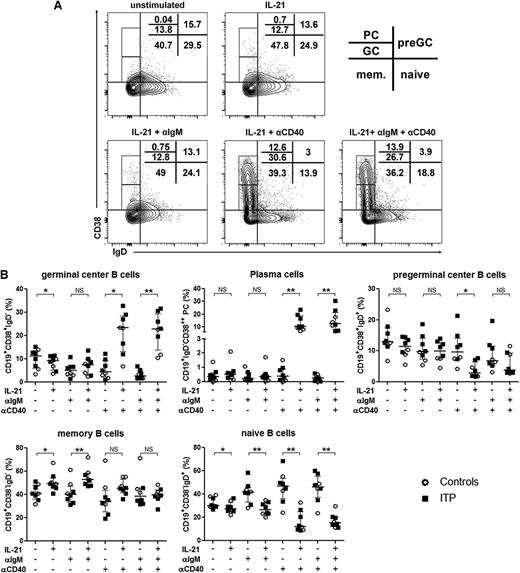
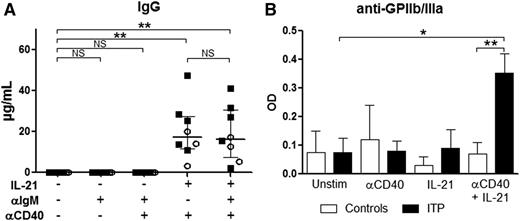
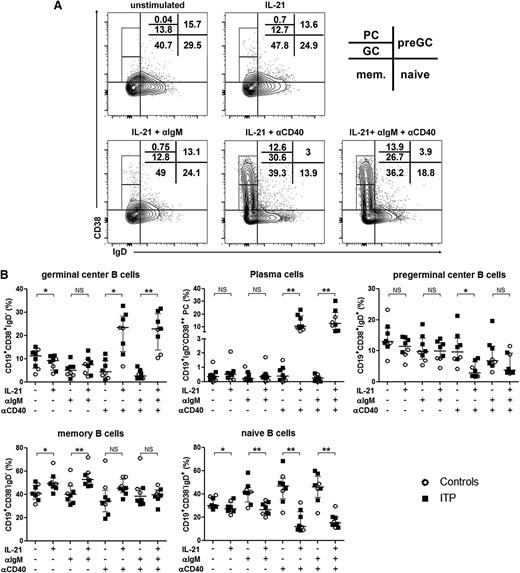
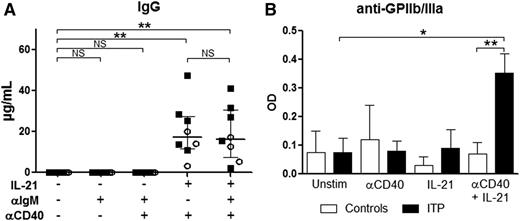
To investigate which mechanisms were involved in the increase in preGC and GC B cells and PCs in the spleen of ITP patients and to address the potential implication of TFHs in B-cell differentiation, the signals encountered by B cells in vivo were reproduced in vitro. Sorted CD19+ splenic B cells were stimulated with an anti-IgM antibody to mimic B-cell receptor (BCR) ligation and with an anti-CD40 agonist antibody to reproduce the effect of CD154 expressed by TFHs. B cells were cultured with the combination of these antibodies with or without IL-21, the main cytokine produced by TFHs. The combination of IL-21 and CD40 ligation promoted GC B-cell and PC differentiation both in ITP patients (Figure 4A) and controls (data not shown) in a similar manner. In the presence of anti-CD40 antibody, IL-21 led to an increase in GC B-cell frequency from 4.4% (2.2-9.1) to 23.4% (13.1-28.5) (P = .02; Figure 4B). BCR ligation did not add much to the combined effect of IL-21 and CD40 stimulation. For PC differentiation, the addition of IL-21 to CD40 ligation increased their frequency from 0.3% (0.01-0.9) to 10.2% (7.3-17.9) (P = .004). Again, BCR ligation had only a minor effect. Naïve B cells were the most prone to differentiate into GC B cells and PCs, as represented by their significant decrease when IL-21 was added to the culture. The most important decrease in naïve B cells was observed upon CD40 stimulation with and without BCR stimulation (from 46.2% [37.2-55.5] to 15.2% [11.9-20.3], P = .008 and from 46.8% [36-53.7] to 12.3% [9.4-25], P = .008, respectively). A significant increase in memory B-cell frequency was observed when IL-21 was added to B cells stimulated or not with anti-IgM (from 40.1% [33.7-47.2] to 52.7% [47.9-58.3], P = .008 and from 40.8% [36.2-48.2] to 49.4% [45.9-54.4], P = .02, respectively), but not anymore when anti-CD40 was added (38.55% [32.7-45.5] vs 39.6% [37-44], P = .9 and 34% [25.1-43.9] vs 45.4% [41.6-53.3], P = .08, respectively), probably because the differentiation into PCs was favored in this condition. Both in controls and ITP patients, IgGs were only detected in culture supernatants when PC differentiation was obtained (ie, in presence of IL-21 with CD40 ligation) (Figure 5A). Interestingly, anti-GPIIb/IIIa antibodies were only detected in ITP patients when splenic B cells were concomitantly stimulated with IL-21 and anti-CD40 (Figure 5B).
Role of IL-21 and CD40 ligation in splenic B-cell differentiation and total IgG production. Sorted splenic CD19+ B cells were stimulated with a combination of anti-IgM antibody (αIgM), anti-CD40 agonist antibody (αCD40), and IL-21. At day 6, cells were stained for the determination of B-cell subsets using CD38 and IgD expression. (A) Quantile contour plots of 1 representative ITP patient are depicted with the percentages of PCs and GC, preGC, memory (mem.), and naive B cells. (B) The effect of each stimulation alone or in combination on B-cell subsets is summarized in dot plots. Results obtained from 3 controls (open circles) and 5 ITP patients (black squares). P value derived by Wilcoxon matched-pairs test. The horizontal bar represents the median with interquartile range. P value derived by Wilcoxon matched-pairs test. NS, nonsignificant; *P < .05; **P < .01.
Role of IL-21 and CD40 ligation in splenic B-cell differentiation and total IgG production. Sorted splenic CD19+ B cells were stimulated with a combination of anti-IgM antibody (αIgM), anti-CD40 agonist antibody (αCD40), and IL-21. At day 6, cells were stained for the determination of B-cell subsets using CD38 and IgD expression. (A) Quantile contour plots of 1 representative ITP patient are depicted with the percentages of PCs and GC, preGC, memory (mem.), and naive B cells. (B) The effect of each stimulation alone or in combination on B-cell subsets is summarized in dot plots. Results obtained from 3 controls (open circles) and 5 ITP patients (black squares). P value derived by Wilcoxon matched-pairs test. The horizontal bar represents the median with interquartile range. P value derived by Wilcoxon matched-pairs test. NS, nonsignificant; *P < .05; **P < .01.
Role of IL-21 and CD40 ligation in IgG and antiplatelet-antibody production by splenic B cells. Sorted splenic CD19+ B cells were stimulated with a combination of anti-IgM antibody (αIgM), anti-CD40 agonist antibody (αCD40), and IL-21. At day 10, supernatants were collected to measure total IgG and anti-GPIIb/IIIa autoantibody secretion. (A) IgG production measured in 3 controls (open circles) and 5 ITP patients (black squares). P value derived by Wilcoxon matched-pairs test. Data are depicted in dot plots. The horizontal bar represents the median with interquartile range. (B) Anti-GPIIb/IIIa antibody secretion obtained from 2 controls and 5 ITP patients. P value derived by unpaired Student t test. Data are depicted in histograms representing the mean with standard error of the mean. NS, nonsignificant; *P < .05; **P < .01.
Role of IL-21 and CD40 ligation in IgG and antiplatelet-antibody production by splenic B cells. Sorted splenic CD19+ B cells were stimulated with a combination of anti-IgM antibody (αIgM), anti-CD40 agonist antibody (αCD40), and IL-21. At day 10, supernatants were collected to measure total IgG and anti-GPIIb/IIIa autoantibody secretion. (A) IgG production measured in 3 controls (open circles) and 5 ITP patients (black squares). P value derived by Wilcoxon matched-pairs test. Data are depicted in dot plots. The horizontal bar represents the median with interquartile range. (B) Anti-GPIIb/IIIa antibody secretion obtained from 2 controls and 5 ITP patients. P value derived by unpaired Student t test. Data are depicted in histograms representing the mean with standard error of the mean. NS, nonsignificant; *P < .05; **P < .01.
Discussion
During ITP, the spleen is the primary site for the activation of B cells producing antiplatelet antibodies and where most of the activated T cells that recognized antiplatelet antigens are located.35 However, the interactions between T and B cells in the spleen have not been investigated yet. Although the involvement of TFHs in the pathogenesis of AIDs has clearly been demonstrated in murine models,2,3 limited knowledge describes their role in human secondary lymphoid organs, as TFHs have been mainly characterized in blood during AIDs.4-9 Herein, we quantified for the first time splenic TFHs by FCM in accordance with the phenotype currently used in the literature (ie, CD3+CD4+CXCR5+ICOS+PD-1hi).10 Accordingly, splenic TFHs also expressed the transcription factor Bcl6, displayed a central memory phenotype (CD45RO+CCR7−), and were in an activated state (CD69+). TFHs highly expressed CD84, a SAP that facilitates prolonged contact with B cells that also expressed CD84.40 Upon stimulation, TFHs expressed CD154 (CD40L) and were the main producers of IL-21 among splenic CD4+ T cells.
Splenic TFH frequency was increased during ITP, an antibody-mediated AID, corroborating results observed in sanroque mice. This increase correlated with a higher CXCL13 (CXCR5 binding chemokine) expression among CD4+ splenic T cells, a chemokine produce by TFHs, but also by FDCs, that favors the recruitment of CXCR5+ cells (ie, TFHs and B cells).41 In addition, splenic TFHs highly expressed CXCR4, in accordance with their location within the GC of secondary follicles during ITP. Most TFHs were proinflammatory cells, as only a few of them expressed Foxp3+ in accordance with a previous report showing a decrease in splenic TFRegs in ITP.29
We subsequently demonstrated that the described expansion of TFHs could be involved in B-cell differentiation in the spleen of ITP patients, contributing to the development of PCs producing antiplatelet autoantibodies. As a first line of evidence and in agreement with previous reports,32,33 the increased number of TFHs was concomitant to an expansion of GC in ITP patients related to an increase in both GC B cells and PCs. Supporting the role of TFHs in the generation of GC, we demonstrated that TFHs were the major source of IL-21 in ITP spleen, a key cytokine involved in B-cell stimulation and differentiation.42 Interestingly, IL-21 expression in splenic CD4+ T cells correlates with TFH abundance, and the stimulation of B cells with IL-21 in the presence of CD40 engagement induces their differentiation in PCs and the secretion of antiplatelet antibodies. These results are perfectly in line with what has been reported on circulating B cells42 and account for what is observed in vivo in ITP spleens. Taken together with a previous report showing plasma IL-21 increase during ITP,43 our results point out IL-21 produced by TFH as a potential new therapeutic target during ITP. Indeed, the role of IL-21 in the pathogenesis of various AIDs with an abnormal humoral response in humans, such as systemic lupus erythematosus4,5 and rheumatoid arthritis,44 has been demonstrated and has justified the use of anti-IL-21 therapy in clinical trials.45 However, the fact that bone marrow PCs, contrary to secondary lymphoid organ PCs, do not depend on IL-21 to survive,46 argues for a blockade of the IL-21 axis early in the disease, before the establishment of long-lived PCs. Moreover, IL-21 synergistically acts with IL-15 to activate CD8+ T cells and to increase interferon-γ secretion.47 Based on reports showing that cytotoxic T cells participate in platelet destruction48 and that splenic IFN-γ+CD8+ T cells are increased in some ITP patients,49 it can be assumed that IL-21 antagonism could also abrogate their effects. Because T helper 17 cells (Th17) and natural killer T cells also produce IL-21,50 their frequencies were measured, and these cells represented only 0.05% of CD4+ T cells32 and 0.005% of CD3+ T cells, respectively (data not shown). As TFHs were 30 to 300 times more frequent, they may be the major source of IL-21 in the spleen of ITP patients. Importantly, TFHs also expressed CD154 upon activation, and CD40 ligation on splenic B cells participates in their differentiation into PCs and to the production of antiplatelet antibodies in ITP patients. These results support the beneficial effects of the disruption of the CD40/CD154 axis in ITP shown in previous studies. Indeed, treatment with anti-CD154 monoclonal antibody resulted in a decrease in B cells producing antiplatelet antibodies.51 In a phase 1/2 study conducted on 46 chronic ITP patients, a 24% overall response rate was obtained after treatment by 2 humanized anti-CD154 antibodies.52 However, further clinical studies using these antibodies were interrupted because of an increased risk of thromboembolic events, partly because of the activation of platelets that express CD154.53,54 To counteract this effect, therapeutic antibodies that antagonize CD40 have been tested with promising results in animal models20 and in human AIDs such as Crohn's disease55 and could become a therapeutic approach in ITP.
It should be stressed that the changes in TFH and B-cell subset frequencies observed in the spleen of ITP patients might be because of treatments received prior to splenectomy, particularly IVIg. Nevertheless, this hypothesis appears very unlikely as it has recently been shown in a model of collagen-induced arthritis that IVIg therapy leads to a decrease in TFH and B-cell differentiation, whereas TFRegs are increased.56 Of importance, complete response to this question requires the assessment of the spleen from ITP patients who responded to medical therapy, which is impossible as these patients do not undergo splenectomy. Conversely, the increase in TFH associated with B-cell differentiation is more likely to be because of chronic antigen stimulation (ie, platelet GPs during ITP), similarly to what is observed in tonsils during chronic bacterial infection1 or in lymph nodes during HIV infection.27 Thus, our results support a role for TFH in B-cell recruitment and differentiation in the spleen of ITP patients rather than modulations induced by treatment.
Whether the change in splenic TFH frequency directly supports ITP or represents a consequence of the underlying inflammatory process is a matter of debate. However, our data showed IL-21 and CD154 as key factors of B-cell differentiation and antiplatelet-antibody production. Even though the effect of TFHs on B cells was not directly assessed in a coculture system, CD154 is expressed by TFHs, and these cells are the main producers of IL-21 within the spleen. Moreover, animal models like the sanroque model clearly argue for the direct involvement of TFHs in autoimmunity as their adoptive transfer into wild-type mouse leads to aberrant GC formation and triggers autoimmune manifestations that are abrogated when T-cell receptor signaling is disrupted.3
During recent years, evidence for a role of TFHs during AIDS in humans has been increasing. We here report for the first time in ITP an increase in splenic TFHs. Although a role of the inflammatory environment in the increase in TFH frequency could not be completely excluded, our data strongly suggest that TFHs participate in B-cell differentiation and antiplatelet-antibody production through IL-21 secretion and by the interaction of CD154 with CD40. Thereby, IL-21 and CD40 could be promising therapeutic targets during ITP and more generally during antibody-mediated AID.
The publication costs of this article were defrayed in part by page charge payment. Therefore, and solely to indicate this fact, this article is hereby marked “advertisement” in accordance with 18 USC section 1734.
Acknowledgments
The study was supported by the clinical research department of the university hospital of Dijon (Direction de la Recherche Clinique, Centre Hospitalier Universitaire de Dijon), the Burgundy regional council (Conseil Régional de Bourgogne, Regional Action Plan for Innovation [PARI]) (S.A. and B.B.), the National Research Agency (Agence Nationale de la Recherche, Labex LipSTIC, ANR-11-LABX-0021), and the Bonus Qualité Recherche, Université de Franche-Comté (BQR UFC) 2012 (P.S.). S.A. was supported by a grant from the Foundation for the Development of Internal Medicine in Europe (FDIME Research Project Grant 2013).
Authorship
Contribution: S.A. and B.B. were the principal investigators; S.A., B.B., and T.R.D.J.R. designed the study; S.A., M.S., S.B., V.L.-S., B.L., and B.B. recruited the patients; S.A., M.R., K.S., A.B., L.B., T.F., E.C., T.v.d.B., L.M., B.B., and T.R.D.J.R. designed the experiments; S.A., M.R., K.S., S.S., C.R., C.B., L.M., M.C., M.T., and N.J. performed the experiments; O.F. and P.O.-D. performed the splenectomies; S.A., M.R., B.B., and T.R.D.J.R. analyzed the results; S.A., B.B., and T.R.D.J.R. coordinated the research; and S.A., N.J., P.S., B.B., and T.R.D.J.R. wrote the manuscript.
Conflict-of-interest disclosure: The authors declare no competing financial interests.
Correspondence: Sylvain Audia, INSERM UMR 1098, Batiment B3, rue Angélique Ducoudray, 21000 Dijon, France; e-mail: sylvain.audia@u-bourgogne.fr.
References
Author notes
B.B. and T.R.D.J.R. contributed equally to this study.

![Figure 3. Splenic B-cell subset phenotype and quantification. (A) B-cell subsets (naïve, memory, GC, pregerminal center [preGC], and PCs) were determined among CD19+ splenocytes by the expression of CD38 and IgD. Representative quantile contour plot of 1 ITP patient. (B) B-cell subset percentages were compared between 6 controls (open circles) and 11 ITP patients (black squares). Results are summarized in dot plots. The horizontal bar represents the median with interquartile range. P value derived by Mann-Whitney test. (C) The expression of IL-21R was assessed on B-cell subsets. IL-21R MFI measured in 6 controls and 11 ITP patients is depicted in dot plots. The horizontal bar represents the median with interquartile range. P value derived by Mann-Whitney test. *P < .05; ***P < .001. (D) TFH percentages correlate with the percentages of GC B cells, preGC B cells, and PCs. The graphs represent the results obtained in 6 controls (open circles) and 11 ITP patients (black squares). Spearman’s rank correlation coefficient (R) and P value are depicted. Line represents linear regression.](https://ash.silverchair-cdn.com/ash/content_public/journal/blood/124/18/10.1182_blood-2014-03-563445/4/m_2858f3.jpeg?Expires=1767719475&Signature=w~-nr3defxfdpjonx8QwxRHkvXuAcO~o~RweRe5uW27hz6eATNY6nHoAoN72UuBsvVdQVz-HI5g2tjprQ48M3tnixgdJz7B2TZCN3NGXyvdOMxsl1KkhsjkTgNf9xBvXN7ozwj~RIzAiOW6fRIL52O83pjWLZ9SaU-pO4qhJ7b24sZ8U5JJ0NCbkTS0-r4NP-H~HF7Bazy-46x0e7dnBWQnuI39OSTS610IwmNbVNCx0Fkokj2hu4LTi5QW2QSsleSnMNs0x2XrmxEnlcMWZ2LKw7pCfleS1VBzwr7Je~QsikGIdJcGupTV5QdCm3v4LHtv2uWW7LPG0v71uTS~HAg__&Key-Pair-Id=APKAIE5G5CRDK6RD3PGA)

![Figure 3. Splenic B-cell subset phenotype and quantification. (A) B-cell subsets (naïve, memory, GC, pregerminal center [preGC], and PCs) were determined among CD19+ splenocytes by the expression of CD38 and IgD. Representative quantile contour plot of 1 ITP patient. (B) B-cell subset percentages were compared between 6 controls (open circles) and 11 ITP patients (black squares). Results are summarized in dot plots. The horizontal bar represents the median with interquartile range. P value derived by Mann-Whitney test. (C) The expression of IL-21R was assessed on B-cell subsets. IL-21R MFI measured in 6 controls and 11 ITP patients is depicted in dot plots. The horizontal bar represents the median with interquartile range. P value derived by Mann-Whitney test. *P < .05; ***P < .001. (D) TFH percentages correlate with the percentages of GC B cells, preGC B cells, and PCs. The graphs represent the results obtained in 6 controls (open circles) and 11 ITP patients (black squares). Spearman’s rank correlation coefficient (R) and P value are depicted. Line represents linear regression.](https://ash.silverchair-cdn.com/ash/content_public/journal/blood/124/18/10.1182_blood-2014-03-563445/4/m_2858f3.jpeg?Expires=1767769279&Signature=Zi7vcd2OhkkeWDamm0Ax2yWj5gXlOqJhL0pb8Rtdk2TWEmLGgUcxaEKOPkLMayfyrGGYgw~YwnfiPKSwimmOumsF~z--d9UoBrkBvjtRe0iwcET32E2V3GW-H2myyh3Aqz0FXubdBokC7D9kYHFyl52BdjiZfhviXc8iwiMMuOumFsGR77HRMExXVbdTT46GZHuo-QFHYwUfzCwvqADPl1VsD2yaN5pmgvbreWZ3pgpP~Z5mr1~Q~nY2flw8yRrIrfkc~5lao0n7UcNaqRG~xq8XumV8x9T9STf3aC038bdFy7QZHOw6qBbYAcLfAeHdmzRe5RPts7na58cPN9ek9w__&Key-Pair-Id=APKAIE5G5CRDK6RD3PGA)
