Key Points
IRF4−/−Vh11 mice develop spontaneous CLL at 100% penetrance, indicating that a low level of IRF4 is critical for CLL development.
IRF4−/−Vh11 mice are a novel mouse model of CLL.
Abstract
Interferon regulatory factor 4 (IRF4) is a critical transcriptional regulator of B-cell development and function. A recent genome-wide single-nucleotide polymorphism (SNP) association study identified IRF4 as a major susceptibility gene in chronic lymphocytic leukemia (CLL). Although the SNPs located in the IRF4 gene were linked to a downregulation of IRF4 in CLL patients, whether a low level of IRF4 is critical for CLL development remains unclear. In rodents, CLL cells are derived from B1 cells whose population is dramatically expanded in immunoglobulin heavy chain Vh11 knock-in mice. We bred a Vh11 knock-in allele into IRF4-deficient mice (IRF4−/−Vh11). Here, we report that IRF4−/−Vh11 mice develop spontaneous early-onset CLL with 100% penetrance. Further analysis shows that IRF4−/−Vh11 CLL cells proliferate predominantly in spleen and express high levels of Mcl-1. IRF4−/−Vh11 CLL cells are resistant to apoptosis but reconstitution of IRF4 expression in the IRF4−/−Vh11 CLL cells inhibits their survival. Thus, our study demonstrates for the first time a causal relationship between low levels of IRF4 and the development of CLL. Moreover, our findings establish IRF4−/−Vh11 mice as a novel mouse model of CLL that not only is valuable for dissecting molecular pathogenesis of CLL but could also be used for therapeutic purposes.
Introduction
Interferon regulatory factor 4 (IRF4) is a transcriptional regulator of immune system development and function.1 In B cells, IRF4 is critical for their early-stage development in the bone marrow as well as their functions in the periphery.2,3 Previous works from our group have shown that IRF4 and its closely related family member IRF8 orchestrate the transition from the large pre–B-cell to the small pre-B cells by regulating cell-cycle exit and by promoting light-chain rearrangement.4-6 In mature B cells, IRF4 is essential for class-switching, germinal center exit, and the differentiation into antibody-secreting plasma cells.7-9 The role of IRF4 in B-cell malignancies appears to be developmental stage specific. We and others have shown that IRF4 acts as a classical tumor suppressor to prevent pre–B-cell transformation.10,11 However, in multiple myeloma, IRF4 behaves as an oncogene to promote the survival of those cells.12
Chronic lymphocytic leukemia (CLL) is the most common adult leukemia in Western countries and is characterized by a monoclonal accumulation of neoplastic CD5+ B cells in blood, bone marrow, and secondary lymphoid tissues.13 Multiple factors have been implicated in the molecular etiology of CLL, including genetic predisposition, autoantigen stimulation, microRNAs (miRNAs), and cytogenetic abnormalities.14 The molecular pathogenesis of CLL has not been fully elucidated, largely because few genetic abnormalities have been conclusively linked to the pathogenesis of CLL. A recent genome-wide single-nucleotide polymorphism (SNP) association study in CLL patients identified IRF4 as a major susceptible gene for CLL.15 Fine-scale mapping analysis identified 4 SNPs mapped to a 3-kb region in the 3′–untranslated region of the IRF4 gene.16 Further analysis of IRF4 expression in Epstein-Barr virus (EBV)–transformed lymphocytes suggests that presence of the SNPs was associated with a downregulation of IRF4.15 Low levels of IRF4 were also found to correlate with poor prognosis in CLL patients.17 Mutations in the DNA-binding domain of the IRF4 gene were identified in human CLL patients.18 It occurs only in 1.5% CLL cases with the majority of the cases also carrying trisomy 12. It remains unclear whether and how these mutations impact the functions of IRF4. Although emerging evidence has linked low levels of IRF4 to the development of CLL, whether low levels of IRF4 are critical for CLL development remains unclear.
Although the cellular origin of human CLL remains unclear, CLL cells are believed to be derived from B1 cells in rodent.19 B1 cells are a small B-cell subset that normally resides in the peritoneal cavity (PC) and the pleural cavity. B1 cells play an important role in host defense against microbial infection and are the major producers of natural antibodies in serum.20 B-cell receptors (BCRs) expressed on B1 cells are polyreactive with a very restricted immunoglobulin heavy chain (IgH) repertoire. The Vh11 family of the IgH gene is one of those unique immunoglobulin genes that are found only in B1 cells where it pairs with light chain to form the BCR that recognizes phosphatidylcholine (PtC) on senescent red blood cells.21 Analysis of Vh11 knock-in mice confirmed that B cells expressing the Vh11 knock-in allele give rise to B1 cells, whose population is expanded dramatically in the Vh11 knock-in mice.22 Here, we report that IRF4-deficient mice expressing the Vh11 knock-in allele (IRF4−/−Vh11) spontaneously developed early-onset CLL at 100% penetrance. Moreover, reconstitution of IRF4 expression in IRF4−/−Vh11 CLL cells inhibited their survival.
Methods
Mice
IRF4-deficient mice (IRF4−/−) and Vh11 knock-in mice have been previously described.22,23 The Rag2 and common γ chain double-deficient mice (Rag2−/−γ−/−) mice were obtained from Taconic. All mice were maintained under specific pathogen-free conditions. Experiments were performed according to guidelines from the National Institutes of Health and with an approved protocol from the Institutional Animal Care and Use Committee of the University of Nebraska Medical Center. Mice aged 8 to 30 weeks were used for this study.
Transplantation of CLL cells
CLL cells were isolated from spleens of IRF4−/−Vh11 mice via negative selection. The isolated CLL cells were injected via retro-orbital sinus into nonirradiated Rag2−/−γ−/−. A total of 106 cells was used for each injection. The CLL cells were monitored weekly through blood analysis.
In vivo BrdU labeling
The in vivo 5-bromo-2′-deoxyuridine (BrdU) labeling assay was performed as described previously.24 Mice were injected intraperitoneally with 6 mg/mL BrdU (Sigma-Aldrich), and 12 hours later the cells were isolated for analysis. Three mice from each group were used for this assay. Cells from blood, lymph node, and spleen were stained with antibodies against CD5, IgM, and CD19. After fixation, the incorporated BrdU was detected with a BrdU flow kit (Pharmingen). The percentages of BrdU-positive cells were detected by fluorescence-activated cell sorter (FACS) analysis.
TUNEL and activated caspase 3 assays
The apoptosis status of CLL cells in mice were examined with the TUNEL (terminal deoxynucleotidyltransferase-mediated dUTP-biotin nick end labeling) assay. The TUNEL assay was conducted as previously described.11 The cells were isolated and stained with surface antibodies (CD5 and IgM). The TUNEL-positive cells were revealed with an APO-direct kit (BD Pharmingen). The activated caspase 3 was also used to detect apoptotic cells. In this case, the assay was carried out with a kit from BD Pharmingen.
Transfection of CLL cells in vitro
CLL cells were isolated from spleens of IRF4−/−Vh11 mice and cultivated on top of the S17 stromal layer in media containing RPMI 1640 with 10% fetal bovine serum. To reconstitute expression of IRF4, IRF4−/−Vh11 CLL cells were mixed with either control vector or IRF4-expressing vector. A total of 10 × 106 CLL cells and 20 µg of plasmid were used for each transfection. The transfection was carried out in a Nucleofector (Lonza) with Solution R using program U-016. The transfected cells were analyzed 48 hours later.
Assay to measure miR15a/16-1
Total RNA was extracted from the cells with a microRNA isolation kit (Ambion) and was converted to complementary DNA using the TaqMan MicroRNA Reverse Transcription kit and TaqMan reverse transcription primers (Applied Biosystems). For miRNA quantification, TaqMan miRNA assays (Applied Biosystems) were used according to the manufacturer’s protocol. Expression levels were normalized to the U6 spliceosomal RNA.
Western blot analysis
Splenic B cells were isolated via negative selection. The isolated cells were lysed and the lysates were separated by sodium dodecyl sulfate–polyacrylamide gel electrophoresis (SDS-PAGE) gel. The membranes were incubated with indicated antibodies and the signals were revealed with an ECL detection system (Pierce). The antibodies against Tcl-1, Bcl-2, Bcl-xl, and Mcl-1 were obtained from Cell Signaling Technology.
Results
Spontaneous CLL development in IRF4-deficient Vh11 knock-in mice
We have been using IRF4-deficient mice (C57B6) to examine the role of IRF4 in B-cell development and function.3 However, we failed to observe an overt CLL development in these mice (data not shown). We reasoned that this may be caused by an insufficient number of B1 cells in the wild-type background, as B1 cells consist of only 5% of total B lymphocytes in adult mice. Therefore, we postulated that the effect of low levels of IRF4 on CLL development should be examined in mice that have an expanded B1-cell population. Since Vh11 knock-in mice have an expanded B1-cell population, we decided to generate IRF4-deficient mice expressing the Vh11 knock-in allele. To this end, we backcrossed Vh11 mice (CB17) into IRF4−/−mice (C57B6) for at least 6 generations (IRF4−/−Vh11). To monitor pathogenesis of CLL, we collected blood monthly from the saphenous vein of IRF4−/−Vh11, IRF4+/−Vh11, and IRF4+/+Vh11 littermate control mice. The appearance of a monoclonal IgM+CD5+ population and its percentage among peripheral blood mononuclear cells (PBMCs) were used for initial CLL diagnosis. The diagnostic criterion for CLL in IRF4−/−Vh11 mice is the appearance of monoclonal IgM+CD5+ cells constituting over 20% of PBMCs. If the percentage of the IgM+CD5+ clone is under 20% of the PBMCs, the diagnosis is monoclonal B-cell lymphocytosis (MBL).
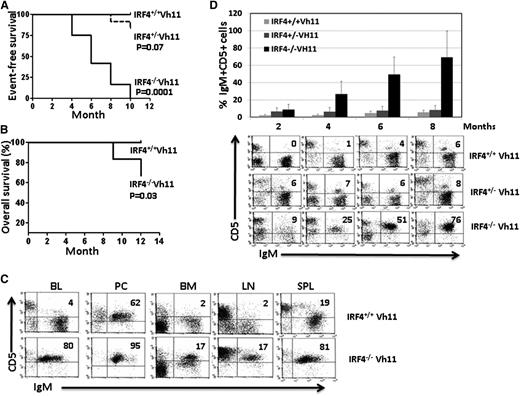
Interestingly, 7 of 12 IRF4−/−Vh11 mice developed CLL after just 5 months while the rest developed MBL (Figure 1A). The mice with MBL all progressed into CLL within another 5 months. In contrast, none of the IRF4+/+Vh11 control mice developed CLL or MBL within 12 months (Figure 1A). We failed to observe overt CLL development in IRF4+/−Vh11 mice. However, 2 IRF4+/−Vh11 mice did develop MBL-like disease at 10 months of age (Figure 1A). Among the CLL cases that emerged from IRF4−/−Vh11 mice, 70% resembled indolent CLL where the mice had no systemic symptoms and histologic analysis revealed little infiltration of CLL cells into nonlymphoid organs and tissues. The other 30% exhibited aggressive behavior where the mice exhibited systemic symptoms accompanied by infiltrations of CLL cells into nonlymphoid organs and tissues. The mice in the latter case often succumbed to diseases within 12 months (Figure 1B). FACS analysis was carried out to characterize CLL cells in the IRF4−/−Vh11 mice (Figure 1C). IgM+CD5+ CLL cells were detected in blood, bone marrow, lymph node, and spleen of IRF4−/−Vh11 mice (Figure 1C). In the PC where B1 cells normally reside, the IgM+CD5+ B1 cells were also detected in the IRF4+/+Vh11 control mice. The presence of significant numbers of CLL cells in the lymph node and spleen of IRF4−/−Vh11 mice caused massive splenomegaly and lymph adenopathy. The splenomegaly and lymph adenopathy were more prominent in IRF4−/−Vh11 mice with CLL than those with MBL. The average numbers of IgM+CD5+ CLL cells in spleens of IRF4−/−Vh11 mice with CLL and MBL were 2.4 ± 1.2 × 10⁸ (n = 6) and 0.6 ± 0.4 × 10⁸ (n = 5), respectively. To understand the progression of CLL cells in IRF4−/−Vh11 mice, we calculated the frequencies of CLL cells among PBMCs over a period of 8 months. The IgM+CD5+ CLL cells typically started to appear in blood of IRF4−/−Vh11 mice at 2 to 4 months of age (Figure 1D). The frequencies of the CLL cells steadily increased over the next few months, reaching an average of 69% of PBMC at 8 months of age. In contrast, the frequencies of IgM+CD5+ cells were low and relatively stable in IRF4+/+Vh11 and IRF4+/−Vh11 mice throughout the entire period (Figure 1D).
Spontaneous CLL development in IRF4-deficient Vh11 knock-in mice. (A) Kaplan-Meier Event-free survival curve of IRF4+/+Vh11, IRF4+/−Vh11, and IRF4−/−Vh11 mice. Twelve mice from each genotype were used for the analysis. P values are pairwise comparison (log-rank test) between IRF4+/+Vh11 and IRF4+/−Vh11, and between IRF4+/+Vh11 and IRF4−/−Vh11. Graphpad PRISM was used to plot the survival curve and to calculate P value. (B) Kaplan-Meier overall survival curve of IRF4+/+Vh11 and IRF4−/−Vh11 mice. Ten mice from each genotype were used for the analysis. (C) Cells were isolated from blood, PC, bone marrow, lymph node, and spleen of 5-month-old IRF4+/+ Vh11 and IRF4−/−Vh11 mice. The isolated cells were stained with antibodies against CD5 and IgM and analyzed by FACS. (D) Blood was collected from IRF4+/+Vh11, IRF4+/−Vh11, and IRF4−/−Vh11 mice for FACS analysis. The blood was collected from these mice every 2 months for a period of 8 months. There were 5 mice in each group. The frequency of CD5+IgM+ cells among PBMCs was calculated by FACS analysis. The average and SD of the frequency of CD5+IgM+ cells in each group at different time points were calculated (top). A representative FACS analysis for each group at different time points was shown (bottom). BL, blood; BM, bone marrow; LN, lymph node; SPL, spleen.
Spontaneous CLL development in IRF4-deficient Vh11 knock-in mice. (A) Kaplan-Meier Event-free survival curve of IRF4+/+Vh11, IRF4+/−Vh11, and IRF4−/−Vh11 mice. Twelve mice from each genotype were used for the analysis. P values are pairwise comparison (log-rank test) between IRF4+/+Vh11 and IRF4+/−Vh11, and between IRF4+/+Vh11 and IRF4−/−Vh11. Graphpad PRISM was used to plot the survival curve and to calculate P value. (B) Kaplan-Meier overall survival curve of IRF4+/+Vh11 and IRF4−/−Vh11 mice. Ten mice from each genotype were used for the analysis. (C) Cells were isolated from blood, PC, bone marrow, lymph node, and spleen of 5-month-old IRF4+/+ Vh11 and IRF4−/−Vh11 mice. The isolated cells were stained with antibodies against CD5 and IgM and analyzed by FACS. (D) Blood was collected from IRF4+/+Vh11, IRF4+/−Vh11, and IRF4−/−Vh11 mice for FACS analysis. The blood was collected from these mice every 2 months for a period of 8 months. There were 5 mice in each group. The frequency of CD5+IgM+ cells among PBMCs was calculated by FACS analysis. The average and SD of the frequency of CD5+IgM+ cells in each group at different time points were calculated (top). A representative FACS analysis for each group at different time points was shown (bottom). BL, blood; BM, bone marrow; LN, lymph node; SPL, spleen.
Phenotypic and histologic analyses of CLL cells in IRF4−/−Vh11 mice
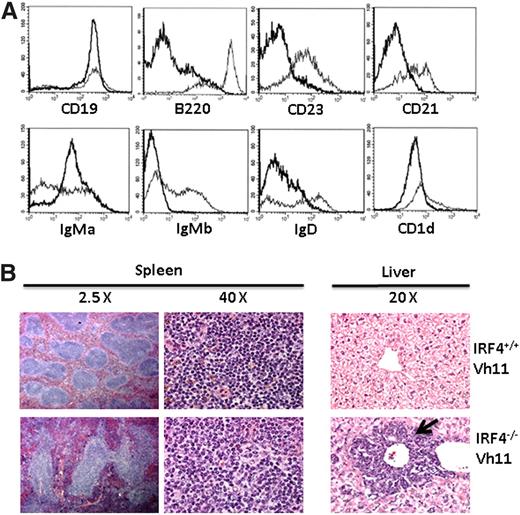
To further characterize CLL cells, we isolated splenic cells from IRF4−/−Vh11 and IRF4+/+Vh11 mice and stained them with a panel of antibodies against CD19, B220, CD23, CD21, IgD, CD1d, IgMa, and IgMb. CD23, CD21, and IgD are expressed at high levels on follicular B cells (major splenic B-cell population) but at low levels on B1 cells. Marginal zone B cells express high levels of CD1d whereas other B-cell subsets including B1 cells express intermediate levels of CD1d (CD1dint). The knock-in Vh11 heavy chain is an IgMa allotype which can be distinguished from endogenous Ig heavy chain (IgMb). When compared with splenic B cells in IRF4+/+Vh11 mice, IRF4−/−Vh11 CLL cells were CD19+, B220low/−, CD23−, CD21−, IgDlow, and CD1dint (Figure 2A). The surface phenotype of IRF4−/−Vh11 CLL cells resembles B1 cells from which they are derived. Finally, IRF4−/−Vh11 CLL cells were IgMa+IgMb−, indicating that they express only Vh11 knock-in allele. In contrast, B cells in IRF4+/+Vh11 mice were a mixed population where some B cells expressed the knock-in allele (IgMa+) while others expressed the product of rearranged endogenous heavy chain (IgMb+).
Phenotypic and histologic analyses of CLL cells in the IRF4−/−Vh11 mice. (A) Splenocytes from IRF4+/+ Vh11 and IRF4−/−Vh11 mice were stained with antibodies against CD19, B220, IgMa, IgMb, CD21, CD23, IgD, and CD1d. The stained cells were analyzed by FACS. The data were presented as a histogram under a B-cell gate. Dark line, IRF4−/− Vh11 CLL cells; light line, IRF4+/+ Vh11 B cells. (B) Spleens and livers were isolated from 5-month-old IRF4−/−Vh11 and IRF4+/+Vh11 mice. The tissues were fixed, sectioned, stained with H&E. The spleen sections are shown at ×2.5 and ×40; the liver sections are shown at ×20. Arrow indicates the infiltrated CLL cells in liver.
Phenotypic and histologic analyses of CLL cells in the IRF4−/−Vh11 mice. (A) Splenocytes from IRF4+/+ Vh11 and IRF4−/−Vh11 mice were stained with antibodies against CD19, B220, IgMa, IgMb, CD21, CD23, IgD, and CD1d. The stained cells were analyzed by FACS. The data were presented as a histogram under a B-cell gate. Dark line, IRF4−/− Vh11 CLL cells; light line, IRF4+/+ Vh11 B cells. (B) Spleens and livers were isolated from 5-month-old IRF4−/−Vh11 and IRF4+/+Vh11 mice. The tissues were fixed, sectioned, stained with H&E. The spleen sections are shown at ×2.5 and ×40; the liver sections are shown at ×20. Arrow indicates the infiltrated CLL cells in liver.
IRF4−/−Vh11 mice exhibited splenomegaly and in cases of aggressive CLL, enlarged livers. These findings indicate that CLL cells infiltrate not only lymphoid organs and tissues but also nonlymphoid organs including livers. To verify this result, we performed histologic analysis of spleens and livers of IRF4−/−Vh11 and IRF4+/+Vh11 mice. Histologic examination of spleen of IRF4−/−Vh11 mice revealed a grossly distorted white pulp and red pulp, with much larger, irregular lymphoid follicles (Figure 2B). Hematoxylin-and-eosin (H&E) staining of liver revealed infiltration of lymphocytes around central vein in the IRF4−/−Vh11 mice (Figure 2B). Although the perivascular infiltrations were prominent in the liver of IRF4−/−Vh11 mice, infiltrating lymphocytes could also be detected in other regions of the liver.
IRF4−/−Vh11 CLL cells proliferate mainly in spleen and are resistant to apoptosis
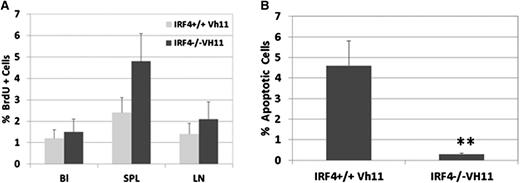
We wanted to further characterize the behavior of IRF4−/−Vh11 CLL cells by examining their proliferation and survival in vivo. To determine their proliferating rate, IRF4−/−Vh11 mice were pulse-labeled with BrdU, and the percentages of BrdU-positive IgM+CD5+ cells in blood, spleen, and lymph node were examined. IRF4+/+Vh11 mice were examined as control. In blood, the percentages of BrdU-positive cells in IRF4+/+Vh11 and IRF4−/−Vh11 mice were at 1.1% and 1.3%, respectively (Figure 3A). The low percentage of BrdU-positive cells in blood indicates that IRF4−/−Vh11 CLL cells do not proliferate in blood. Similarly, only 2% of IRF4−/−Vh11 CLL cells were found to be BrdU positive in lymph node, indicating that lymph node is not the major site for their expansion either. In contrast, 4.8% of splenic CLL cells in IRF4−/−Vh11 mice were stained positive for BrdU, indicating that spleen is the major organ for their expansion. To assess apoptotic status of IRF4−/−Vh11 CLL cells, we performed the TUNEL assay on isolated splenic CLL cells. While 4.5% ± 1.12% of IgM+CD5+ splenic B1 cells were found to undergo apoptosis in IRF4+/+Vh11 mice, only 0.2% ± 0.04% of IgM+CD5+ CLL cells in IRF4−/−Vh11 mice were TUNEL positive, indicating that IRF4−/−Vh11 CLL cells are resistant to apoptosis (Figure 3B). In addition, very few TUNEL-positive CLL cells were detected in blood, lymph node, and bone marrow (data not shown). In summary, these results show that expansion of IRF4−/−Vh11 CLL cells mainly occurs in the spleen and the CLL cells are resistant to apoptosis.
IRF4−/−Vh11 CLL cells proliferate mainly in spleen and are resistant to apoptosis. (A) To characterize the proliferation of IRF4−/−Vh11 CLL cells in vivo, we pulse-labeled the mice with BrdU. Twelve hours later, cells were isolated from blood, spleen, and lymph node and stained with antibodies against CD5, IgM, and BrdU. The BrdU-positive cells were revealed by FACS analysis. (B) Splenocytes were isolated from IRF4−/−Vh11 and IRF4+/+Vh11 mice and stained with CD5 and IgM. The apoptotic cells were detected by TUNEL assay. Values are averages and SDs of 3 independent experiments. *P < .01.
IRF4−/−Vh11 CLL cells proliferate mainly in spleen and are resistant to apoptosis. (A) To characterize the proliferation of IRF4−/−Vh11 CLL cells in vivo, we pulse-labeled the mice with BrdU. Twelve hours later, cells were isolated from blood, spleen, and lymph node and stained with antibodies against CD5, IgM, and BrdU. The BrdU-positive cells were revealed by FACS analysis. (B) Splenocytes were isolated from IRF4−/−Vh11 and IRF4+/+Vh11 mice and stained with CD5 and IgM. The apoptotic cells were detected by TUNEL assay. Values are averages and SDs of 3 independent experiments. *P < .01.
IRF4−/−Vh11 CLL cells are transplantable in immunodeficient host mice
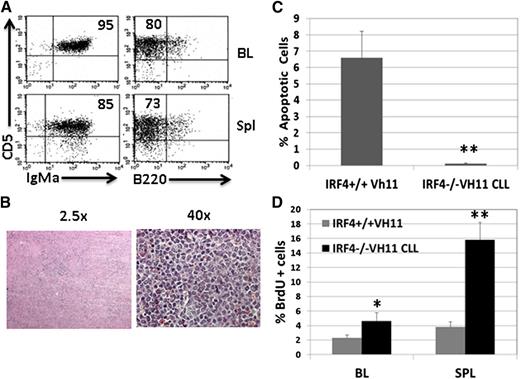
To determine whether the CLL cells in the IRF4−/−Vh11 mice are transplantable, we isolated splenic CLL cells from IRF4−/−Vh11 mice and transplanted them into immunodeficient Rag2−/−γ−/− host mice. The presence of IgM+CD5+ CLL was detected in the blood of host mice within a week of transplantation, and the host mice (n = 10) all succumbed to CLL within 1 month posttransplantation. Three weeks after transplantation, CLL cells in the blood and spleen of host mice were analyzed by FACS (Figure 4A). By this time, 95% of PBMCs consisted of IgMa+CD5+ CLL cells. The spleens of host mice were dramatically enlarged where 85% of splenic cells were CLL cells. H&E staining of the spleen revealed that the spleens had no discernible white and red pulps and CLL cells were evenly distributed throughout spleen (Figure 4B). Similar to the donor CLL cells, transplanted CLL cells were resistant to apoptosis (Figure 4C). A BrdU-labeling study revealed that transplanted CLL cells are proliferating predominantly in spleen: 16% of transplanted CLL cells in spleen were BrdU+ while only 4% of them were BrdU positive in blood. Collectively, our results show that IRF4−/−Vh11 CLL cells are transplantable in immunodeficient host mice
IRF4−/−Vh11 CLL cells are transplantable in immunodeficient host mice. CLL cells were isolated from spleens of IRF4−/− Vh11 mice and transplanted into Rag2−/−γ−/− mice. A total of 106 CLL cells was used for each injection. Three weeks after transplantation, the mice were analyzed. (A) Blood and spleen of the host mice were analyzed by FACS. (B) H&E staining of spleen of transplanted host mice. (C) CLL cells were isolated from spleens of host mice. TUNEL assay was used to detect apoptotic cells. Splenic B cells from IRF4+/+Vh11 mice were analyzed as control. (D) Host mice were pulse-labeled with BrdU and examined 12 hours later. BrdU+ cells in blood and spleen of IRF4+/+Vh11 mice were also examined and used as control. *P < .05; **P < .01.
IRF4−/−Vh11 CLL cells are transplantable in immunodeficient host mice. CLL cells were isolated from spleens of IRF4−/− Vh11 mice and transplanted into Rag2−/−γ−/− mice. A total of 106 CLL cells was used for each injection. Three weeks after transplantation, the mice were analyzed. (A) Blood and spleen of the host mice were analyzed by FACS. (B) H&E staining of spleen of transplanted host mice. (C) CLL cells were isolated from spleens of host mice. TUNEL assay was used to detect apoptotic cells. Splenic B cells from IRF4+/+Vh11 mice were analyzed as control. (D) Host mice were pulse-labeled with BrdU and examined 12 hours later. BrdU+ cells in blood and spleen of IRF4+/+Vh11 mice were also examined and used as control. *P < .05; **P < .01.
Molecular signatures of IRF4−/−Vh11 CLL cells
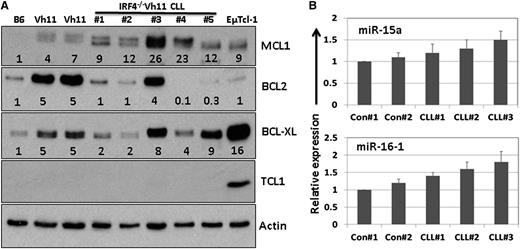
To further characterize IRF4−/−Vh11 CLL cells, we examined some common molecular signatures that are associated with human CLL cells, including expression of Bcl-2 family members, T-cell leukemia/lymphoma 1 (Tcl1) and miR15a/16-1 miRNAs. Splenic CLL cells were isolated from 5 IRF4−/−Vh11 mice and lysed. As controls, we also isolated splenic B cells from 2 IRF4+/+Vh11 (Vh11) mice and 1 IRF4+/+ mice (B6). Expression of Bcl-2 family members Bcl-2, Bcl-xl, and Mcl-1 was examined by western blot (Figure 5A). Our results show that compared with controls, expression of Mcl-1 was significantly elevated in all 5 CLL samples (Figure 5A). In contrast, expression of Bcl-2 was decreased in the majority of the CLL samples. Expression of Bcl-xl was moderately increased in some but not all CLL samples. Interestingly, compared with B cells in IRF4+/+ mice, expression of Bcl-2 family members appears to be elevated in splenic B cells of IRF4+/+Vh11 mice. The reason behind this observation is not clear. Since expression of Bcl2, Mcl-1, and Bcl-xl can be induced by BCR signaling, it is possible that IRF4+/+Vh11 B cells were in an activated state due to the presence of high levels of PtC in spleen. Expression of Tcl-1 can be detected in 90% of human CLL cases and is found to be overexpressed in patients with aggressive CLL.25 Moreover, mice engineered to overexpress Tcl1 oncogene in B cells (EµTcl-1) develop late-onset, aggressive CLL.26 However, except for CLL cells isolated from EµTcl-1 transgenic mice, expression of Tcl1 could not be detected in samples derived from IRF4−/−Vh11 CLL cells, indicating that expression of Tcl1 was very low in those samples (Figure 5A). Additionally, compared with their expressions in the control cells, miR15a/16-1 expression were slightly elevated in the CLL cells (Figure 5B). In summary, our results show that expression of Mcl-1 is significantly elevated in the IRF4−/−Vh11 CLL cells, however, Tcl1 and miR15a/16-1 expression are not deregulated in these cells.
Molecular characterization of IRF4−/−Vh11 CLL cells. (A) Splenic CLL cells were isolated from 5 IRF4−/−Vh11 mice via negative selection and lysed for western blot analysis with indicated antibodies. Splenic B cells from IRF4+/+Vh11(Vh11) and IRF4+/+ (B6) mice were also isolated and analyzed as controls. Additionally, splenic CLL cells from EµTcl1 transgenic mice were used as positive control for Tcl-1 expression. The numbers below each lane indicate the fold change in comparison with the control. The intensity of each protein was normalized initially to β-actin. (B) Total RNA was also extracted from the isolated cells. Real-time TaqMan polymerase chain reaction to detect expression of miR15a/16-1 was done using a kit from Applied Biosystems. The data were normalized to U6 spliceosomal RNA and were expressed as fold change in comparison with controls (IRF4+/+Vh11).
Molecular characterization of IRF4−/−Vh11 CLL cells. (A) Splenic CLL cells were isolated from 5 IRF4−/−Vh11 mice via negative selection and lysed for western blot analysis with indicated antibodies. Splenic B cells from IRF4+/+Vh11(Vh11) and IRF4+/+ (B6) mice were also isolated and analyzed as controls. Additionally, splenic CLL cells from EµTcl1 transgenic mice were used as positive control for Tcl-1 expression. The numbers below each lane indicate the fold change in comparison with the control. The intensity of each protein was normalized initially to β-actin. (B) Total RNA was also extracted from the isolated cells. Real-time TaqMan polymerase chain reaction to detect expression of miR15a/16-1 was done using a kit from Applied Biosystems. The data were normalized to U6 spliceosomal RNA and were expressed as fold change in comparison with controls (IRF4+/+Vh11).
Reconstitution of IRF4 expression inhibits the survival of IRF4−/−Vh11 CLL cells
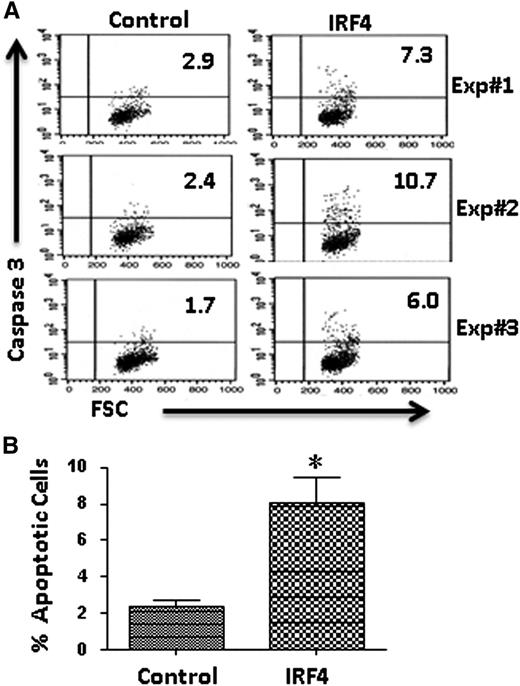
Since IRF4−/−Vh11 CLL cells are resistant to apoptosis, we wanted to examine how IRF4 affects the survival of these CLL cells. To this end, we reconstituted the expression of IRF4 in the IRF4−/−Vh11 CLL cells. Briefly, IRF4-expressing plasmid (coexpressing GFP) was transfected into cultivated IRF4−/−Vh11 CLL cells using a Nucleofector. The effect of IRF4 reconstitution on CLL cells was examined after 48 hours. The control vector-transduced CLL cells were analyzed as control. The transfection efficiency was ∼10% for control transfected cells but only 3% in the IRF4-transduced cells. The apoptotic cells were detected with antibody against activated Caspase 3. Results of 3 independent experiments were shown (Figure 6A). The averages and SDs of the 3 independent experiments were statistically analyzed (Figure 6B). While the percentage of apoptotic cells in control transduced cells was only 2.3% ± 0.6%, the percentage of apoptotic cells increased to 8.0% ± 2.4% in the IRF4-transduced cells (Figure 6B). This result indicates that reconstitution of IRF4 promotes apoptosis in the IRF4−/−Vh11 CLL cells in vitro.
Reconstitution of IRF4 expression inhibits the survival of IRF4−/−Vh11 CLL cells. (A) CLL cells were isolated from spleen of IRF4−/−Vh11mice and plated on top of S17 stromal cells in RPMI 1640 media containing 10% fetal bovine serum. IRF4-expressing vector and control vector were transfected into cultivated CLL cells using a Nucleofector. Forty-eight hours later, the apoptotic cells in successfully transfected CLL cells (GFP+) were analyzed with a kit detecting activated Caspase 3 (BD Pharmingen). FSC, forward scatter. The results of 3 independent experiments were shown. (B) Averages and SDs of 3 independent experiments. *P < .02.
Reconstitution of IRF4 expression inhibits the survival of IRF4−/−Vh11 CLL cells. (A) CLL cells were isolated from spleen of IRF4−/−Vh11mice and plated on top of S17 stromal cells in RPMI 1640 media containing 10% fetal bovine serum. IRF4-expressing vector and control vector were transfected into cultivated CLL cells using a Nucleofector. Forty-eight hours later, the apoptotic cells in successfully transfected CLL cells (GFP+) were analyzed with a kit detecting activated Caspase 3 (BD Pharmingen). FSC, forward scatter. The results of 3 independent experiments were shown. (B) Averages and SDs of 3 independent experiments. *P < .02.
Discussion
The SNPs in the 3′–untranslated region of IRF4 gene locus were identified as a risk allele for both sporadic and familial CLL and at least 1 copy of the allele is present in over 86% CLL cases.27 The prevalence of the risk allele in the CLL patient indicates that it may play an important role in the initiation of CLL. Indeed, our finding that IRF4−/−Vh11 mice develop early-onset CLL at 100% penetrance supports this assertion. In this study, we used IRF4-deficient mice to mimic the effect caused by germline-associated SNPs in CLL patients. However, IRF4 germline-deficient mice harbor developmental defects not only in B cells but also in other lineages of immune cells including T cells.1 CLL development and progression can be regulated by both B-cell intrinsic and -extrinsic factors.28 A recent study has further demonstrated that survival and expansion of transplanted human CLL cells are dependent on autologous T cells.29 However, our result shows that IRF4−/−Vh11 CLL cells were transplantable in immunodeficient host mice, indicating that survival and expansion of IRF4−/−Vh11 CLL cells in the host mice are not dependent on other IRF4-deficient immune cells.
Our results revealed that spleen is the major organ where IRF4−/−Vh11 CLL cells proliferate. It was initially thought that CLL cells have a low proliferation index. However, a heavy water experiment has demonstrated that a small fraction of CLL cells are actively cycling and ∼2% of CLL cells are newly generated each day.30 In humans, CLL cells proliferate in a unique structure called the proliferation center found predominantly in the lymph node and bone marrow. Human CLL cells, like murine B1 cells, possess polyreactive BCRs that recognize self-antigen and microbial antigen and chronic autoantigen stimulation is believed to play a critical role in the development and progression of CLL.31,32 Interestingly, PtC was also identified as a common antigen recognized by many CLL clones derived from EµTcl-1 mice.26 Moreover, a recent study further demonstrates that autoantigen PtC promotes CLL progression by selecting variants with enhanced BCR signaling.33 The reason that IRF4−/−Vh11 CLL cells were found to proliferate predominantly in spleen could be due to the abundance of their cognate antigen there.
Our results show that IRF4−/−Vh11 CLL cells express high levels of Mcl-1. Human CLL cells are known to overexpress Mcl-1 as well as other members of prosurvival Bcl-2 family proteins. Among the Bcl-2 family members, Mcl-1 is the major prosurvival factor for CLL cells.34 Clinically, Mcl-1 is shown to be better than other Bcl-2 family members at predicting prognosis and clinical behavior of CLL patients.35 MiR15a/16 were initially thought to inhibit CLL development mainly by suppressing Bcl-2 expression.36 However, recent genetic analysis indicates that miR15a/16 also regulate a group of proteins that are critical for cell-cycle progression.37 Our results show that expression of miR15a/16-1 is not deregulated in the IRF4−/−Vh11 CLL cells. Expression of miR15a/16-1 also appears to be normal in the Tcl-1 transgenic mice. Only in Tcl-1 mice that are null for p53, expression of miR15a/16-1 was found to be dramatically reduced.38 High levels of Tcl-1 activate Akt and promote survival of CLL cells.39,40 However, our results show that Tcl-1 is expressed at a low level in the IRF4−/−Vh11 CLL cells.
Several mouse models have been generated to mimic pathogenesis of human CLL. EµTcl-1 transgenic mice develop lymphoproliferative diseases at 100% penetrance.41 CLL cells in EµTcl-1 transgenic mice possess stereotype BCR and resemble aggressive human CLL.26 In this model, CLL cells can be detected at 7 to 8 months of age and all mice eventually succumb to disease. Although Tcl-1 is overexpressed in a subset of human CLL patients, EµTcl-1 transgenic mice are not associated with any genetic lesion commonly associated with human CLL. Deletion of 13q14 is detected in 50% to 60% of human CLL cases.14 Recent efforts to mimic this genetic lesion in mice led to generation of 3 mice lines: (1) the first targeted only miR15a/16-1 located in the intron of Dleu2; (2) the second targeted the minimal deletion region (MDR) containing miR15a/16-1 and the entire Dleu2 gene; (3) the third targeted the common deleted region (CDR) including the MDR region and beyond.37,42 All 3 mice lines develop late-onset lymphoproliferative disease resembling indolent CLL. The severity of the diseases is proportional to the length of deleted genetic region. The disease penetrance in the 3 lines also varies: 67% for CDR mice, 42% for MDR mice, and 26% for miR15a/16-1 deletion mice. The 13q14 deletion models mimic a major genetic lesion in human CLL and are clinically relevant models to study pathogenesis of human CLL. However, whether this model is suitable for therapeutic purposes is unclear.
Our findings presented here establish IRF4−/−Vh11 mice as a novel mouse model of CLL. IRF4−/−Vh11 mice have the following unique features: (1) IRF4−/−Vh11 mice carry a well-defined BCR which recognizes autoantigen PtC. It is worth pointing out that Vh11 (paired with Vk14 in the IRF4−/−Vh11 mice) is a relevant BCR because anti-PtC IgMs have been found not only in normal individuals but also in CLL patients as well as patients with systemic lupus erythematosus43-45 ; (2) IRF4−/−Vh11 mice mimic a predominant genetic predisposition to CLL and thus represent a clinically relevant CLL model. (3) In contrast to other models, IRF4−/−Vh11 mice develop early-onset CLL with shortened disease latency; and (4) IRF4−/−Vh11 mice develop a broad spectrum of lymphoproliferative diseases, from MBL, to indolent CLL, and to aggressive CLL. Therefore, IRF4−/−Vh11 mice will be a useful model to dissect pathogenesis and progression of CLL. Epigenetic changes have been linked to CLL development and progression.46,47 It would be interesting to study the epigenetic changes that accompany CLL initiation and progression in IRF4−/−Vh11 mice. In this study, IRF4−/−Vh11 mice were generated through backcrossing Vh11 mice in the CB17 background to IRF4−/− mice in the C57B6 background. The IRF4−/−Vh11 mice used in this study have been backcrossed for at least 6 generations which should contain over 98% of C57B6 DNA. Ideally, Vh11 should be backcrossed to the C57B6 background for at least 10 generations to rule out the potential effect of a mixed genetic background on the development of CLL. Whether IRF4−/−Vh11 mice would be useful for testing therapeutic drugs for CLL is unclear. In the future, in vivo evaluation with therapeutic agents such as Ibrutinib (Btk inhibitor) and Fostamatinib (Syk inhibitor) should be done to determine their effectiveness in this model.
There is an Inside Blood commentary on this article in this issue.
The publication costs of this article were defrayed in part by page charge payment. Therefore, and solely to indicate this fact, this article is hereby marked “advertisement” in accordance with 18 USC section 1734.
Acknowledgments
This work was supported by National Institutes of Health grant AI67891 (R.L.) and an LB506 grant (R.L.) from Nebraska Health and Human Services.
Authorship
Contribution: V.S. and S.M. performed experiments and analyzed data; R.R.H. provided Vh11 knock-in mice; S.S.J. supervised the research; and R.L. designed and supervised experiments and wrote the paper.
Conflict-of-interest disclosure: The authors declare no competing financial interests.
Correspondence: Runqing Lu, Department of Genetics, Cell Biology, and Anatomy, University of Nebraska Medical Center, 985805 Nebraska Medical Center, Omaha, NE 68198; e-mail: Rlu@UNMC.edu.
References
Author notes
V.S. and S.M. contributed equally to this work.

