Key Points
miR-155 levels are significantly and increasingly overexpressed as normal B cells progress to MBL and to CLL.
Plasma levels of miR-155 before treatment were significantly lower in patients with CLL who experienced complete response than in all others.
Abstract
Noncoding RNAs play a pivotal role in the pathogenesis of chronic lymphocytic leukemia (CLL). We hypothesized that microRNAs (miRs) are involved in the transition from monoclonal B-cell lymphocytosis (MBL) to CLL and tested miR-15a/16-1 cluster, miR-21, and miR-155 expression in purified B cells of normal individuals, individuals with MBL, and patients with CLL. When we analyzed 224 samples from 2 independent training and validation cohorts, we found that miR-155 was overexpressed in B cells from individuals with MBL, and even more so in B cells from patients with CLL, when compared with B cells from normal individuals. Furthermore, we were able to identify miR-155 in circulating microvesicles from both individuals with MBL and patients with CLL. Next, to examine the prognostic role of miR-155, we measured its expression level in plasma samples collected before treatment initiation in 228 patients with CLL. We found significantly higher miR-155 expression levels in patients who failed to achieve a complete response compared with those who experienced complete response. Our findings support the use of cellular and plasma levels of miR-155 as biomarkers for the risk of progression in individuals with MBL, as well as to identify patients with CLL who may not respond well to therapy.
Introduction
Discoveries during the past decade have shown that noncoding RNAs (RNAs that do not code for proteins)1 play a central role in the molecular pathogenesis of chronic lymphocytic leukemia (CLL).2 In particular, small microRNAs (miRNAs, or miRs) regulate gene expression by targeting messenger RNA (mRNA) for degradation or translational repression and are involved at the posttranscriptional level in many physiologic and pathologic processes.3 Complex interaction networks composed of coding and noncoding genes have been found to be involved in the pathogenetic mechanism of CLL, influencing the natural history of the disease. For example, a miRNA/TP53 feedback circuitry is associated with CLL pathogenesis and outcome,4 and multiple defects in the components of the TP53 pathway are involved in fludarabine-refractory CLL.5
Although these findings expand our understanding of the molecular pathology of CLL, the molecular mechanisms related to the earliest stages of CLL development, the transformation of normal B cells to malignant B cells, and the progression of this disease are still unknown. During the last several years, it has become apparent that monoclonal B-cell populations with an aberrant immunophenotype similar to that of CLL can be detected in up to 3% of individuals who otherwise lack signs and symptoms of CLL.6 Monoclonal B-cell populations may also be identified in asymptomatic individuals undergoing evaluation for lymphocytosis (absolute lymphocyte count is from 3 to 5 × 10⁶/μL), and these patients are designated as having “clinical” or “high-count monoclonal B-cell lymphocytosis” (MBL).7 MBL clones may demonstrate the common recurrent cytogenetic abnormalities associated with typical CLL and are more common in elderly adults and in individuals with a family history of CLL.8 Despite the presence of an aberrant immunophenotype and cytogenetic abnormalities, progression to CLL among individuals with clinical MBL is very low (1%-2% per year),8,9 and the risk of developing CLL among individuals with population-screening MBL may not differ from that of the general population. Furthermore, the events that initiate progression from clinical MBL to CLL remain unknown.6 At this time, we cannot predict which individuals with MBL will develop CLL or when this will occur.
Effective treatment options are available for patients with CLL, such as the chemoimmunotherapy combination of fludarabine, cyclophosphamide, and rituximab (FCR). These types of treatments can induce remissions in up to 90% of patients.10 However, some patients do not respond to up-front chemoimmunotherapy combinations, or they rapidly develop resistance to the treatment. In addition, the durations of the remission vary.10,11 Although 17p deletion defects or p53 mutations account for perhaps 30% to 40% of all cases of CLL with primary resistance to chemoimmunotherapy, the remainder of the of with chemoimmunotherapy-resistant CLL have unknown resistance mechanisms.12 Markers such as immunoglobulin heavy chain variable (IgHV) status and β-2-microglobulin (B2M) levels have been shown to predict treatment-free intervals, remission durations, and survival, but they have a limited ability to predict clinical response.13 However, we have previously found that miRNAs (such as miR-21) can be used to stratify patients with CLL in terms of their risk for disease progression.14 In this study, on the basis of the important role of miRNAs in CLL initiation and progression,2 we hypothesized that some miRNAs might be involved in the transition from clinical MBL to CLL and that these miRNAs may also predict response to therapy in patients with CLL.
Materials and methods
Cell samples from normal individuals, individuals with MBL, and patients with CLL
We analyzed samples collected from individuals with MBL and patients with CLL who have consented to be part of the Mayo Clinic CLL Database and Tissue Bank.9,15 This study was reviewed and approved by the Human Subjects Institutional Review Board at the Mayo Clinic, and written informed consent was obtained from all participants in accordance with the Declaration of Helsinki. The Mayo Clinic CLL Database includes all patients diagnosed with CLL or MBL who visited the Division of Hematology at Mayo Clinic Rochester, in Minnesota, and who permitted their records to be used for research purposes. Individuals participating in the clinical database who consent to provide research samples also contribute blood samples as part of a companion protocol. Clinical information, prognostic parameters, treatment history, and disease-related complications are abstracted from clinical records for all patients at the time of inclusion and are maintained on an ongoing, prospective basis. Results of prognostic testing performed as part of clinical or research studies are also included in the database. This includes evaluation of absolute lymphocyte count, IgHV gene mutation analysis, ζ-chain-associated protein kinase 70 kDa (ZAP70) status, CD38 status, and cytogenetic abnormalities determined by interphase fluorescence in situ hybridization (FISH) testing, using methods previously described.16-19 ZAP70 positivity was defined as more than 20% of cells positive for ZAP70 expression according to flow cytometry, and IgHV mutation was defined by the presence of less than 98% homology at sequencing.
B cells were isolated and/or purified from blood samples of normal individuals, individuals with MBL, and patients with CLL, using the RosetteSep B-cell enrichment technique (StemCell Technologies). Samples were divided into training (8 normal individuals, 63 individuals with MBL, and 70 patients with CLL, group A) and validation (12 normal individuals, 48 individuals with MBL, and 23 patients with CLL, group B) sets. MBL and CLL samples for group A were isolated from heparinized venous blood by density gradient centrifugation. Postseparation purity, as assessed by flow cytometry (available on 121/133 [93%] of patients), indicated that the isolated cells were predominantly CLL B cells (median, 80% CD19+, of which a median of 97% were coexpressed CD5+ and CD19+). All MBL samples for group B and any CLL samples from group B with less than 70% CD19+ cells post-density gradient centrifugation were purified using Easysep Human B-Cell Enrichment Kits. The typical purity of CD19+ CLL B cells for this work was more than 90% (median, 95%). The clinical characteristics are summarized in Table 1; supplemental Table 1, available on the Blood Web site.
Plasma samples from patients with CLL
We analyzed plasma samples collected from patients with CLL immediately before treatment initiation. The samples were stored at −80°C until the experiments were performed.20 Samples were obtained from 143 patients who received initial treatment with FCR at The University of Texas MD Anderson Cancer Center (MD Anderson, group C), 31 patients who received FCR as a salvage treatment at the University of Southern California, San Diego (group D), and 54 patients who received treatment with lenalidomide at MD Anderson (group E). Group E was added to our study to prevent treatment bias. Of note, both the MD Anderson and the University of Southern California, San Diego, plasma samples were stored in the same centralized facility in San Diego, and therefore were maintained in the same conditions. Patient characteristics are summarized in Table 2 and supplemental Table 2. All patients from these clinical trials provided informed consent per institutional guidelines, and this study was conducted in accordance with the Declaration of Helsinki.
All patients had a confirmed diagnosis of CLL based on immunophenotypic features and were staged according to the Rai classification.21,22 Baseline B2M levels, IgHV gene mutation status, and ZAP70 expression levels were assessed either by immunohistochemistry or flow cytometry before initiation of therapy in most patients (Table 2; supplemental Table 2). Results of pretreatment standard metaphase cytogenetic analysis and FISH analysis were also available for most patients. National Cancer Institute Working Group guidelines for response to treatment (complete response, CR; nodular partial response, NPR; partial response, PR; or no response, NR) were used to define response.22
RNA isolation from B cells, miRNA expression analysis, and normalizer identification
RNA was extracted with Trizol (Life Technologies), using B cells isolated from patients in groups A and B. miRNA expression was measured with the TaqMan miRNA quantitative reverse-transcription polymerase chain reaction (qRT-PCR) method (Applied Biosystems), using a CFX384 real-time PCR detection system (Bio-Rad). Briefly, 10 ng total RNA was reverse-transcribed, using the miRNA reverse-transcription kit (Applied Biosystems) and a specific reverse-transcription stem-loop primer, according to the manufacturer’s protocol. The miRNA expression values are shown in supplemental Table 3. Expression levels for 5s ribosomal RNA (5s rRNA) were similar for all groups of plasma samples, as measured using the SYBR Green method (SsoFast; Bio-Rad) (supplemental Results; supplemental Figure 1). Reverse-transcription reaction was performed on 10 ng total RNA of each patient sample with random hexamers, using SuperScript III First-Strand Synthesis System (Invitrogen), according to the manufacturer’s instructions. qRT-PCR analysis was performed using the gene-specific Taqman assay (primers and probes; Applied Biosystems) and SsoFast Probe Supermix (BioRad), according to the manufacturer’s protocol.
RNA isolation from plasma, miRNA expression analysis, and normalizer identification
RNA isolation was performed on 100 µL stored plasma collected on citrate, using the Norgen kit (Norgen Biotek). miRNA expression was measured using the TaqMan miRNA qRT-PCR method, and all reactions were run in duplicate. The expression of a miRNA relative to the endogenous control (miR-16) was determined using the 2−ΔCt method. If expression values for the endogenous control or a specific miRNA were not obtained after 35 cycles of amplification in 2 successive experiments in duplicate wells, the specific values were considered to be unavailable. The miRNA expression values are shown in supplemental Table 4. For accuracy and reproducibility, we performed miR-16 normalization on the same 384-well plate for each target miRNA amplified.
Microvesicle purification from individuals with MBL and patients with CLL
Microvesicles (MVs) were isolated from “platelet-free plasma” obtained from a single individual with MBL, a single patient with Rai stage 0 CLL, and 3 patients with CLL of higher stages, as previously described.23,24 Purity of the MVs was determined by their binding ability to annexin V, and total amount of MV isolated was estimated using standard TRUCount beads (BD Biosciences) on a flow cytometer (BD Canto-I). Phenotypes of the MVs were also determined using a fluorescent-conjugated antibody to CD61/CD41a or CD19 to detect platelet/megakaryocyte-derived MVs or leukemic B-cell-derived MVs, respectively, as previously described.24 Total RNA was extracted from the MV preparations with TRIZOL reagent (Invitrogen).
Statistical analysis
All statistical analyses were performed in R (version 2.14.2). All tests were 2-sided and considered statistically significant at the .05 level. If the data were continuously numeric, the Shapiro-Wilk test was applied to determine whether data followed a normal distribution. The t test or analysis of variance followed by the post-hoc Tukey test (depending on the number of groups considered) was applied to normally distributed data; otherwise, the Mann-Whitney-Wilcoxon test or Kruskal-Wallis test followed by a post hoc Nemenyi test was applied to assess the relationship between miRNA expression and response to treatment. The Pearson correlation test was applied to measure the strength of the linear association between the variables. The log-rank test was employed to determine the relationship between miRNA expression and overall survival (OS; defined as the time from sample collection to death or last follow-up). The Kaplan-Meyer method was used to generate OS curves. Patients were grouped into percentiles according to miRNA expression, and the log-rank test was used to assess the relationship between miRNA expression and OS. The relationship between OS and covariates (miRNA expression levels and known prognostic factors or other clinical parameters such as clinical stage, B2M levels, IgHV mutation status, ZAP70 expression, and various FISH-detectable genetic mutations) was examined using a Cox proportional hazard model (Table 3).
Results
miRNA selection strategy
Given the small number of CD5+ B cells present in individuals with MBL clones, and therefore the limited amount of total RNA available for miRNA analysis, we decided to focus our screening on selected miRNAs that satisfied all of the following criteria: the miRNA was previously shown to be differentially expressed in CLL cells and normal B cells, expression levels of the miRNA have been shown to have prognostic value in B-cell malignancies, and mouse models supported a pathogenetic role of the miRNA in leukemia. Using these criteria, we chose the miR-15a/16-1 cluster, miR-21, and miR-155 for the initial measurements. The miR-15a/16-1 cluster contains the first miRNAs proven to be downregulated in CLL,25 and reduced expression levels are associated with good prognosis in patients with CLL.26 In addition, miR-15a/16-1 knockout mice have been shown to develop a CLL-like disease.27 miR-21 is overexpressed in patients with CLL,28,29 and high levels of miR-21 have previously been found to be associated with shorter survival in patients with CLL.14 Transgenic miR-21 mice develop B-cell leukemia.30 Finally, miR-155 is highly expressed in various types of B-cell malignancies, including CLL,24 and increased levels are associated with poor prognosis.28 Transgenic miR-155 mice develop a B-cell type of leukemia.31
Expression of miR-155 in CD19+ B cells from normal individuals, individuals with MBL, and patients with CLL.
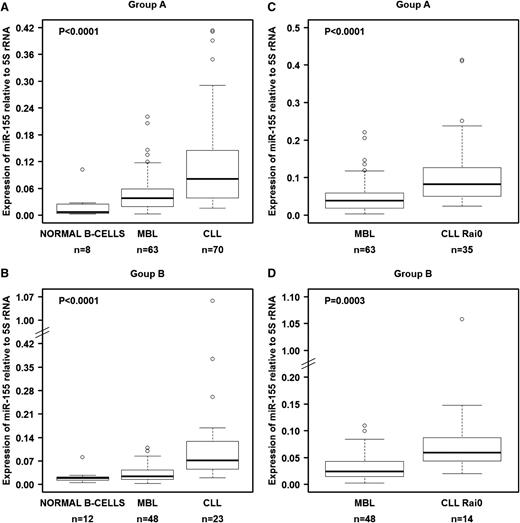
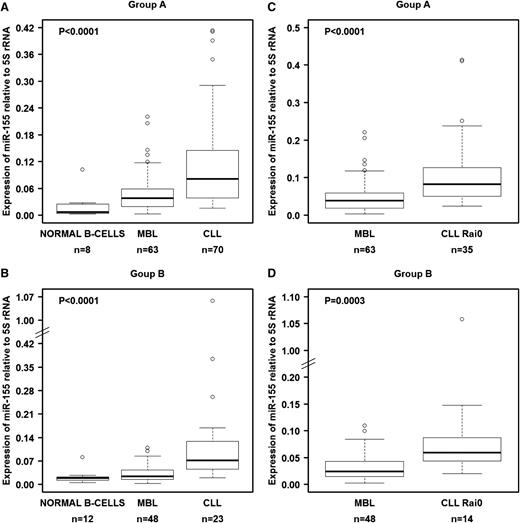
We investigated the levels of these 3 miRNAs in B cells from groups A and B (Table 1). We first tested various noncoding RNAs as normalizers, including U6 snRNA, U18 snRNA, U48 snRNA, 5S rRNA, and 18S rRNA. Of these 5 genes, only 5S rRNA showed constant expression in all 3 types of samples from both cohorts (supplemental Figure 1), and therefore we decided to use this as the reference gene, similar to another prior report.32 In both the training set (group A) and the validation set (group B), miR-155 was significantly overexpressed in MBL when compared with normal B cells and was even more highly overexpressed in CLL (Figure 1A-B). This overexpression pattern was also observed when we compared MBL cells with CLL cells from Rai 0 patients, the earliest stage of CLL (Figure 1C-D). Although the other miRNAs (miR-15a/16-1 and miR-21) showed statistically significant differential expression among the samples, they either did not follow the pattern of consistently increasing with progressing stages or the changes were not fully reproducible between the training and validation cohorts (supplemental Figure 2).
miR-155 levels in normal B cells, MBL cells, and CLL cells as measured by qRT-PCR. (A) miRNA expression in isolated and purified B cells from the training set (group A). (B) miRNA expression in isolated and purified B cells from the validation set (group B). Comparisons between MBL and Rai 0 for each set of samples are presented in panels C-D. We used 5S rRNA as a normalizer. Raw data for all samples are shown in supplemental Table 3. In panels A-B, the P values were calculated using the Kruskal-Wallis test.
miR-155 levels in normal B cells, MBL cells, and CLL cells as measured by qRT-PCR. (A) miRNA expression in isolated and purified B cells from the training set (group A). (B) miRNA expression in isolated and purified B cells from the validation set (group B). Comparisons between MBL and Rai 0 for each set of samples are presented in panels C-D. We used 5S rRNA as a normalizer. Raw data for all samples are shown in supplemental Table 3. In panels A-B, the P values were calculated using the Kruskal-Wallis test.
We also examined the relationship between miR-155 expression levels and clinical characteristics of individuals with MBL and patients with CLL. We did not find a significant correlation between miR-155 expression levels and advanced Rai stage, IgHV mutation status, ZAP70 status, FISH abnormalities, or median time to treatment (data not shown). However, when we divided the MBL samples into sextiles according to the absolute lymphocyte count (ALC), miR-155 levels were significantly higher in samples with the highest ALC compared with samples that had the lowest ALC in both A and B groups (supplemental Figure 3). The lack of correlation between miR-155 and clinical signs of disease is both consistent with and supports the concept that alterations in miR-155 expression are potentially the earliest abnormalities and therefore occur before the transition from MBL to CLL, independent of other clinical and biological abnormalities. As we previously observed that miR-21 expression levels were significantly increased in CLL patients with poor prognosis and that miR-21 predicted decreased OS,14 we used miR-21 expression as a control for performing survival analysis. In the current study, we confirmed that patients with CLL from groups A and B (n = 93) with high miR-21 levels (above the 44th percentile) had significantly shorter OS compared with patients who showed low expression of miR-21 (supplemental Figure 4).
We next postulated that miRNAs exhibiting a consistent and steady variation in expression across the clinical spectrum of human B-cell transformation may have the greatest value as biomarkers. miRNAs are secreted by various cells, including malignant cells.33,34 We previously showed that the plasma of patients with CLL contains both platelet-derived and leukemia-derived MVs.24 Because we found that only miR-155 expression consistently increased from normal B cells to B cells of MBL and from B cells of MBL to those of CLL, we decided to further focus on miR-155 measurements in plasma MVs. We tested for the presence of miR-155 in RNA MV collected from the plasma of an individual with MBL, a patient with Rai 0 CLL, and 3 patients with higher stages of CLL. Interestingly, we detected miR-155 in all of the RNA preparations from plasma MVs (supplemental Figure 5), confirming the presence of miR-155 in plasma of patients with CLL and identifying MVs as one of the mechanisms of secretion.
miR-16 as the plasma normalizer in patients with CLL
The identification of genes that are not significantly and differentially expressed among various groups of samples, and thus could be used as normalizers for various plasma samples, represents a challenging technical issue. To accomplish this, we initially performed qRT-PCR to amplify 2 genes previously used as normalizers in studies using plasma, miR-192, and miR-16,33,35 using plasma samples from 143 patients receiving first-line treatment with FCR (group C). miR-16 was expressed at high levels in all samples (mean cycle threshold [Ct] = 25.4; SD = 1.68), whereas miR-192 was expressed at low levels in about 86% of samples (mean Ct = 33.19; SD = 1.20; supplemental Figure 6). Therefore, we decided to use miR-16 as the sole normalizer according to minimum information for publication of qRT-PCR experiments guidelines.36 miR-16 was also stably expressed and at similar levels in the plasma samples from group D (mean Ct = 24.56; SD = 2.08) and group E (mean Ct = 25.59; SD = 1.65; supplemental Figure 7; for additional studies, see supplemental Material; supplemental Figure 8). The fact that miR-16 levels were not significantly different between cytogenetic subgroups (as determined by FISH; data not shown) further confirms the stability of miR-16 in plasma samples and its use as a plasma normalizer.
Relationship between plasma miR-155 levels and response to treatment and OS
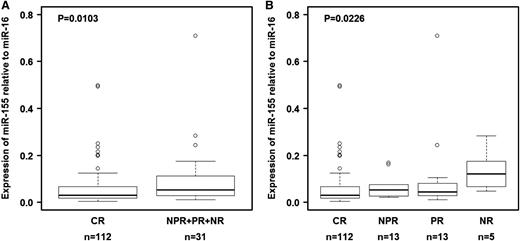
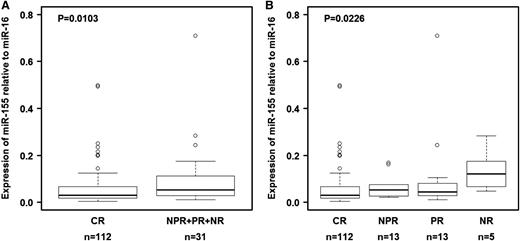
We first measured the expression of miR-155 in plasma samples collected the start of therapy from 143 patients with CLL who received initial treatment with FCR chemoimmunotherapy (group C; Table 2). Response data were available, and the long-term follow-up (median, 83 months) allowed us to explore clinical correlations with pretreatment miR-155 levels. miR-155 expression did not correlate with disease stage, absolute leukocyte count, or tumor burden before initiation of treatment (data not shown). We found that the relative expression levels of miR-155 before therapy were significantly lower in patients who experienced CR than in those who experienced poorer treatment responses either when compared with all groups together (NPR + PR + NR; P = .0103 by Wilcoxon test; Figure 2A) or with individual groups (Figure 2B). This pattern was not found for miR-21 amplified in the same experiment (supplemental Table 4).
Relationship between relative miR-155 expression levels in plasma and response to therapy in group C. (A) Relative expression levels of miR-155 in plasma were lower in patients treated with fludarabine, cyclophosphamide, and rituximab who experienced a complete response than in patients who experienced other treatment outcomes. (B) Relative expression levels of miR-155 in plasma according to type of response. Raw data for all plasma samples are shown in supplemental Table 4. CR, complete response; NPR, nodular partial response; NR, no response; PR, partial response. In panel B, the P value was calculated using the Kruskal-Wallis test.
Relationship between relative miR-155 expression levels in plasma and response to therapy in group C. (A) Relative expression levels of miR-155 in plasma were lower in patients treated with fludarabine, cyclophosphamide, and rituximab who experienced a complete response than in patients who experienced other treatment outcomes. (B) Relative expression levels of miR-155 in plasma according to type of response. Raw data for all plasma samples are shown in supplemental Table 4. CR, complete response; NPR, nodular partial response; NR, no response; PR, partial response. In panel B, the P value was calculated using the Kruskal-Wallis test.
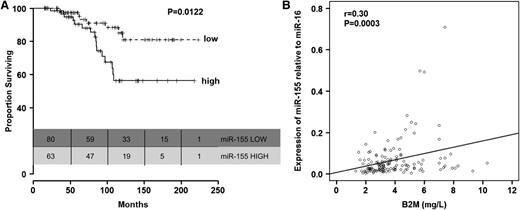
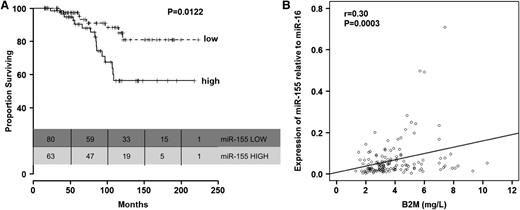
Furthermore, we found that patients with high miR-155 levels before treatment had significantly shorter OS than patients with lower levels of miR-155 (P = .012, Figure 3A; Table 3). This was also observed when the analyses were restricted to the 112 patients from group C with CR (supplemental Figure 9). We did not find significant differences in age between patients expressing high levels of miR-155 and those expressing low levels of miR-155 (P = .077, Mann-Whitney-Wilcoxon test). Other than a correlation between high relative expression levels of miR-155 (r = 0.30; P = .0003; Figure 3B) and elevated B2M levels, no correlations were found between miR-155 relative expression levels and other prognostic factors included in Table 2 (data not shown). Interestingly, the OS disadvantage for patients expressing high levels of miR-155 before treatment with FCR was identified even when patients were stratified according to response to therapy.
Relationship between relative miR-155 expression levels in plasma and overall survival in patients in group C. (A) Kaplan-Meier survival curves according to relative expression levels of miR-155 in plasma (low, up to 56th percentile; high, above 56th percentile). (B) Correlation between plasma levels of miR-155 and serum B2M levels.
Relationship between relative miR-155 expression levels in plasma and overall survival in patients in group C. (A) Kaplan-Meier survival curves according to relative expression levels of miR-155 in plasma (low, up to 56th percentile; high, above 56th percentile). (B) Correlation between plasma levels of miR-155 and serum B2M levels.
For exploratory purposes, a multivariate Cox proportional hazards model was fitted, including IgHV, Rai, and relative miR-155 expression as a continuous variable. The cytogenetic abnormalities determined by FISH were significantly correlated with OS in the univariate analysis; however, about half of the patients had missing FISH data, and therefore FISH results could not be included in the multivariate analysis. The multivariate analysis indicated that increased relative miR-155 expression as a continuous variable was associated with decreased OS (hazard ratio [HR] = 52.43; P = .027) after adjusting for the effects of Rai stage (HR = 1.18; P = .73) and IgHV (HR = 2.3; P = 1.4; Table 3). When we compared miR-155 expression among groups with the individual FISH categories, significant difference was detected using the Wilcoxon rank-sum test (P = .021), with the highest levels seen in the 17p deletion category (supplemental Figure 10), further indirectly supporting the association with survival.
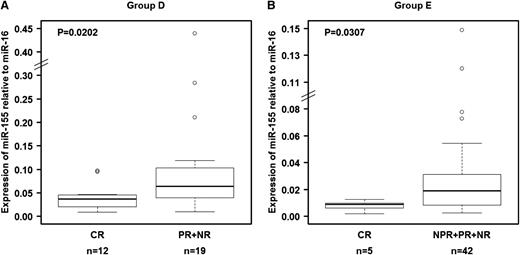
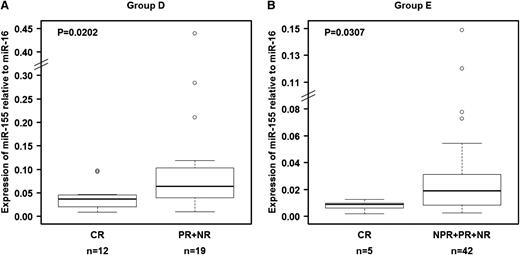
The ability of miR-155 to predict response to therapy was confirmed in a separate group of 31 patients treated with FCR chemoimmunotherapy at a time of recurrent disease (group D; Table 2). We confirmed that pretreatment relative miR-155 expression levels in plasma were significantly lower (P = .0202) in patients who experienced CR than in those who experienced poorer treatment response (Figure 4A). When we analyzed plasma samples collected before treatment with single-agent lenalidomide of 54 patients (group E; Table 2),37,38 we found that relative expression levels of miR-155 were also significantly lower (P = .0303) in patients who experienced CR than in patients who experienced other responses (Figure 4B), confirming the findings observed in the other patient groups. These data validate the ability of miR-155 to predict response to treatment independent of the type of therapy administered.
Relationship between relative miR-155 expression levels in plasma and response to treatment in patients in groups D and E. Relative expression levels of miR-155 in plasma were significantly higher in patients who achieved a complete response than in patients who experienced other types of clinical responses. (A) Patients who received fludarabine, cyclophosphamide, and rituximab as salvage therapy (group D). (B) Patients treated with lenalidomide (group E). The miRNA expression levels were unavailable for 7 patients (“Materials and methods”). Raw data for all plasma samples are shown in supplemental Table 4.
Relationship between relative miR-155 expression levels in plasma and response to treatment in patients in groups D and E. Relative expression levels of miR-155 in plasma were significantly higher in patients who achieved a complete response than in patients who experienced other types of clinical responses. (A) Patients who received fludarabine, cyclophosphamide, and rituximab as salvage therapy (group D). (B) Patients treated with lenalidomide (group E). The miRNA expression levels were unavailable for 7 patients (“Materials and methods”). Raw data for all plasma samples are shown in supplemental Table 4.
Discussion
In this manuscript, we report for the first time 2 significant observations about miR-155 expression in patients with CLL: increasingly higher expression of miR-155 with progression from normal B cells to MBL to overt CLL, and miR-155 overexpression in the plasma as a predictor of poor response to therapy. Of 4 selected genes, only miR-155 expression was reproducibly expressed in an increasing fashion, where expression in normal B cells is the same or lower than that in MBL B cells, which is the same or lower than that in CLL B cells. Given this finding, miR-155 expression levels could be used to prospectively follow individuals with MBL over time to predict which cases of MBL will progress to overt CLL. If proven to be reliable as a predictor for progression, miR-155 levels could assist in counseling patients with MBL who are concerned about whether their disease will progress to CLL.
The data presented here also indicate that plasma level of miR-155 may have value as predictor of response to treatment and OS in patients with CLL who are initiating treatment. In 3 separate cohorts, we found that patients with CLL with reduced expression levels of miR-155 in plasma had increased OS, even when stratified for response to therapy. In addition, both previously untreated and relapsed patients with lower expression of miR-155 were more likely to experience complete response to treatment compared with patients with higher miR-155 expression. These findings indicate that plasma level of miR-155 can be used as predictive marker to identify patients who are less likely to experience a complete response. It is possible that miR-155 expression is regulated by transcription factors important for CLL evolution and that miR-155 also directly regulates other coding genes involved in the transition from MBL to CLL and progression of CLL from early to advanced Rai stages. Additional genome-wide profiling of non-coding RNA could identify other genes with prognostic information.
The use of plasma instead of malignant cells for miRNA profiling offers several advantages. First, plasma is easily accessible, and performing RNA extraction on plasma samples for measurement of miRNAs is technically quick and easy to implement in CLIA-compliant laboratories specialized in assay development. Second, recent reports have proposed that miRNAs are hormones released by a donor cell and that miRNAs spread signals that influence cells located in other parts of the organism.31 Indeed, we found that miR-155 was present in circulating plasma MVs purified from patients with CLL. Therefore, miRNA profiling in plasma could reflect more accurately the complex interrelationships that facilitate the proliferation of malignant B cells.34 In support of this, we observed in our previously published study14 that the levels of miR-155 in cells of patients with CLL with 17p deletion or with normal FISH results and normal cytogenetic findings did not correlate with OS, meaning that the plasma pool of miR-155 molecules likely has various cellular sources. Furthermore, the pool of malignant cells is often reduced during and after therapy, whereas plasma is likely to continue to reflect abnormal gene profiles at these times.33 In line with this, a recent study showed that extracellular miRNAs are present in the plasma of patients with CLL at levels significantly different from healthy controls, with significant differences in miRNA expression observed between ZAP70-positive and ZAP70-negative patients. In addition, miRNA expression levels correlated reliably with the time from diagnosis to treatment.39 Expression of miR-155 in vitro was shown to significantly increase after stimulation of distinct toll-like receptors in CLL cells in which fludarabine treatment was less effective.40 Of interest, although in the “paired” cell/plasma samples of CLL, miR-16 varied according to 13q deletion status in B cells, we demonstrated that the gene can be used as a normalizer in plasma as a result of constant expression. This can be explained by the fact that multiple types of blood cells could secrete this miR-16 in addition to malignant cells.33,34
In conclusion, our study identified miR-155 as a useful marker and highlights its potential to recognize cases of MBL that may progress to overt CLL and patients with CLL that are less likely to respond well to therapy. Prospective assessment of miR-155 levels in individuals with MBL and in patients with CLL who are undergoing treatment, as well as interrogation of a full spectrum of miR-155 targets in CLL B cells, will provide useful insights into the biology of CLL.
The online version of this article contains a data supplement.
The publication costs of this article were defrayed in part by page charge payment. Therefore, and solely to indicate this fact, this article is hereby marked “advertisement” in accordance with 18 USC section 1734.
There is an Inside Blood commentary on this article in this issue.
Acknowledgments
The authors thank Erica Goodoff (Department of Scientific Publications, The University of Texas MD Anderson Cancer Center) for the English editing of this manuscript.
This research was partially supported by grant P01-CA81534 and the CLL Research Consortium (to L.Z.R. and T.J.K.). G.A.C. is supported in part by the National Institutes of Health, National Cancer Institute, the Department of Defense, a Developmental Research Award in Leukemia Specialised Programs of Research Excellence, a Sister Institution Network Fund grant in CLL, the Laura and John Arnold Foundation, the RGK Foundation, the Estate of C. G. Johnson Jr. N.E.K. is the recipient of National Cancer Institute research award CA95241 and support from the CLL Research Consortium and the CLL Global Foundation.
Authorship
Contribution: Study concept and design: A.F., T.D.S., M.J.K., N.E.K., and G.A.C.; acquisition of data: A.F., M.S., N.N., M.I., S.L., L.Z.R., J.M.R., S.C., M.J.Y., A.K.G., J.T.M., W.G.W., Z.E., S.O., T.J.K., M.J.K., and G.A.C.; analysis and interpretation of data: A.F., T.D.S., M.J.K., N.E.K., and G.A.C.; statistical analysis: C.I., K.G.R., L.X., and J.H.; administrative, technical, or material support: M.S. and S.L.; drafting of the manuscript: A.F., T.D.S., C.I., N.E.K., and G.A.C.; and all authors critically reviewed the manuscript and approved the final version.
Conflict-of-interest disclosure: The authors declare no competing financial interests.
Correspondence: George A. Calin, Department of Experimental Therapeutics, Unit 1950, The University of Texas MD Anderson Cancer Center, 1515 Holcombe Blvd, Houston, TX 77030; e-mail gcalin@mdanderson.org; and Neil E. Kay, Hematology Research/ ST 628, Mayo Clinic, 200 First St SW, Rochester, MN 55905; e-mail: kay.neil@mayo.edu.
References
Author notes
A.F., T.D.S., and C.I. contributed equally to this study.

