Abstract
Primary cutaneous lymphomas (PCLs) are clonal T- or B-cell neoplasms, which originate in the skin. In recent years, mast cells were described as regulators of the tumor microenvironment in different human malignancies. Here, we investigated the role of mast cells in the tumor microenvironment of PCL. We found significantly increased numbers of mast cells in skin biopsies from patients with cutaneous T-cell lymphoma (CTCL) and cutaneous B-cell lymphoma (CBCL). Mast cell infiltration was particularly prominent in the periphery, at lymphoma rims. Interestingly, CTCL and CBCL patients with a progressive course showed higher mast cell counts than stable patients, and mast cell numbers in different stages of CTCL correlated positively with disease progression. In addition, mast cell numbers positively correlated with microvessel density. Incubating primary CTCL cells with mast cell supernatant, we observed enhanced proliferation and production of cytokines. In line with our in vitro experiments, in a mouse model of cutaneous lymphoma, tumor growth in mast cell–deficient transgenic mice was significantly decreased. Taken together, these experiments show that mast cells play a protumorigenic role in CTCL and CBCL. Our data provide a rationale for exploiting tumor-associated mast cells as a prognostic marker and therapeutic target in PCL.
Introduction
Primary cutaneous lymphomas (PCLs) are clonal lymphoid neoplasms, which belong to the group of extranodal non-Hodgkin lymphomas.1-3 The annual incidence of PCL is estimated at 1/100 000.2 PCLs consist of cutaneous T-cell lymphomas (CTCLs), cutaneous B-cell lymphomas (CBCLs) and some rare categories. The most common subtypes of CTCL include mycosis fungoides (MF), Sézary syndrome (SS), and lymphomatoid papulosis (LP), whereas CBCLs are subdivided into primary cutaneous marginal zone B-cell lymphoma (MZL), primary cutaneous follicle center lymphoma (CFBCL) and primary cutaneous diffuse large B-cell lymphoma (BCL). Clinical manifestation and prognosis of PCLs are highly variable and depend on the subtype and stage of the disease. For example, early stages of MF are characterized by eczematous skin lesions resulting from inflammation associated with proliferation of malignant cells in the epidermis. More advanced stages of MF show intradermal tumors, which arise from poorly differentiated subclones of malignant cells that spread into deeper layers of the skin and later into peripheral blood, lymph nodes, and internal organs. In these advanced stages, conventional therapies can achieve only short-term clinical responses and median survival is less than 3 years. The prognosis is even worse in patients with SS, the leukemic variant of CTCL. In contrast, most patients with CBCL show stable nodular lesions associated with an indolent course.
In a large variety of cancers, immune cells of the tumor microenvironment have been demonstrated to play crucial roles in tumor biology.4 In particular, tumor-associated macrophages, myeloid-derived suppressor cells (MDSCs) and T regulatory cells (Tregs) participate in the development of tumors by regulating various hallmarks of cancer, including proliferation, angiogenesis, immunomodulation, and tissue remodeling. In PCL, functional interactions between neoplastic cells and their microenvironment are largely unknown. Involvement of immune cells is suggested by elevated levels of inflammatory cytokines in plasma and skin sections of CTCL patients, such as IL-1β, IL-7, IL-15, IL-17, IL-18, and IL-23.5,6 A recent study using a mouse model of CTCL reported on increased numbers of macrophages and neutrophils, and showed that tumor growth was reduced after depletion of macrophages.7
Mast cells are bone marrow–derived hematopoietic cells that are preferentially located in tissues exposed to the environment, such as skin, airways, and gastrointestinal tract.8,9 Because of this location, they are one of the first immune cells to interact with invading pathogens or antigens. After activation, mast cells exert their biologic functions by releasing preformed as well as de novo synthesized mediators including histamine, proteases, numerous cytokines, and chemokines. The best-characterized activation pathway is their activation through immunoglobulin (Ig)E, produced during parasite infections and allergic processes, which binds to the high affinity IgE receptor FcϵRI. In addition, a large variety of other immunologic and nonimmunologic signals can induce mast cell activation.
Recent studies demonstrate that mast cells also serve as critical regulators of the tumor microenvironment.10,11 In many types of solid cancers and hematologic malignancies, the number of mast cells within the stroma is increased.12-22 Mast cell counts often correlate with tumor stage, prognosis, and invasiveness, suggesting a protumorigenic role of mast cells in these malignancies.12-19 In other tumors, mast cells rather exert antitumorigenic activity, for example by supporting cancer rejection,20-22 or even show plasticity with beneficial and detrimental effects in the same cancer entity depending on the tumor stage.12 These complex functions of mast cells in tumor biology may in part be related to the differential release of mediators, whose specific effects on tumor growth are still poorly understood.
Therefore, in this study, we sought to explore the role of mast cells in PCL. Here, we show for the first time that mast cells are increased in human CTCL and CBCL and correlate with progression of CTCL. In vitro, mast cells are able to stimulate proliferation and cytokine release of CTCL cells. Using a new Cre-transgenic mouse model,23,24 we confirm the essential contribution of mast cells to development of cutaneous lymphomas.
Methods
Patients and tissue samples
Cutaneous biopsies were obtained from 43 patients with PCL for diagnostic purposes. All patients had attended the PCL clinic of the Department of Dermatology, University of Cologne, Cologne, Germany, between 1995 and 2010. The diagnosis of PCL and assignment to disease categories and subtypes according to the World Health Organization/European Organization for Research and Treatment of Cancer (WHO/EORTC) classification was based on established criteria.1,3 In addition, assignment to subtypes of PCL was confirmed by a histopathologic reference center for PCL (Kempf and Pfaltz, Laboratory for Histological Diagnostics, Zurich, Switzerland). Of the 43 patients, 35 patients (81.4%) were diagnosed with CTCL and 8 patients (18.6%) with CBCL. Detailed clinical characteristics of all patients are listed in supplemental Table 1 (available on the Blood Web site; see the Supplemental Materials link at the top of the online article). For control, 12 biopsies from subjects with normal skin and 24 biopsies from patients with inflammatory cutaneous diseases, namely 8 patients with psoriasis, 8 patients with atopic dermatitis, and 8 patients with pseudolymphoma, obtained for diagnostic purposes, were used. All procedures were approved by the Institutional Ethics Committee of the University of Cologne, Cologne, Germany, under written, informed patient consent, and adherence to the Declaration of Helsinki (AZ 08-144).
Patients were grouped according to the International Society for Cutaneous Lymphomas (ISCL)/EORTC classification.25,26 In addition, to also reflect the clinical course of PCL, we divided patients into those with stable or progressive disease, defining stable disease as maximally 2 topical treatments (eg, UV irradiation, topical corticosteroids) and progressive disease as 3 or more topical and systemic treatments (eg, UV irradiation, topical corticosteroids, surgery, systemic therapy, such as bexarotene or interferon alpha). Progression-free survival, defined as time span from initial diagnosis until first change of systemic therapy because of disease progression was recorded for a timespan of 30 years. For Kaplan-Meier curves, the event criterion was defined as > 100 mast cells/mm2.
Histology and immunohistochemistry
For analysis of mast cells in human PCL, sections of paraffin-embedded cutaneous biopsies from patients with PCL and control subjects with normal skin and inflammatory cutaneous diseases were evaluated by immunohistochemistry with antibody against mast cell tryptase (pretreatment with 0.1% protease, staining with 1:3.000 dilution of antibody Dako 7052, Dako). Evaluation of skin sections was performed by counting the number of tryptase-positive mast cells under a Leica microscope (DM4000B; Leica) with Diskus Version 4.50.1638 software (Diskus) at 200× magnification in 5 high power fields. Histologic analysis was carried out by 2 independent observers in a blinded fashion. Counts were used to calculate the mean number of mast cells per mm2. To grade degranulation of mast cells, skin sections were assessed at 400× magnification and mast cells were semiquantitatively classified into 3 groups of not degranulated, moderately degranulated, or extensively degranulated mast cells.24
For evaluation of mast cells in the different mouse models (as described in “Experiments in mice”), punch biopsies of back skin were embedded in paraffin and toluidine blue staining was performed.
For analysis of microvessel density, sections of paraffin-embedded cutaneous biopsies from patients with MF and control patients with inflammatory cutaneous diseases were evaluated by immunohistochemistry with antibody against CD31 (pretreatment with citrate buffer pH 6.0, staining with 1:500 dilution of antibody Dako M0823; Dako). Evaluation of skin sections was performed by recording the distribution of CD31-positive microvessels with a minimal lumen size of 50 μm2 and counting their number under a Leica microscope with Diskus software at 100× magnification in 5 high power fields. Counts were used to calculate the mean number of microvessels per mm2.
For evaluation of microvessel density in the different mouse models (as described in “Experiments in mice”), punch biopsies of back skin were embedded in paraffin and CD31 staining (pretreatment with citrate buffer pH 6.0, staining with 1:50 dilution of antibody Histonova DIA-310; Dianova) was performed.
Cell lines and primary cells
The CTCL cell line Mac2B, originally derived from a patient with CD30+ALCL,27 was kindly provided by Dr Marshall Kadin (Department of Dermatology and Skin Surgery, Boston University School of Medicine, Roger Williams Medical Center, Providence, RI) and maintained in RPMI 1640 medium (1×; Gibco, Invitrogen) containing 20% FBS (Biochrom AG), 2mM l-glutamine (Biochrom AG), 100 U/mL penicillin (Biochrom AG), and 100 μg/mL streptomycin (Biochrom AG). The CTCL cell lines MyLa, derived from a patient with MF,28 and SeAx, derived from a patient with SS,29 as well as the human B-cell lymphoma cell line BJAB30 were kindly provided by Dr Maria Karpova (Department of Dermatology, University Hospital Zurich, Zurich, Switzerland). All 3 cell lines were cultured in RPMI 1640 medium containing 10% FBS, 2mM l-glutamine, 1mM sodium pyruvate (Gibco, Invitrogen), 100 U/mL penicillin, and 100 μg/mL streptomycin. The cell line Jurkat (originally called JM), a pseudodiploid human cell line that originated from a patient with acute T-cell leukemia,31 was cultured as described.31 The mast cell line HMC1, originally derived from a patient with mast cell leukemia, was kindly provided by Dr Joseph H. Butterfield (Mayo Clinic, Rochester, MN) and cultured as described.32 For our experiments, we used the subclone HMC1.2.
To obtain primary Sézary cells, CD4+ T cells from a patient with SS were isolated using the Macs Whole Blood Column Kit for CD4+ T cells (Macs Miltenyi Biotech) and cultured as described.33 In addition, CD4+ T cells from healthy donors were isolated as controls.
For mouse xenograft experiments, we used the mouse T-cell lymphoma cell line EL4, which was kindly provided by A. Gisselsson (Genovis, Malmö, Sweden) maintained in Dulbecco modified Eagle medium (DMEM; 1×, high glucose; Gibco, Invitrogen) containing 10% FBS, 2mM l-glutamine, 1mM sodium pyruvate, 50μM 2-mercaptoethanol (Gibco, Invitrogen), 100 U/mL penicillin, and 100 μg/mL streptomycin.
Primary murine bone marrow–derived mast cells (BMMCs) were isolated from the femoral lavage of wild-type (WT) C57BL/6 mice34 and cultured as previously described.32
All cell cultures were maintained at 37°C in 5% CO2 in a humidified atmosphere.
Inhibition and stimulation of mediator release from mast cells
To either inhibit or stimulate release of mediators from mast cells, 1 × 10⁶ HMC1 cells/mL were incubated with 1 mL cromolyn sodium salt (0.025M; Sigma-Aldrich) in Hanks balanced salt solution (Sigma-Aldrich) or with 1 mL calcium ionophore A23187 (250nM; Sigma-Aldrich) in dimethylsulfoxide (Sigma-Aldrich), respectively, for 30 minutes at 37°C. As control, cells were incubated with standard medium. Then, cells were washed and kept in standard medium for 6 hours. After centrifugation, cell culture supernatant was frozen at −20°C and stored for future use.
Cytometric bead array in cell culture supernatants
For measurement of cytokine and chemokine levels in HMC1 supernatant, cells were either blocked or stimulated as described in the previous paragraph and secretion of IL-2, IL-4, IL-6, IL-10, IL-17A, tumor necrosis factor (TNF), and interferon (IFN)–γ using Human Th1/Th2/Th17 Cytokine kit (BD Bioscience), CXCL8, CCL5, CXCL9, CCL2, and CXCL10 using Human Chemokine kit (BD Bioscience) and vascular endothelial growth factor (VEGF), basic fibroblast growth factor (FGF), and transforming growth factor (TGF)–β1 using Human Flex Sets (BD Biosciences) was measured in supernatants by cytometric bead array (CBA) according to the manufacturer's guidelines.
For measurement of cytokine levels in EL4 and BMMC supernatant, 2 × 10⁶ cells/mL were cultured for 1 week under standard conditions (as described in “Cell lines and primary cells”) and secretion of IL-2, IL-4, IL-6, IL-10, IL-17A, TNF, and IFN-γ was measured in supernatants by CBA according to the manufacturer's guidelines (Mouse Th1/Th2/Th17 Cytokine kit; BD Bioscience).
For stimulation experiments, 6 × 10⁵ cells/mL freshly thawed cells were incubated with or without mast cell supernatant. Human cells and cell lines were stimulated for 48 hours with HMC1 supernatant and the mouse cell line EL4 with supernatant of BMMCs. Thereafter, cells were washed, counted, and 5 × 10⁵ cells/mL were cultured again for 48 hours in standard medium. Cell culture supernatants were collected and frozen at −20°C for CBA measurements. In 4 separate experiments, each sample was measured 6 times.
After acquisition of sample data using fluorescence-activated cell sorting (FACS Calibur; BD Bioscience), cytokine and chemokine concentrations were calculated using the proprietary FCAP Version 1.0 analysis software (BD Biosciences).
Quantitative real time-PCR
Mac2B and SeAx cells (6 × 10⁵ cells/mL) were incubated with or without HMC1 supernatant for 24 hours. After washing, 6 × 10⁵ cells/mL were cultured again for 6 hours in standard medium.
Total RNA was extracted from harvested cells with RNeasy mini kit (QIAGEN) and on-column DNAse digestion (RNAse-free DNAse Set; QIAGEN), according to the manufacturer′s instructions. RNA was then reversely transcribed into cDNA using the QuantiTect reverse transcription kit (QIAGEN), according to the manufacturer's instructions. To quantify the amounts of IL-6 mRNA expression, real-time polymerase chain reaction (PCR) was performed using Power SYBR Green PCR Master Mix (Applied Biosystems), according to the manufacturer′s instructions. The following human IL-6 primer sequences were used: forward 5′-GGTACATCCTCGACGGCATCTC-3′, reverse 5′-GTTGGGTCAGGGGTGGTTATTG-3′. GAPDH (glyceraldehyde-3-phosphate dehydrogenase) was used as housekeeping gene with the following primer sequences: forward 5′-CGGAGTCAACGGATTTGGTCGTAT-3′, reverse 5′-AGCCTTCTCCATGGTGGTGAAGAC-3′. Real-time PCR was then performed on a StepOne Plus cycler (Applied Biosystems) using the following cycling profile: 95°C for 10 minutes, 40 cycles of 95°C for 15 seconds, and 60°C for 1 minute, followed by a melting curve analysis to prove the specificity of the PCR product by 95°C for 15 seconds, 60°C for 1 minute, and 95°C for 15 seconds. Gene expression was determined by normalization against GAPDH expression using the ΔΔCT method. In 4 separate experiments, each sample was measured 3 times.
Cell proliferation measurement
Primary Sézary cells, primary T-cells, CTCL cell lines, Jurkat cells, and EL4 cells were cultured with and without mast cell supernatant for 80 hours. As a positive control, cells were also cultured with a cytokine cocktail containing IL-1α, IL-1β, IL-2, IL-4, and IL-7 (Peprotech), described to stimulate cell growth. In addition, SeAx and Mac2B cell lines were cultured with mast cell supernatant derived from HMC1 cells blocked by cromolyn as described in “Inhibition and stimulation of mediator release from mast cells.” Cell proliferation was measured at 4 hour intervals using the Cell Titer 96 AQueous One Solution assay (Promega).
Experiments in mice
To investigate the role of mast cells in tumor growth, we used a xenograft lymphoma model7 in transgenic mast cell–deficient Mcpt5-Cre+/iDTR+ mice24 and C57BL/6 KitW-sh/W-sh mice.34 At the age of 6 weeks, Mcpt5-Cre+/iDTR+ and Mcpt5-Cre−/iDTR+ controls initially received 4 intraperitoneal injections of 25 ng diphtheria toxin (DT; Sigma Aldrich)/g bodyweight at weekly intervals to deplete mast cells. Ten-week-old Mcpt5-Cre+/iDTR+, Mcpt5-Cre−/iDTR+, C57BL/6 KitW-sh/W-sh, and WT C57BL/6 animals received 100 μL of 1 × 10⁷ EL4 cells/mL (1 × 10⁶ cells/mouse) subcutaneously into the shaved flanks. Subsequently, tumor size was assessed 5 times weekly by direct measurement of the tumor region in 3 perpendicular directions using a Mitutoyo Quick Mini caliper (Mitutoyo). Measurements were recorded as tumor area (mm2) and tumor volume (mm3) from groups of 2 to 3 mice each with 2 tumors per mouse. Tumor area (A) was calculated by the formula: [A = tumor height × tumor width], and tumor volume (V) by the formula: [V = tumor height × tumor width × tumor depth]. During tumor experiments, Mcpt5-Cre+/iDTR+ mice and Mcpt5-Cre−/iDTR+ controls continued to receive injections with DT (80 μL) subcutaneously around the tumors once weekly to sufficiently deplete mast cells. Experiments were terminated after 14 days and cutaneous punch biopsies were taken from tumor regions. Mice were kept in a pathogen-free barrier facility. All procedures were performed in accordance with institutional guidelines on animal welfare and were approved by the “Landesamt fuer Natur, Umwelt und Verbraucherschutz” of North Rhine-Westphalia (AZ K23, 24/06).
Statistical analysis
Statistical analysis was performed with GraphPad Prism Version 5.01 software using unpaired Student t test. Clinical data were analyzed as Kaplan-Meier curves using Log-rank test. Correlation analysis was performed using Spearman correlation. A P value of less than .05 was considered statistically significant.
Results
Increased number of mast cells in primary cutaneous lymphoma
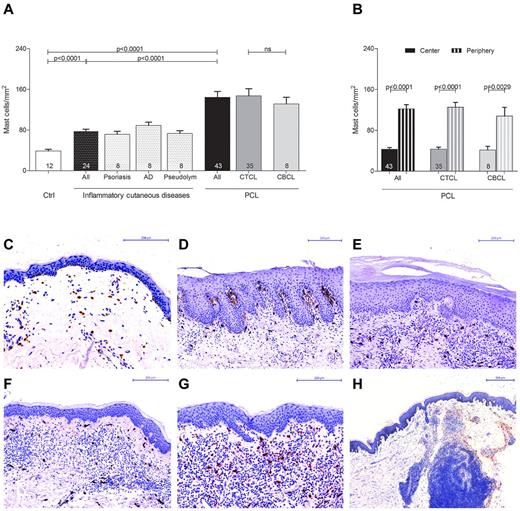
In order to explore the role of mast cells in the tumor microenvironment of PCL, we initially investigated the number and distribution of mast cells in different categories of human PCL (Figure 1, supplemental Figure 1). Skin sections from 43 patients with PCL (supplemental Table 1), consisting of 35 patients with CTCL and 8 patients with CBCL, 12 control subjects with normal skin, and 24 patients with inflammatory cutaneous diseases, such as psoriasis, atopic dermatitis, and pseudolymphoma were stained with anti-tryptase antibody and the number of tryptase-positive mast cells was counted microscopically. As shown in Figure 1A, mast cells were significantly increased in patients with PCL compared with normal skin and inflammatory cutaneous diseases, with a similar increase in CTCL and CBCL. The mean number of mast cells in PCL mounted to an increase of more than 3-fold compared with normal skin and approximately 2-fold compared with inflammatory cutaneous diseases (144.4 ± 11.5 mast cells/mm2 in PCL [All], 38.8 ± 3.5 mast cells/mm2 in normal skin [Ctrl], 78.0 ± 3.6 mast cells/mm2 in inflammatory cutaneous diseases [All], mean ± SEM). Interestingly, in nearly all CTCL and CBCL sections, infiltration of mast cells was particularly prominent at the periphery of the infiltrate (Figure 1B). Often, mast cells were found to even align along the rim of the infiltrate (Figure 1H). In contrast, the number of mast cells in the center of CTCL and CBCL was comparable with normal skin. When we compared different subtypes of CTCL and CBCL, even though for some rare subtypes only few samples were available, the CTCL subtypes folliculotropic MF (FMF) and SS appeared to exhibit the most pronounced mast cell infiltration (supplemental Figure 1). Clinically, both of these subtypes are characterized by a highly progressive course.
Increased number of mast cells in PCL. (A) Skin biopsies from patients with PCL (All; n = 43) subdivided into patients with CTCL (n = 35) and CBCL (n = 8), from subjects with normal skin (Ctrl; n = 12) and from patients with inflammatory cutaneous diseases (All; n = 24), such as psoriasis (n = 8), atopic dermatitis (AD; n = 8) and pseudolymphoma (Pseudolym; n = 8) were stained by immunohistochemistry with anti-tryptase antibody. The number of tryptase-positive mast cells was analyzed by microscopic counting of 5 high power fields at 200× magnification and calculating the mean number of mast cells per mm2. Data represent the mean ± SEM. Statistical significance was assessed by 2-tailed Student t test. (B) The number of tryptase-positive mast cells was counted separately in the center (filled columns) and in the periphery (striped columns) of PCLs. Data represent the mean ± SEM. Statistical significance was assessed by 2-tailed Student t test. (C) Normal skin, magnification 200×. (D) Psoriasis, magnification 150×. (E) Atopic dermatitis, magnification 150×. (F) Pseudolymphoma, magnification 150×. (G) CTCL, plaque stage, magnification 200×. (H) CTCL, tumor stage, magnification 50×, staining of mast cells with anti-tryptase antibody (brown).
Increased number of mast cells in PCL. (A) Skin biopsies from patients with PCL (All; n = 43) subdivided into patients with CTCL (n = 35) and CBCL (n = 8), from subjects with normal skin (Ctrl; n = 12) and from patients with inflammatory cutaneous diseases (All; n = 24), such as psoriasis (n = 8), atopic dermatitis (AD; n = 8) and pseudolymphoma (Pseudolym; n = 8) were stained by immunohistochemistry with anti-tryptase antibody. The number of tryptase-positive mast cells was analyzed by microscopic counting of 5 high power fields at 200× magnification and calculating the mean number of mast cells per mm2. Data represent the mean ± SEM. Statistical significance was assessed by 2-tailed Student t test. (B) The number of tryptase-positive mast cells was counted separately in the center (filled columns) and in the periphery (striped columns) of PCLs. Data represent the mean ± SEM. Statistical significance was assessed by 2-tailed Student t test. (C) Normal skin, magnification 200×. (D) Psoriasis, magnification 150×. (E) Atopic dermatitis, magnification 150×. (F) Pseudolymphoma, magnification 150×. (G) CTCL, plaque stage, magnification 200×. (H) CTCL, tumor stage, magnification 50×, staining of mast cells with anti-tryptase antibody (brown).
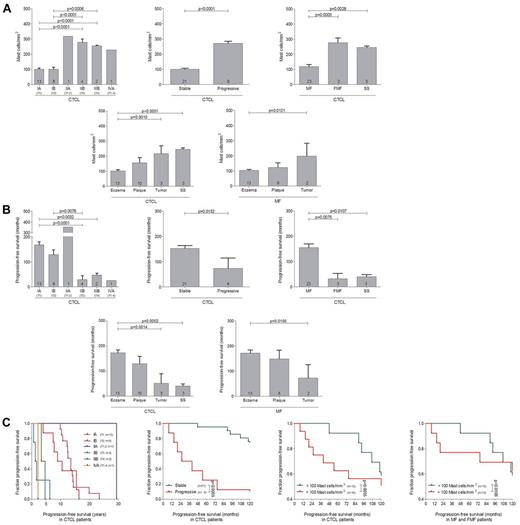
Numbers of mast cells correlate with progression of primary cutaneous lymphoma
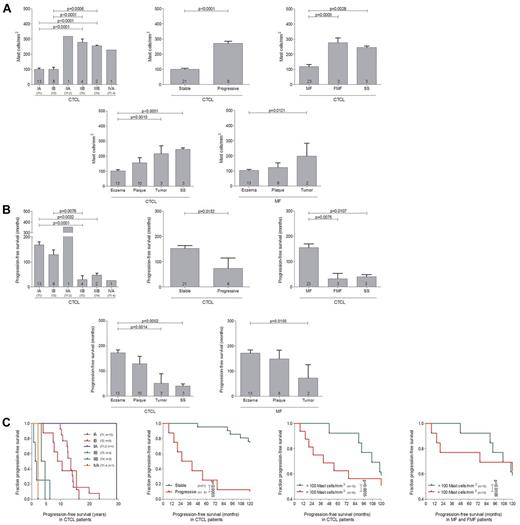
To investigate whether progression of CTCL correlates with the number of mast cells, patients with MF, FMF, and SS were grouped according to the ISCL/EORTC classification and, additionally, by the clinical course into patients with stable or progressive disease (Figure 2A, supplemental Table 1). Patients exhibiting more advanced stages of the disease (IIB-IVA; 278.5 ± 21.7 mast cells/mm2 in stage IIB; 254.8 ± 4.7 mast cells/mm2 in stage IIIB; 227.8 mast cells/mm2 in stage IVA; mean ± SEM) showed significantly increased numbers of mast cells compared with patients with stages IA (100.9 ± 7.7 mast cells/mm2; mean ± SEM) to IB (100.2 ± 13.6 mast cells/mm2; mean ± SEM; Figure 2 A). Similarly, patients with progressive disease showed increased mast cell numbers compared with stable patients (271.2 ± 13.7 mast cells/mm2 in progressive, 100.7 ± 6.8 mast cells/mm2 in stable patients, mean ± SEM). We also determined progression-free survival and found, as anticipated, that patients with advanced disease stages as well as progressive disease showed a significantly decreased progression-free survival compared with stable patients (Figure 2B). In accordance, patients with the progressive CTCL subtypes FMF and SS showed significantly increased numbers of mast cells compared with MF patients (Figure 2A) and a decreased progression-free survival (Figure 2B). Similarly, dividing CTCL patients into clinically relevant groups exhibiting eczema (mild), plaque (moderate), or tumor (moderate/severe) stages or SS (severe), a significant increase in mast cell numbers was observed correlating with the malignancy of CTCL (Figure 2A) and CTCL malignancy was also associated with decreased progression-free survival (Figure 2B). Comparable findings were obtained from a separate analysis of all MF patients subdivided into different disease stages. Furthermore, when CTCL patients with MF, FMF, and SS were subdivided according to the ISCL/EORTC classification, into groups with stable or progressive disease or into groups with < 100 mast cells/mm2 or > 100 mast cells/mm2, the patients with more advanced stages of the disease (IIB-IVA), with progressive disease and with > 100 mast cells/mm2 showed a significantly shorter progression-free survival (Figure 2C).
Numbers of mast cells correlate with progression of PCL. (A) The number of tryptase-positive mast cells was analyzed by microscopic counting of 5 high power fields at 200× magnification in skin biopsies from CTCL patients with MF, FMF, and SS grouped according to ISCL/EORTC classification (IA, n = 13; IB, n = 8; IIA, n = 1; IIB, n = 4; IIIB, n = 2; IVA, n = 1), into patients with stable (n = 21) and progressive (n = 8) disease, into patients with MF (n = 23), FMF, (n = 3) and SS (n = 3), into patients with different clinical stages (Eczema, n = 13; Plaque, n = 10; Tumor, n = 3; SS, n = 3), or into patients with different MF stages (Eczema, n = 13; Plaque, n = 8; Tumor, n = 2). Data represent the mean ± SEM. Statistical significance was assessed by 2-tailed Student t test. (B) Progression-free survival, defined as duration (years, months) from initial diagnosis until first change of treatment because of disease progression, was determined for each group of patients. Data represent the mean ± SEM. Statistical significance was assessed by 2-tailed Student t test. (C) Kaplan-Meier curves were generated for CTCL patients with MF, FMF, and SS grouped according to the ISCL/EORTC classification, into stable and progressive disease, and into < 100 mast cells/mm2 and > 100 mast cells/mm2. In addition, patients with MF and FMF were grouped into those with < 100 mast cells/mm2 and > 100 mast cells/mm2. Statistical significance was assessed by Log-rank test. One patient with stage IIA showed an exceptionally long progression-free survival of more than 30 years (purple line).
Numbers of mast cells correlate with progression of PCL. (A) The number of tryptase-positive mast cells was analyzed by microscopic counting of 5 high power fields at 200× magnification in skin biopsies from CTCL patients with MF, FMF, and SS grouped according to ISCL/EORTC classification (IA, n = 13; IB, n = 8; IIA, n = 1; IIB, n = 4; IIIB, n = 2; IVA, n = 1), into patients with stable (n = 21) and progressive (n = 8) disease, into patients with MF (n = 23), FMF, (n = 3) and SS (n = 3), into patients with different clinical stages (Eczema, n = 13; Plaque, n = 10; Tumor, n = 3; SS, n = 3), or into patients with different MF stages (Eczema, n = 13; Plaque, n = 8; Tumor, n = 2). Data represent the mean ± SEM. Statistical significance was assessed by 2-tailed Student t test. (B) Progression-free survival, defined as duration (years, months) from initial diagnosis until first change of treatment because of disease progression, was determined for each group of patients. Data represent the mean ± SEM. Statistical significance was assessed by 2-tailed Student t test. (C) Kaplan-Meier curves were generated for CTCL patients with MF, FMF, and SS grouped according to the ISCL/EORTC classification, into stable and progressive disease, and into < 100 mast cells/mm2 and > 100 mast cells/mm2. In addition, patients with MF and FMF were grouped into those with < 100 mast cells/mm2 and > 100 mast cells/mm2. Statistical significance was assessed by Log-rank test. One patient with stage IIA showed an exceptionally long progression-free survival of more than 30 years (purple line).
Increased degranulation of mast cells in primary cutaneous lymphoma
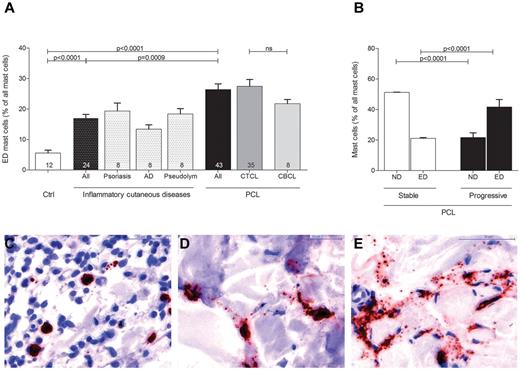
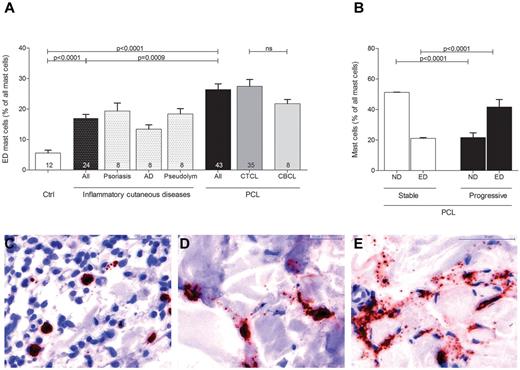
Evaluating mast cell numbers in the different skin sections, we noted at higher magnifications that most mast cells in PCL sections were degranulated, whereas mast cells in normal skin were usually not degranulated (Figure 3). We therefore classified mast cells into 3 groups of not degranulated (Figure 3C), moderately degranulated (Figure 3D) or extensively degranulated (Figure 3E) mast cells24 and determined the percentage of each group in all patients and controls. Patients with PCL showed a significant increase of extensively degranulated mast cells compared with normal skin and inflammatory cutaneous diseases (Figure 3A; 26.4 ± 1.9% extensively degranulated mast cells in PCL [All], 5.6 ± 0.9% extensively degranulated mast cells in normal skin [Ctrl], 17.0 ± 1.2% extensively degranulated mast cells in inflammatory cutaneous diseases [All], mean ± SEM). CTCL and CBCL patients showed a similar increase in extensively degranulated mast cells (Figure 3A). When we compared stable (CTCL, n = 25; CBCL, n = 7) and progressive (CTCL, n = 10; CBCL, n = 1) patients, progressive patients showed significantly more extensively degranulated (ED) mast cells and significantly fewer not degranulated (ND) mast cells (Figure 3B).
Increased degranulation of mast cells in PCL. Degranulation of mast cells stained with anti-tryptase antibody was evaluated semiquantitatively at 200× magnification in skin biopsies from PCL patients, patients with inflammatory cutaneous diseases and control subjects and graded as (C) not degranulated, (D) moderately degranulated, and (E) extensively degranulated. (A) Extensively degranulated (ED) mast cells were counted in 3 high power fields at 200× magnification in skin biopsies from patients with PCL (All; n = 43) subdivided into patients with CTCL (n = 35) and CBCL (n = 8), from subjects with normal skin (Ctrl; n = 12) and from patients with inflammatory cutaneous diseases (All; n = 24), such as psoriasis (n = 8), atopic dermatitis (AD; n = 8), and pseudolymphoma (Pseudolym; n = 8). Results are presented as percentage of ED mast cells of all mast cells and expressed as mean ± SEM. Statistical significance was assessed by 2-tailed Student t test. (B) ND mast cells and ED mast cells were counted in skin biopsies from patients with stable PCL (n = 32) and progressive PCL (n = 11). Data represent the mean ± SEM. Statistical significance was assessed by 2-tailed Student t test.
Increased degranulation of mast cells in PCL. Degranulation of mast cells stained with anti-tryptase antibody was evaluated semiquantitatively at 200× magnification in skin biopsies from PCL patients, patients with inflammatory cutaneous diseases and control subjects and graded as (C) not degranulated, (D) moderately degranulated, and (E) extensively degranulated. (A) Extensively degranulated (ED) mast cells were counted in 3 high power fields at 200× magnification in skin biopsies from patients with PCL (All; n = 43) subdivided into patients with CTCL (n = 35) and CBCL (n = 8), from subjects with normal skin (Ctrl; n = 12) and from patients with inflammatory cutaneous diseases (All; n = 24), such as psoriasis (n = 8), atopic dermatitis (AD; n = 8), and pseudolymphoma (Pseudolym; n = 8). Results are presented as percentage of ED mast cells of all mast cells and expressed as mean ± SEM. Statistical significance was assessed by 2-tailed Student t test. (B) ND mast cells and ED mast cells were counted in skin biopsies from patients with stable PCL (n = 32) and progressive PCL (n = 11). Data represent the mean ± SEM. Statistical significance was assessed by 2-tailed Student t test.
Thus, the number of mast cells and their degranulation is increased in CTCL and CBCL, and this is particularly prominent in progressive forms.
Increased microvessel density in mycosis fungoides
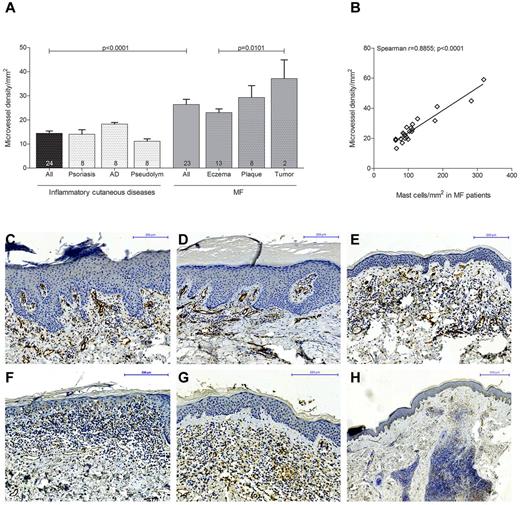
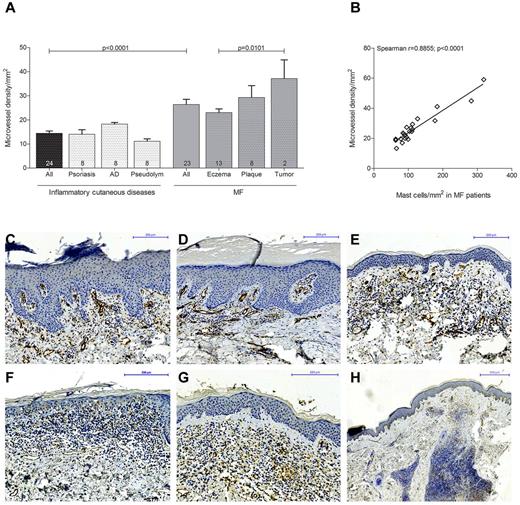
To explore possible effects of mast cell infiltration, we determined microvessel density in MF patients (n = 23) subdivided into eczema, plaque, and tumor stages and in patients with inflammatory cutaneous diseases (Figure 4). Skin sections were stained with anti-CD31 antibody and the number of CD31-positive microvessels was counted microscopically. Microvessel density was significantly increased in MF patients compared with inflammatory cutaneous diseases (Figure 4A; 26.4 ± 2.1% microvessel density/mm2 in MF patients [All], 14.4 ± 0.9% microvessel density/mm2 in inflammatory cutaneous diseases [All], mean ± SEM). Comparing the different MF stages, we found a significantly increased microvessel density in tumor compared with eczema stage (37.2 ± 7.8% microvessel density/mm2 in tumor, 23.0 ± 1.6% microvessel density/mm2 in eczema stage, mean ± SEM). In addition, when we performed correlation analysis, we observed a strong correlation between microvessel density and mast cell numbers in MF patients (Figure 4B; Spearman r = 0.89, P < .0001).
Increased microvessel density in MF. (A) Skin biopsies from patients with MF (All; n = 23) subdivided into MF stages eczema (n = 13), plaque (n = 8), and tumor (n = 2) and from patients with inflammatory cutaneous diseases (All; n = 24) such as psoriasis (n = 8), atopic dermatitis (AD; n = 8), and pseudolymphoma (Pseudolym; n = 8) were stained by immunohistochemistry with anti-CD31 antibody. The number of CD31-positive microvessels (lumen > 50 μm2) was analyzed by microscopic counting of 5 high power fields at 100× magnification and calculating the mean number of microvessels per mm2. Data represent the mean ± SEM. Statistical significance was assessed by 2-tailed Student t test. (B) Microvessel density per mm2 (y-axis) positively correlates with mast cell number per mm2 (x-axis) in MF patients (n = 23; Spearman r = 0.8855; P < .0001). (C) Psoriasis, magnification 150×. (D) Atopic dermatitis, magnification 150×. (E) Pseudolymphoma, magnification 150×. (F) CTCL, eczema stage, magnification 200×. (G) CTCL, plaque stage, magnification 200×. (H) CTCL, tumor stage, magnification 50×, staining of microvessels with anti-CD31 antibody (brown).
Increased microvessel density in MF. (A) Skin biopsies from patients with MF (All; n = 23) subdivided into MF stages eczema (n = 13), plaque (n = 8), and tumor (n = 2) and from patients with inflammatory cutaneous diseases (All; n = 24) such as psoriasis (n = 8), atopic dermatitis (AD; n = 8), and pseudolymphoma (Pseudolym; n = 8) were stained by immunohistochemistry with anti-CD31 antibody. The number of CD31-positive microvessels (lumen > 50 μm2) was analyzed by microscopic counting of 5 high power fields at 100× magnification and calculating the mean number of microvessels per mm2. Data represent the mean ± SEM. Statistical significance was assessed by 2-tailed Student t test. (B) Microvessel density per mm2 (y-axis) positively correlates with mast cell number per mm2 (x-axis) in MF patients (n = 23; Spearman r = 0.8855; P < .0001). (C) Psoriasis, magnification 150×. (D) Atopic dermatitis, magnification 150×. (E) Pseudolymphoma, magnification 150×. (F) CTCL, eczema stage, magnification 200×. (G) CTCL, plaque stage, magnification 200×. (H) CTCL, tumor stage, magnification 50×, staining of microvessels with anti-CD31 antibody (brown).
Supernatant of mast cells induces cytokine release and proliferation of primary cutaneous lymphoma cells in vitro
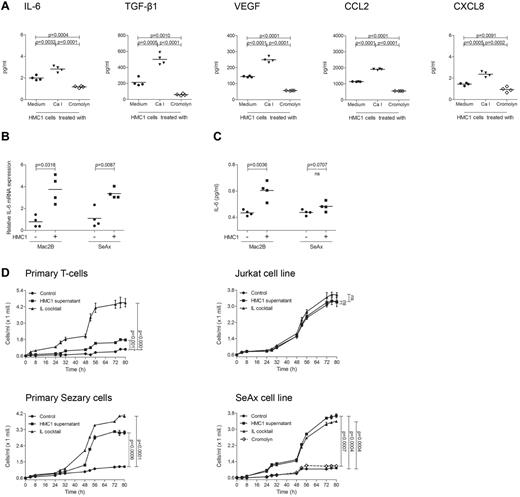
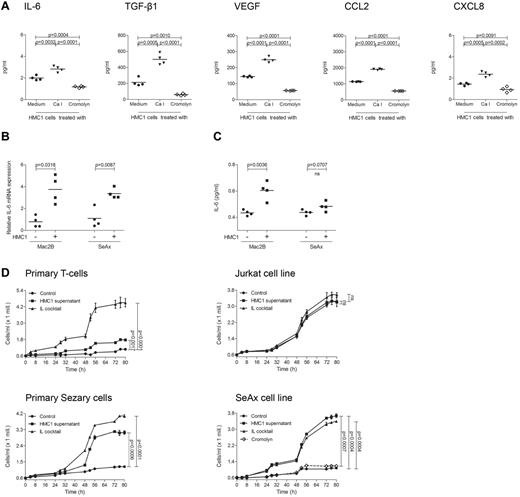
As mast cell infiltration and degranulation within the microenvironment of PCL suggested a tumor-promoting role of mast cells, we next sought to investigate whether mast cells are able to stimulate PCL cells in vitro (Figure 5). To explore the mechanism by which mast cells may promote tumor growth, we used CBA analysis to measure multiple inflammatory cytokines and chemokines (IL-2, IL-4, IL-6, IL-10, IL-17A, TNF, IFN-γ, CXCL8, CCL5, CXCL9, CCL2, CXCL10, VEGF, basic FGF, and TGF-β1) in the supernatant of the human mast cell line HMC1. At baseline, HMC1 cells mainly produced IL-6, TGF-β1, VEGF, CCL2, and CXCL8 (Figure 5A). All these cytokines were induced by treatment with calcium ionophore and inhibited by cromolyn. When we incubated the PCL cell lines Mac2B and SeAx with supernatant of HMC1 cells, we observed a significantly increased production of IL-6 mRNA (Figure 5B) and protein (Figure 5C) in Mac2B cells and SeAx cells.
Supernatant of mast cells induces cytokine release and proliferation of PCL cells. (A) HMC1 cells (1 × 10⁶) were treated with medium (black circles), calcium ionophore A23187 (black triangles) or cromolyn (diamond) for 30 minutes at 37°C, washed and incubated in medium for 6 hours. Mast cell products IL-6, TGF-β1, VEGF, CCL2, and CXCL8 were measured in the supernatants using CBA. Mean data of 4 separate experiments (n = 4) are presented as scatter grams with medians. Statistical significance was assessed by 2-tailed Student t test. (B) Mac2B and SeAx cells were cultured with or without supernatant of HMC1 cells for 24 hours, washed and incubated in medium for 6 hours. IL-6 mRNA levels relative to GAPDH expression were determined using quantitative real-time PCR. Statistical significance was assessed by 2-tailed Student t test. (C) Mac2B and SeAx cells were cultured with or without supernatant of HMC1 cells for 48 hours, washed and incubated in medium for 48 hours. Levels of IL-6 were measured in the supernatant of 5 × 10⁵ cells/mL using CBA. Statistical significance was assessed by 2-tailed Student t test (ns indicates not significant). (D) Primary T-cells, Jurkat cells, primary Sézary cells, and the cell line SeAx were cultured with (HMC1 supernatant) or without (Control) supernatant of HMC1 cells or with a cocktail of several cytokines (IL cocktail; IL-1α, IL-1β, IL-2, IL-4, and IL-7). SeAx cells were additionally cultured with mast cell supernatant derived from HMC1 cells treated with cromolyn (Cromolyn). Proliferation was measured for 80 hours using the Cell Titer 96 AQueous One Solution Assay. Data represent the mean ± SD of 4 separate experiments (n = 4). When error bars are not shown, they were too small to be diagrammed. Statistical significance was assessed by 2-tailed Student t test (ns indicates not significant).
Supernatant of mast cells induces cytokine release and proliferation of PCL cells. (A) HMC1 cells (1 × 10⁶) were treated with medium (black circles), calcium ionophore A23187 (black triangles) or cromolyn (diamond) for 30 minutes at 37°C, washed and incubated in medium for 6 hours. Mast cell products IL-6, TGF-β1, VEGF, CCL2, and CXCL8 were measured in the supernatants using CBA. Mean data of 4 separate experiments (n = 4) are presented as scatter grams with medians. Statistical significance was assessed by 2-tailed Student t test. (B) Mac2B and SeAx cells were cultured with or without supernatant of HMC1 cells for 24 hours, washed and incubated in medium for 6 hours. IL-6 mRNA levels relative to GAPDH expression were determined using quantitative real-time PCR. Statistical significance was assessed by 2-tailed Student t test. (C) Mac2B and SeAx cells were cultured with or without supernatant of HMC1 cells for 48 hours, washed and incubated in medium for 48 hours. Levels of IL-6 were measured in the supernatant of 5 × 10⁵ cells/mL using CBA. Statistical significance was assessed by 2-tailed Student t test (ns indicates not significant). (D) Primary T-cells, Jurkat cells, primary Sézary cells, and the cell line SeAx were cultured with (HMC1 supernatant) or without (Control) supernatant of HMC1 cells or with a cocktail of several cytokines (IL cocktail; IL-1α, IL-1β, IL-2, IL-4, and IL-7). SeAx cells were additionally cultured with mast cell supernatant derived from HMC1 cells treated with cromolyn (Cromolyn). Proliferation was measured for 80 hours using the Cell Titer 96 AQueous One Solution Assay. Data represent the mean ± SD of 4 separate experiments (n = 4). When error bars are not shown, they were too small to be diagrammed. Statistical significance was assessed by 2-tailed Student t test (ns indicates not significant).
To test whether addition of mast cell supernatant also affects proliferation of PCL cells, primary Sézary cells, SeAx cells, and other CTCL cell lines were incubated with supernatant of HMC1 cells and proliferation was measured for 80 hours (Figure 5D, supplemental Figure 2). Mast cell supernatant significantly increased proliferation in Sézary cells and all CTCL cell lines. This increase was often comparable with stimulation with a cocktail of several cytokines used as positive control. Inhibiting HMC1 cells with cromolyn, mast cell supernatant failed to affect proliferation of the CTCL cell lines SeAx (Figure 5D) and Mac2B (supplemental Figure 2). In contrast to the increased proliferation of PCL cells, primary T-cells, and Jurkat cells only showed a limited response to mast cell supernatant (Figure 5D).
Together, these results demonstrate that mast cells can induce cytokine production and proliferation of CTCL cells in vitro. CTCL cells might be more sensitive to mast cell stimulation than primary T-cells.
Decreased growth of EL4 tumors in mast cell–deficient mice
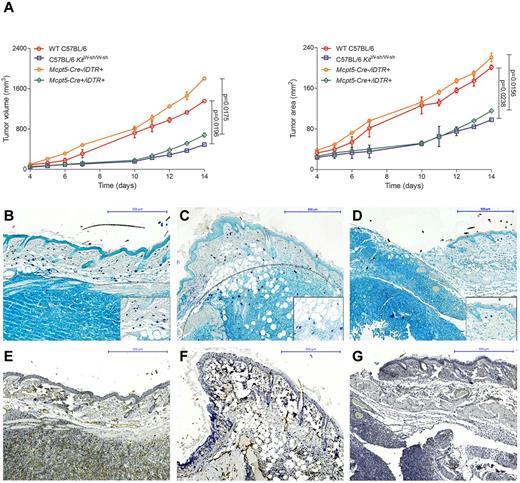
To further analyze the functional role of mast cells in vivo, we evaluated tumor growth in our recently developed mouse model that allows selective depletion of connective tissue mast cells (Figure 6).23,24 Breeding the mast cell–specific transgenic line Mcpt5-Cre to the iDTR line,35 we generated Mcpt5-Cre+/iDTR+ mice that show efficient and specific depletion of cutaneous and peritoneal mast cells after intraperitoneal injections with diphtheria toxin. For comparison, we also analyzed tumor growth in the traditionally used mast cell–deficient C57BL/6 KitW-sh/W-sh line, which shows several other defects in addition to the deficiency of mast cells because of a genetic conversion in the Kit gene promoter. In analogy to a recently published mouse model of CTCL,7 we injected the mouse T-cell lymphoma cell line EL4 subcutaneously in Mcpt5-Cre+/iDTR+, C57BL/6 KitW-sh/W-sh, and control mice. Tumor volume and area were significantly decreased in the mast cell–deficient Mcpt5-Cre+/iDTR+ and C57BL/6 KitW-sh/W-sh mice compared with the Mcpt5-Cre−/iDTR+ and WT C57BL/6 controls (Figure 6A). Histologically, EL4 tumors in WT C57BL/6 (Figure 6B) and Mcpt5-Cre−/iDTR+ (Figure 6C) controls were characterized by marked accumulation of mast cells along the tumor rim, similar to the mast cell infiltration in human CTCL (Figure 1G-H). In contrast, a smaller tumor infiltrate and only few mast cells were found in mast cell–deficient Mcpt5-Cre+/iDTR+ mice (Figure 6D). Subcutaneous injection of 2 other cell lines (Pan02, LLC) showed comparable results (data not shown).
Decreased growth of EL4 tumors in mast cell–deficient mice. (A) Cells (1 × 10⁶) of the murine T-cell lymphoma cell line EL4 were injected subcutaneously into the flanks of mast cell–deficient Mcpt5-Cre+/iDTR+ and C57BL/6 KitW-sh/W-sh mice as well as Mcpt5-Cre−/iDTR+ and WT C57BL/6 control mice and (left) tumor volume and (right) tumor area were assessed for 14 days using a Mitutoyo Quick Mini caliper. Data represent the mean ± SD of 4 to 6 tumors (n = 4, C57BL/6 KitW-sh/W-sh and WT C57BL/6 mice; n = 6, Mcpt5-Cre+/iDTR+ and Mcpt5-Cre−/iDTR+). When error bars are not shown, they were too small to be diagrammed. Statistical significance was assessed by 2-tailed Student t test. (B) WT C57BL/6, skin biopsy of EL4 tumor at day 14, magnification 100×. (C) Mcpt5-Cre−/iDTR+, EL4 tumor, magnification 100×. (D) Mcpt5-Cre+/iDTR+, EL4 tumor, magnification 100×. Toluidine blue staining, mast cells (purple), margin of tumor is marked with gray dotted line. Inserts show mast cells at 400× magnification. (E) WT C57BL/6, skin biopsy of EL4 tumor at day 14, magnification 100× (F) Mcpt5-Cre−/iDTR+, EL4 tumor, magnification 100× (G) Mcpt5-Cre+/iDTR+, EL4 tumor, magnification 100×, CD31 staining.
Decreased growth of EL4 tumors in mast cell–deficient mice. (A) Cells (1 × 10⁶) of the murine T-cell lymphoma cell line EL4 were injected subcutaneously into the flanks of mast cell–deficient Mcpt5-Cre+/iDTR+ and C57BL/6 KitW-sh/W-sh mice as well as Mcpt5-Cre−/iDTR+ and WT C57BL/6 control mice and (left) tumor volume and (right) tumor area were assessed for 14 days using a Mitutoyo Quick Mini caliper. Data represent the mean ± SD of 4 to 6 tumors (n = 4, C57BL/6 KitW-sh/W-sh and WT C57BL/6 mice; n = 6, Mcpt5-Cre+/iDTR+ and Mcpt5-Cre−/iDTR+). When error bars are not shown, they were too small to be diagrammed. Statistical significance was assessed by 2-tailed Student t test. (B) WT C57BL/6, skin biopsy of EL4 tumor at day 14, magnification 100×. (C) Mcpt5-Cre−/iDTR+, EL4 tumor, magnification 100×. (D) Mcpt5-Cre+/iDTR+, EL4 tumor, magnification 100×. Toluidine blue staining, mast cells (purple), margin of tumor is marked with gray dotted line. Inserts show mast cells at 400× magnification. (E) WT C57BL/6, skin biopsy of EL4 tumor at day 14, magnification 100× (F) Mcpt5-Cre−/iDTR+, EL4 tumor, magnification 100× (G) Mcpt5-Cre+/iDTR+, EL4 tumor, magnification 100×, CD31 staining.
Supernatant of murine mast cells induces cytokine release and proliferation of EL4 cells in vitro
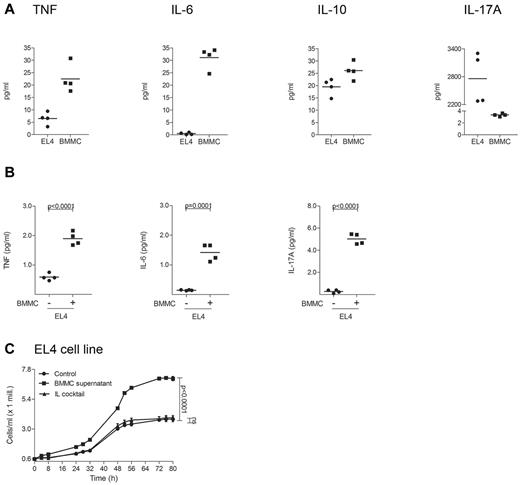
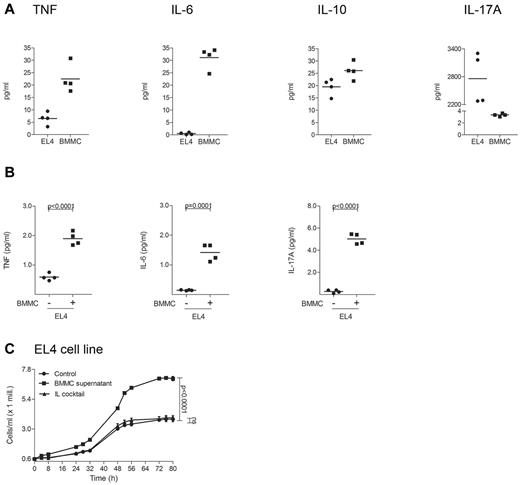
To investigate cytokine production and proliferation of murine lymphoma cells after stimulation with mast cells, release of cytokines from EL4 cells was measured by CBA (Figure 7). EL4 cells were found to express a proinflammatory cytokine pattern at baseline (Figure 7A). Stimulation of EL4 cells with supernatant of murine BMMCs induced significant up-regulation of TNF, IL-6, and IL-17A (Figure 7B). In addition, supernatant of BMMCs significantly increased proliferation of EL4 cells (Figure 7C).
Supernatant of murine mast cells induces cytokine release and proliferation of EL4 cells. (A) EL4 cells and murine BMMCs were cultured for 1 week and the cytokines TNF, IL-6, IL-10, and IL-17A were measured in the supernatant of 2 × 10⁶ cells/mL using a cytometric bead array (CBA). Mean data of 4 separate experiments (n = 4) are presented as scatter grams with medians. (B) EL4 cells were cultured with or without supernatant of BMMCs for 48 hours, washed and incubated in medium for 48 hours. Levels of TNF, IL-6, and IL-17A were measured in the supernatant of 5 × 10⁵ cells/mL using CBA. Statistical significance was assessed by 2-tailed Student t test. (C) EL4 cells were cultured with (BMMC supernatant) or without (Control) supernatant of BMMCs or with a cocktail of several cytokines (IL cocktail; IL-1α, IL-1β, IL-2, IL-4, and IL-7) and proliferation was measured for 80 hours using Cell Titer 96 AQueous One Solution Assay. Data represent the mean ± SD of 4 separate experiments (n = 4). When error bars are not shown, they were too small to be diagrammed. Statistical significance was assessed by 2-tailed Student t test (ns indicates not significant).
Supernatant of murine mast cells induces cytokine release and proliferation of EL4 cells. (A) EL4 cells and murine BMMCs were cultured for 1 week and the cytokines TNF, IL-6, IL-10, and IL-17A were measured in the supernatant of 2 × 10⁶ cells/mL using a cytometric bead array (CBA). Mean data of 4 separate experiments (n = 4) are presented as scatter grams with medians. (B) EL4 cells were cultured with or without supernatant of BMMCs for 48 hours, washed and incubated in medium for 48 hours. Levels of TNF, IL-6, and IL-17A were measured in the supernatant of 5 × 10⁵ cells/mL using CBA. Statistical significance was assessed by 2-tailed Student t test. (C) EL4 cells were cultured with (BMMC supernatant) or without (Control) supernatant of BMMCs or with a cocktail of several cytokines (IL cocktail; IL-1α, IL-1β, IL-2, IL-4, and IL-7) and proliferation was measured for 80 hours using Cell Titer 96 AQueous One Solution Assay. Data represent the mean ± SD of 4 separate experiments (n = 4). When error bars are not shown, they were too small to be diagrammed. Statistical significance was assessed by 2-tailed Student t test (ns indicates not significant).
Together, these results demonstrate that mast cells promote growth of EL4 tumors in vivo and in vitro.
Discussion
In this study, we report for the first time on a protumorigenic role of mast cells in PCL. The number of mast cells in skin sections of human CTCL and CBCL is highly increased compared with normal skin and inflammatory cutaneous diseases.36-39 Mast cell infiltration is most prominent in the periphery of CTCLs and CBCLs, especially at the rims of the infiltrate. In vitro, mast cell supernatant is able to induce cytokine release and proliferation of CTCL cells. Furthermore, mast cell–deficient Mcpt5-Cre/iDTR mice24 show decreased growth of EL4 tumors.
Our observation that mast cell numbers correlate with disease progression of CTCL (Figure 2) is of potential significance for clinical management of patients with CTCL. Possibly, mast cell infiltration could serve as an additional diagnostic criterion, as prognostic parameter or as follow-up marker. In fact, increased numbers of mast cells have been reported to correlate with poor prognosis in other lymphoid neoplasms such as Hodgkin lymphoma,15 B-cell non-Hodgkin lymphoma,18 and multiple myeloma.40 Similar data have been obtained in numerous solid cancers, such as pancreatic cancer,41 hepatocarcinoma and cholangiocarcinoma,17 prostate cancer,12 neurofibroma,16 and melanoma.14,42 In several tumors, such as lung adenocarcinoma, mast cell infiltration has also been shown to correlate with invasiveness and metastasis.19 However, to definitively clarify whether mast cell counts are useful as a diagnostic or prognostic marker in CTCL, further studies, especially prospective ones, with a sufficient number of patients and statistical power are necessary.
Our data also support a rationale for therapeutic inhibition of mast cells, for example by antihistamines, cromolyn, or in the near future by targeted drugs, which is predicted to decrease growth of PCL or even lead to regression of the disease. The concept of inhibiting tumor progression through antihistamines has been studied, to some extent, in various cancer models.43 For example, antihistamines inhibited growth of xenograft colon carcinomas and melanomas in mice and delayed proliferation of several human colon carcinoma cell lines.43,44 In breast cancer, treatment with H2-receptor antagonists resulted in complete remission of 70% of experimentally induced tumors.45 However, in clinical trials, H2-receptor antagonists showed only limited success in treatment of breast and colon cancer.46 In murine xenograft models of prostate adenocarcinoma12 and thyroid cancer,13 treatment with cromolyn, known to inhibit degranulation of mast cells and release of inflammatory cytokines, blocked growth of tumors, supporting our observation that mast cell supernatant of cromolyn-treated mast cells is not able to induce proliferation of tumor cells in vitro (Figure 5). Because patients with CTCL often suffer from pruritus, particularly those with MF and SS, antihistamines are already administered to many CTCL patients. However, no studies existed until now that compare the development of CTCL in the presence or absence of antihistamines.
In contrast to the protumorigenic role of mast cells described for a large number of tumors, mast cells also show antitumorigenic effects in certain malignancies. In colorectal cancer, infiltrates of mast cells have been associated with lower rates of lymph node metastasis and distant metastasis.20 In addition, in breast cancer, stromal mast cells were found to correlate with a favorable prognosis.21,22 Thus, mast cells can in principle exert both detrimental and beneficial effects on progression of tumors, depending for example on the type of tumor and the tumor stage, as it has been elegantly demonstrated for prostate adenocarcinoma.12 Mast cell–derived growth factors, shown in different models to promote tumor development and angiogenesis, include TGF-β1, FGF-2, VEGF, platelet-derived growth factor, and nerve growth factor. Some of these growth factors can also serve as mast cell chemoattractants in a feedback loop. Mast cell–produced cytokines that may participate in antitumor responses by fostering, for example tumor rejection or apoptosis, include IL-1, IL-2, IL-4, and IL-10. However, investigations on the role of specific mast cell products in tumor development, especially concerning the balance between pro- and anti-inflammatory mechanisms, are still at the beginning and further studies in this area may unravel highly interesting data.
For a long time, experimental research in oncology focused primarily on the tumor cell itself. This was also the case in research on PCL, where recent investigations reported on significant expression of IL-17 in cells and tissues from patients with MF and SS.5,6 IL-17 is known to participate in proinflammatory responses by initiating the production of various cytokines (IL-6, G-CSF, GM-CSF, IL-1β, TGF-β, TNF), chemokines (CXCL8 and CCL2), and prostaglandins (PGE2) from other cell types, such as epithelial cells, keratinocytes, endothelial cells, fibroblasts, macrophages, and mast cells. As a result, IL-17 has been linked to many immune/autoimmune diseases including rheumatoid arthritis, asthma, lupus, allograft rejection, and antitumor immunity. In CTCL, Krejsgaard et al showed that IL-2 and IL-15 are able to up-regulate the expression of IL-17 in neoplastic T-cells.6 Interestingly, CTCL lesions are known to exhibit increased angiogenesis and several angiogenic and inflammatory proteins that are induced by IL-17 (for example TNF, CCL20, MMP-9, COX-2, VEGF, and CXCL8) are also expressed in CTCL lesions.47-49
In addition to investigations exploring the characteristics of neoplastic cells itself, an increasing number of studies in different types of tumors demonstrate that the tumor microenvironment interacts with tumor cells in a complex manner and crucially influences tumor growth. For instance, in hematoxylin and eosin stained sections of our 43 patients with CTCL and CBCL, we also observed increased numbers of eosinophils associated with mast cell infiltration (data not shown). Aggregation of eosinophils together with mast cells has also been described to correlate with poor prognosis in several other malignancies, for example Hodgkin lymphoma.50 Apart from the interaction of mast cells with other immune cells of the tumor microenvironment, it is also conceivable that mast cells modulate other stromal structures, such as blood vessels or extracellular matrix. As an example, mast cells may indirectly participate in tumor development by producing VEGF that in turn stimulates tumor growth through enhanced tumor neoangiogenesis. Supporting this hypothesis, in lung cancer51 and squamous cell carcinomas of the esophagus52 and cervix, mast cell infiltrates have been correlated with both microvessel density and tumor progression, comparable with our results (Figure 4) and Karpova et al.53 Furthermore, mast cells are known to release large amounts of MMP-9, which causes degradation of the extracellular matrix, and mast cell–derived MMP-9 has recently been implied to promote invasiveness of prostate cancer.12
Over the past 30 years, Kit-mutant mice, such as WBBF1-KitW/Wv and C57BL/6 KitW-sh/W-sh have been used for the investigation of mast cell functions in vivo.34,54 In the WBBF1-KitW/Wv strain, the number of mast cells in the skin, stomach, cecum and mesentery is reduced to less than 1% compared with congeneic controls. In addition, WBBF1-KitW/Wv mice are sterile, anemic, and lack melanocytes as well as intestinal cells of Cajal. In contrast, the mast cell–deficient strain C57BL/6 KitW-sh/W-sh is fertile and not anemic, but also lacks melanocytes. C57BL/6 KitW-sh/W-sh animals are largely devoid of mast cells in the tongue, trachea, lung, stomach, spleen, small intestine, mesentery, peritoneum, and inguinal lymph nodes. In the skin, 1.2% of the normal number of mast cells are still present.34 However, C57BL/6 KitW-sh/W-sh mice show further abnormalities, such as splenomegaly, thrombocytosis, neutrophilia, and decreased numbers of F4/80-positive cells in the bone marrow.55
Our group recently generated a new mouse model of inducible mast cell deficiency.23,24 In contrast to the Kit-mutant lines used up to now, the Mcpt5-Cre/iDTR model shows an otherwise normal immune system. Injection of diphtheria toxin into Mcpt5-Cre+/iDTR+ mice, which express a simian diphtheria toxin receptor in connective tissue type mast cells, results in selective depletion of connective tissue mast cells. So far, the Mcpt5-Cre/iDTR mouse model has been used to explore novel mechanisms of contact allergy,24 but currently there is plenty of ongoing research using this new model for the analysis of mast cell functions.
In this study, we took advantage of the Mcpt5-Cre/iDTR model focusing for the first time on tumor research (Figure 6). Our results show significant differences in growth of EL4 tumors between mast cell–deficient Mcpt5-Cre+/iDTR+ animals and Mcpt5-Cre−/iDTR+ controls, while both groups received repeated diphtheria toxin injections before and during the experiments, demonstrating that mast cells are a crucial component that controls EL4 tumor progression. Interestingly, tumor growth in Mcpt5-Cre+/iDTR+ animals was similarly delayed, such as in C57BL/6 KitW-sh/W-sh mice. This observation suggests that the previously reported reduced development of various tumors in mast cell–deficient WBBF1-KitW/Wv56 and C57BL/6 KitW-sh/W-sh mice is also based on the absence of mast cells and not on the other immunologic alterations present in these models. In the past, these additional defects led to misinterpretation of results and false attribution of certain tasks to mast cells, such as suppression of contact allergy.24 Overall, it is possible that the effect of mast cells on tumor development has, at least in part, to be newly defined in the context of our new, more specific mouse model for mast cell deficiency.
Besides the selective depletion of mast cells, an essential advantage of the Mcpt5-Cre model is the possibility to also analyze mast cell–specific products in tumor growth by cross breeding Mcpt5-Cre with different “floxed” lines leading to Cre-loxP–mediated inactivation of genes selectively in connective tissue mast cells. For instance, one could imagine experiments with Mcpt5-Cre/VEGFflox or Mcpt5-Cre/MMP-9flox mice to clarify the specific contribution of mast cell–derived VEGF and MMP-9 to tumor neoangiogenesis and invasiveness.
To investigate growth of lymphomas in vivo, we chose to use subcutaneous injections of the mouse lymphoma cell line EL4, which we thought would best mimic cutaneous lymphoma in mice and which closely resembles the model of Wu et al.7 In this model, the mouse lymphoma cell line MBL2 was used instead of EL4. MBL2 and EL4 have both been shown to express a unique CTL epitope and identical TCRα- and β-chains, suggesting a common origin of the 2 cell lines.57
Taken together, our data demonstrate that mast cells promote growth of PCL. Mast cells are increased in human CTCL and CBCL and correlate with malignancy of CTCL as well as microvessel density. In vitro, we show that mast cells stimulate CTCL cells. We also report on delayed development of cutaneous lymphoma in mast cell–deficient mice. These findings suggest that therapeutic strategies targeting mast cells or their mediators could be a promising new approach for the treatment of PCL.
The online version of this article contains a data supplement.
The publication costs of this article were defrayed in part by page charge payment. Therefore, and solely to indicate this fact, this article is hereby marked “advertisement” in accordance with 18 USC section 1734.
Acknowledgments
The authors thank Dr C. Neumann (Department of Dermatology, University of Cologne, Cologne) for helpful discussions, and A. Florin (Institute of Pathology, University of Cologne, Cologne) for excellent technical assistance.
This work was supported by research grants from the German Research Council to P.K. (DFG, CRC/SFB829, project B5), C.M. (DFG, CRC/SFB829, project Z2), and K.H. (DFG, CRC/SFB832, project A14).
Authorship
Contribution: A.R., M.S., and L.C.H. performed experiments; M.S., S.T., P.K., and C.M. contributed patient samples and data; A.R., M.S., A.F., S.T., M.v.B.-B., A.R., and K.H. analyzed data; and A.R., R.B., and K.H. wrote the paper.
Conflict-of-interest disclosure: K.H. is a consultant in a Novartis trial and received research grants from Novartis. The remaining authors declare no competing financial interests.
Correspondence: Karin Hartmann, Department of Dermatology, University of Cologne, Kerpener Street 62, 50937 Cologne, Germany; e-mail: karin.hartmann@uni-koeln.de.


