Abstract
Inflammation is involved in the initiation and progression of several chronic lymphoid malignancies of B-cell type. Toll-like receptors (TLR) are transmembrane inflammatory receptors that on recognition of pathogen-associated molecular patterns trigger an innate immune response and bridge the innate and adaptive immune response by acting as costimulatory signals for B cells. Fine tuning of TLR and IL-1R–like (ILR) activity is regulated by TIR8 (SIGIRR), a transmembrane receptor of the TLR/ILR family which inhibits other family members. To test the hypothesis that TLR and/or ILR may play a role in the natural history of chronic B-cell tumors, we crossed Eμ-TCL1 transgenic mice, a well established model of chronic lymphocytic leukemia (CLL), with mice lacking the inhibitory receptor TIR8 that allow an unabated TLR-mediated stimulation. We here report that in the absence of TIR8 the appearance of monoclonal B-cell expansions is accelerated and mouse life span is shortened. The morphology and phenotype of the mouse leukemic expansions reproduce the progression of human CLL into an aggressive and frequently terminal phase characterized by the appearance of prolymphocytes. This study reveals an important pathogenetic implication of TLR in CLL development and progression.
Introduction
Chronic inflammation triggered by infections is a predisposing factor for various chronic B-cell malignancies. Examples are the association of Helicobacter pylori with gastric MALT lymphomas and of hepatitis C virus with splenic marginal zone lymphoma.1,2 An involvement of inflammatory receptors such as TLRs is thus conceivable and is also suggested by in vitro data in chronic B-cell malignancies such as chronic lymphocytic leukemia (CLL).2
TLRs recognize a set of different molecular patterns found in microbial components and on stimulation trigger NF-kB signaling pathway, induce the production of inflammatory cytokines and the expression of costimulatory molecules.3-5 TLRs bridge the innate and adaptive immune response by acting as costimulatory signals for B cells6-9 and when coengaged with the B-cell receptor (BCR) TLRs can also participate to autoantigen response.10,11 The type I transmembrane inhibitory receptor TIR8 (also known as SIGIRR) which belongs to the IL-1R–like (ILR) family acts as a decoy target for TLR and ILR signaling and regulates the fine tuning of TLRs and ILR.12-14 TIR8−/− mice have an increased susceptibility to intestinal inflammation,12 colitis associated cancer15 and colon epithelial tumorigenesis.16,17
CLL is a low grade B-cell tumor characterized by CD5+ monoclonal small mature B cells whose accumulation is favoured by microenvironment influences.18,19 Over time and because of unknown molecular events CLL may progress into an aggressive form characterized by a prolymphocytoid transformation. CD5+ small cells are gradually replaced by clonally-related, larger elements (prolymphocytes) that frequently lose CD5 expression. The patient's prognosis becomes poor and the survival short since no effective treatment is available.20,21
Among the stimuli generated by the microenvironment that contribute to the selection and expansion of CLL clones a prominent role is played by antigenic pressure as suggested by numerous observation: (1) in at least half of the patients leukemic cells carry somatically mutated immunoglobulin heavy chain variable genes (IGHV); (2) more than 20% of the cases express closely homologous, if not identical, stereotyped BCR which may recognize auto-antigens or bacterial components18 ; and (3) in the TCL1 transgenic (TCL1tg/tg) murine model of CLL22 leukemic IGs are autoreactive and bind polysaccharides which may be found in bacterial cell membranes.23 We recently observed that bacterial lipopeptides activating TLR protect human CLL cells from spontaneous apoptosis.24 All these findings are in line with the clinical paradigm that CLL patients have increased frequency and severity of infections as well as autoimmune complications. It has been suggested that common infections may play a causative role in CLL,25,26 though it is unclear whether this role is accounted for by underlying immune disturbances and/or by a direct effect on leukemic cells exerted by microbial antigens.
To test the hypothesis that TLR and/or ILR stimulation might be involved in the development and/or progression of CLL, we genetically inactivated TIR8 in the TCL1 transgenic mouse model to allow an unabated TLR-mediated stimulation and monitored the appearance and modality of leukemic cell expansion.
Methods
Mice
Eμ-TCL1 transgenic (TCL1tg/tg) mice were generously provided by C. Croce (University Cancer Center Columbus) and N. Chiorazzi (The Feinstein Institute for Medical Research, NY); Rag2−/− γc−/− mice were kindly provided by CIEA and Taconic. All mice were housed and bred in a specific pathogen free animal facility, treated in accordance with the European Union guidelines and approval of the San Raffaele Scientific Institute Institutional Ethical Committee. Homozygous TCL1tg/tg (background strain C3H/B6) were crossed with TIR8−/− (background strain C57BL/6) and TCL1tg/tgTIR8−/−, TCL1tg/tgTIR8wt/wt, TCL1wt/wtTIR8−/− and TCL1wt/wtTIR8wt/wt (F2 progeny) were used for the experiments. Mice were genotyped for TIR8 allele or hTCL1 transgene by PCR-based screening assay as previously described.12,27
Flow cytometry analysis
TCL1tg/tgTIR8−/− and TCL1tg/tgTIR8wt/wt mice were bled once a month starting from 2 months of age to monitor leukemic lymphocytes in peripheral blood (PB) by flow cytometry. TCL1tg/tgTIR8−/− and TCL1tg/tgTIR8wt/wt mice were killed when developing signs and symptoms of a moribund state, together with age-matched TCL1wt/wtTIR8−/− and TCL1wt/wtTIR8wt/wt littermates. Organs were collected. Cells from spleen, BM, peritoneal exudate (PE) and PB were analyzed by flow cytometry as previously reported.27 The following antibodies were used: anti–mouse CD19 (PE–Cy), anti–mouse CD5 (APC), anti–mouse CD21 (PE), anti–mouse CD23 (FITC), anti–mouse CD43 (PE; all from BD Biosciences Pharmingen) and anti–mouse IgM (FITC; from Cappel).
For in vitro studies, CD19+ splenocytes were enriched by depletion of nonB cells (EasySep Negative selection kit). For proliferation studies, CD19+ cells were labeled with 0.5μM of CFSE (Molecular Probes); increasing concentrations of LPS (Sigma-Aldrich) were added to the cells, and 5 days later cell proliferation was measured by flow cytometry after staining with (PE-Cy) anti–mouse CD19; 7-amino-actinomycin D (7-AAD; Beckman/Coulter) was used to mark and exclude dead cells. For activation studies, cells were stained with anti–mouse CD86 (FITC) and anti–mouse CD25 (PE; all from BD Biosciences Pharmingen), and analyzed by flow cytometry.
Histopathology and immunohistochemistry
Tissues were fixed in 4% formalin for 12 hours, embedded and included in paraffin wax; 5-mm thick sections were cut and stained with H&E. For immunohistochemical studies mice sections were deparaffinized, rehydrated and stained as previously described.27 The following antibodies were used: anti-B220 (RA3-6B2, Serotec), anti-Ki67 (SP6, Neo Markers), anti-BCL6 (rabbit polyclonal, Santa Cruz), anti-p27 (57, BD Biosciences), and anti-CD5 (53-7.3, BD Biosciences).
IGHV-D-J gene rearrangement analysis
Genomic DNA was extracted from BM and CD19+ enriched spleen cells according to QUIAmp DNA mini kit (QIAGEN) protocol and from whole blood samples using Maxwell 16 DNA Purification Kit and Maxwell Instrument (Promega Corporation). Nested PCR followed by DNA sequencing was performed as previously described.27
Quantitative real-time PCR
RNA was isolated from total splenocytes, from CD19+ splenocytes enriched by depletion of nonB cells (EasySep Negative selection kit), and total peritoneal cells (without purification being naturally enriched for CD19+CD5+ cells) and reverse transcribed (Fermentas cDNA Synthesis kit). The qRT PCR was carried out on the 7900HT Fast Real-Time PCR System (Applied Biosystems) using the TaqMan Gene Expression Assay (Applied Biosystems) for TIR8 (Mm00491700_m1) and mGAPDH (Mm9999915_g1) genes. To quantify the levels of mRNA, the expression of TIR8 was normalized to the mGAPDH housekeeping gene and the results were presented as ratio between normalized TIR8 expression in the target samples and the calibrator (mean value of 3 samples of total WT splenocytes). One TIR8 deficient mouse (TIR8−/−) was used as a negative control.
Results
The absence of TIR8 does not modify the percentage of normal mouse B cell populations
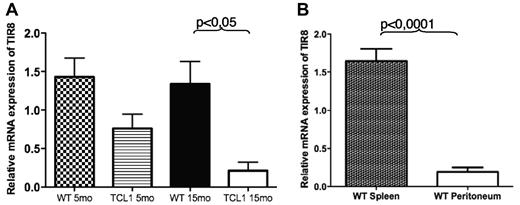
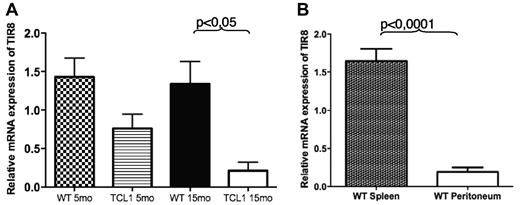
We first analyzed the expression of TIR8 in wild type (WT) and TCL1 B cells. Both total and CD19+ enriched splenocytes expressed detectable TIR8 mRNA levels which were significantly lower in CD19+ cells from TCL1 transgenic animals (Figure 1A). We next analyzed the expression of TIR8 in B cells isolated from different tissues and representing different B cells populations, namely splenic or B1a peritoneal lymphocytes; in details, we compared B cell enriched splenocytes (mean CD19+CD5+ cells: 4%) with corresponding B cell enriched peritoneal cells (mean CD19+CD5+ cells: 56%). As shown in Figure 1B, peritoneal B1 cells express lower levels of TIR8 mRNA compared with splenic B cells.
TIR8 mRNA expression in mice. (A) Relative mRNA expression of TIR8 in CD19+ enriched splenocytes of TCL1tg/tg (TCL1) and wild type (WT) mice of indicated age. The expression of TIR8 was normalized to mGAPDH and the results presented as ratio between normalized TIR8 expression in the target samples and the calibrator (mean value of 3 samples of total WT splenocytes). Data shown are average of 3 mice ± SEM. Statistical significance was analyzed by t test. (B) Relative mRNA expression of TIR8 in CD19+ enriched splenocytes (mean purity of CD19+ cells: 83% of which CD19+ CD5+ cells: 4%) and peritoneal cells (mean percentage CD19+ cells: 61% of which CD19+ CD5+ cells were 56%). Seven mice were analyzed: 5 animals at the age of 15 months and 2 animals at the age of 22 months. The expression of TIR8 was normalized to mGAPDH and the results are presented as ratio between normalized TIR8 expression in the target samples and the calibrator (mean value of 3 replicates of total WT splenocytes with 27% CD19+ cells and 4.5% CD19+ CD5+ cells). Data shown are average of 7 mice ± SEM. Statistical significance was analyzed by t test.
TIR8 mRNA expression in mice. (A) Relative mRNA expression of TIR8 in CD19+ enriched splenocytes of TCL1tg/tg (TCL1) and wild type (WT) mice of indicated age. The expression of TIR8 was normalized to mGAPDH and the results presented as ratio between normalized TIR8 expression in the target samples and the calibrator (mean value of 3 samples of total WT splenocytes). Data shown are average of 3 mice ± SEM. Statistical significance was analyzed by t test. (B) Relative mRNA expression of TIR8 in CD19+ enriched splenocytes (mean purity of CD19+ cells: 83% of which CD19+ CD5+ cells: 4%) and peritoneal cells (mean percentage CD19+ cells: 61% of which CD19+ CD5+ cells were 56%). Seven mice were analyzed: 5 animals at the age of 15 months and 2 animals at the age of 22 months. The expression of TIR8 was normalized to mGAPDH and the results are presented as ratio between normalized TIR8 expression in the target samples and the calibrator (mean value of 3 replicates of total WT splenocytes with 27% CD19+ cells and 4.5% CD19+ CD5+ cells). Data shown are average of 7 mice ± SEM. Statistical significance was analyzed by t test.
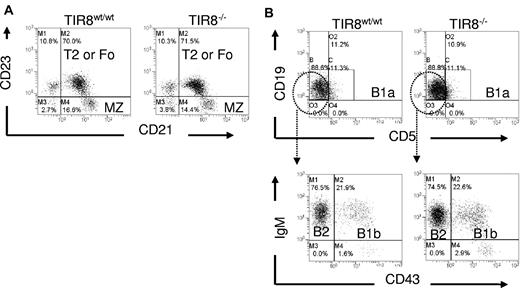
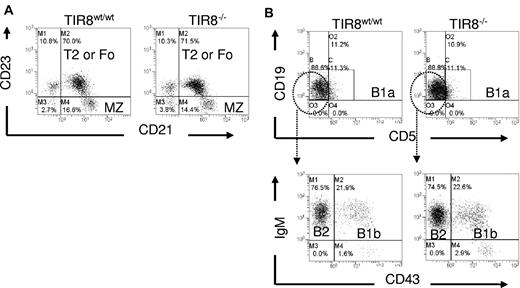
We then asked whether the lack of TIR8 might affect normal B-cell populations. We compared B-cell subsets in the spleen and peritoneal cavity of WT and TIR8 deficient (TIR8−/−) mice and observed that in TIR8−/− mice the percentages of transitional type 1, transitional type 2, follicular and marginal zone B cells in the spleen (Figure 2A) and of B1a, B1b and of conventional B2 cells in the peritoneal cavity (Figure 2B) were unchanged.
Normal B cell populations in mice lacking TIR8. (A-B) Dot plots of flow cytometric analysis of CD19+ B lineage cells to define different populations in WT and TIR8−/− mice. Splenic marginal zone (MZ) B cells (CD21+CD23−), type 2 (T2) or mature recirculating follicular (Fo) B cells (CD21+ CD23+; A); peritoneal B1a (CD5+CD19+), B1b (CD43+IgM+) and B2 cells (CD43−IgM+; B). Data are representative of 3 animals 3 months old.
Normal B cell populations in mice lacking TIR8. (A-B) Dot plots of flow cytometric analysis of CD19+ B lineage cells to define different populations in WT and TIR8−/− mice. Splenic marginal zone (MZ) B cells (CD21+CD23−), type 2 (T2) or mature recirculating follicular (Fo) B cells (CD21+ CD23+; A); peritoneal B1a (CD5+CD19+), B1b (CD43+IgM+) and B2 cells (CD43−IgM+; B). Data are representative of 3 animals 3 months old.
The absence of TIR8 accelerates CD19+CD5+ expansion in TCL1 transgenic mice and shortens mouse life span
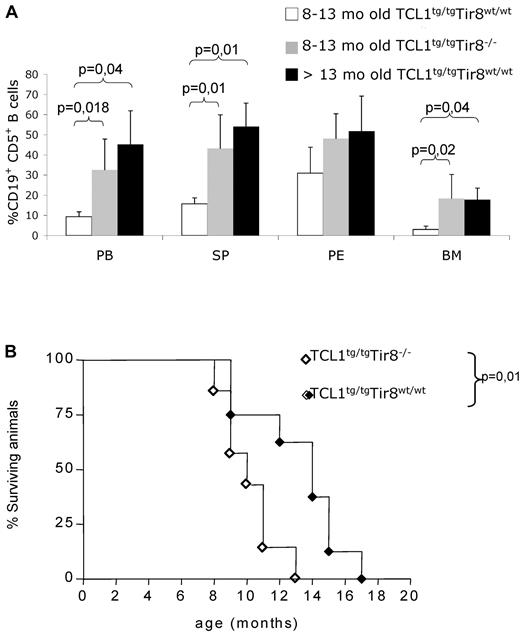
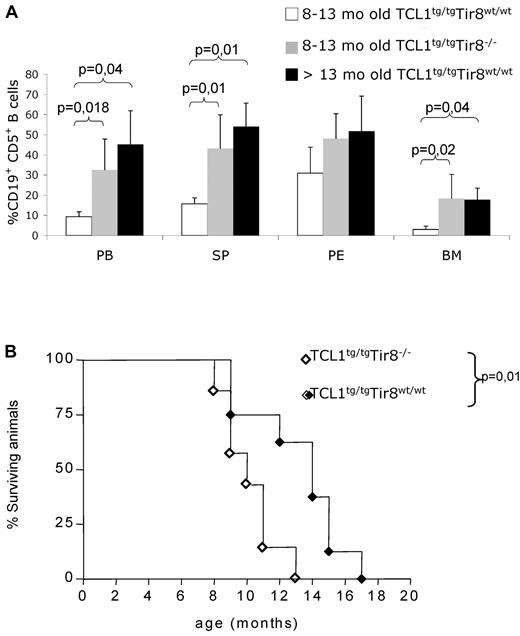
To investigate the in vivo role of TIR8 in the onset and progression of CLL, we crossed TIR8−/− mice with TCL1tg/tg (TCL1tg/tg/TIR8−/−) mice and analyzed them together with age-matched TCL1tg/tgTIR8wt/wt, TCL1wt/wtTIR8−/− and WT littermates for the development of CLL. TCL1tg/tg/TIR8−/− mice were killed between 8 and 13 months, when the percentage of circulating leukemic CD19+CD5+ cells exceeded 20% and/or mice showed signs of illness.27 TCL1tg/tg/TIR8−/− compared with age-matched TCL1tg/tgTIR8wt/wt mice had a more abundant accumulation of CD19+CD5+leukemic B cells in all lymphoid organs (including spleen and BM, Figure 3A). Similar to TCL1tg/tgTIR8wt/wt mice,22 CD19+CD5+ B-cells from the spleen, PB, peritoneal cavity and BM from TCL1tg/tg/TIR8−/− mice showed restricted IgK and IgM expression (data not shown). The monoclonal origin of the B-cell expansion observed in TCL1tg/tg/TIR8−/− mice was confirmed by IGH gene rearrangement analysis. All clones expressed unmutated IGHV genes and the same rearrangement was found in all the organs analyzed from the same animal (Table 1).
Premature CLL-like expansions and shorter life span in TCL1 transgenic mice lacking TIR8. (A) 8-13 months old TCL1tg/tgTIR8wt/wt mice (n = 6, mean age: 10 months ± 0), age-matched TCL1tg/tgTIR8−/− (n = 6, mean age: 10 months ± 1.8 as described in Table 1) and > 13 months old TCL1tg/tgTIR8wt/wt (n = 3, one 18 months, one 19 months and one 14 months old, respectively; mean age 17 months ± 2.6) mice were analyzed for accumulation of CD19+CD5+ B cells within different organs by flow cytometry. The mean value ± SD of the relative contribution of CD19+CD5+ cells to the whole B cell pool in the BM, SP, PE and PB, is shown. Statistical significance was analyzed by t test. (B) Kaplan-Meier survival curves of TCL1tg/tgTIR8wt/wt (n = 8) and TCL1tg/tgTIR8−/− (n = 7) mice. Statistical analysis between groups was performed using the log-rank test (median survival: 14 and 10 for TCL1tg/tgTIR8wt/wt and TCL1tg/tgTIR8−/− mice, respectively). Mice were included in the analysis after spontaneous death or when killed because of signs/symptoms of illness.
Premature CLL-like expansions and shorter life span in TCL1 transgenic mice lacking TIR8. (A) 8-13 months old TCL1tg/tgTIR8wt/wt mice (n = 6, mean age: 10 months ± 0), age-matched TCL1tg/tgTIR8−/− (n = 6, mean age: 10 months ± 1.8 as described in Table 1) and > 13 months old TCL1tg/tgTIR8wt/wt (n = 3, one 18 months, one 19 months and one 14 months old, respectively; mean age 17 months ± 2.6) mice were analyzed for accumulation of CD19+CD5+ B cells within different organs by flow cytometry. The mean value ± SD of the relative contribution of CD19+CD5+ cells to the whole B cell pool in the BM, SP, PE and PB, is shown. Statistical significance was analyzed by t test. (B) Kaplan-Meier survival curves of TCL1tg/tgTIR8wt/wt (n = 8) and TCL1tg/tgTIR8−/− (n = 7) mice. Statistical analysis between groups was performed using the log-rank test (median survival: 14 and 10 for TCL1tg/tgTIR8wt/wt and TCL1tg/tgTIR8−/− mice, respectively). Mice were included in the analysis after spontaneous death or when killed because of signs/symptoms of illness.
To ascertain if the observed leukemia development impacted on the overall survival of animals, we analyzed a group of TCL1tg/tgTIR8−/− mice and compared them to TCL1tg/tgTIR8wt/wt mice. The absence of TIR8 significantly shortened the life span of TCL1tg/tgTIR8−/− mice (Figure 3B); TCL1wt/wtTIR8−/− and wild type animals displayed a normal life span (data not shown).12
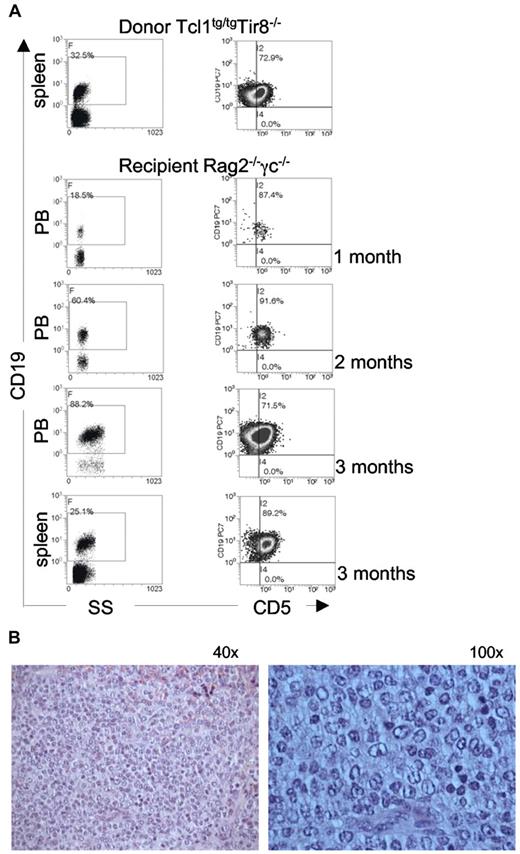
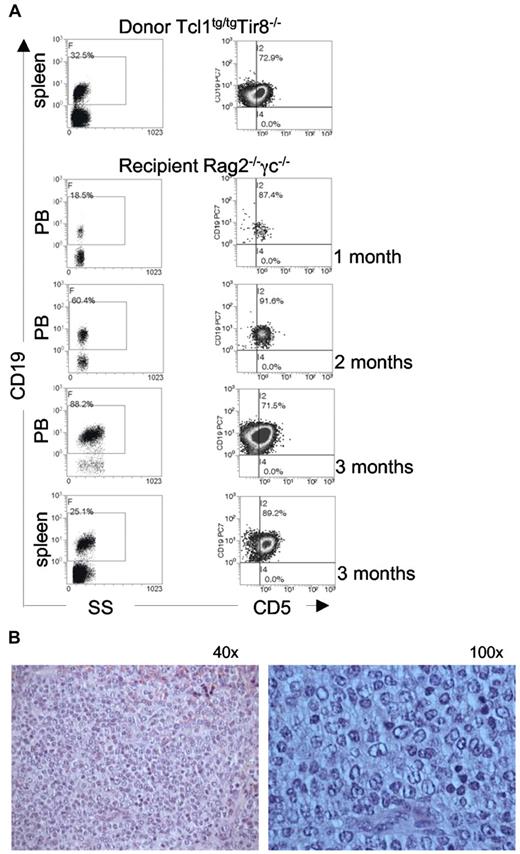
To determine whether B splenocytes purified from TCL1tg/tg/TIR8−/− mice were leukemogenic, we injected intraperitoneally 1 × 10⁶ cells into immunodeficient Rag2−/− γc−/− mice; animals were monitored over time for the presence of clonal expansions in the PB. Transplanted leukemic cells were detected in the PB of all recipient mice as early as 1 month after transplant and increased with time (Figure 4). IGHV gene rearrangement demonstrated their origin from the same clonal population of the donor mice.
TCL1tg/tgTIR8−/− cells are leukemogenic. (A) CD19+ splenocytes (106 cells) were purified from 2 different TCL1tg/tgTIR8−/− mice and injected intraperitoneally into 8-week-old Rag2−/− γc−/− male mice (n = 9 each group). Mice were bled monthly, and analyzed for the appearance of CD19+CD5+ monoclonal population by flow cytometry; after 3 months mice were sacrificed, spleen removed and single cell suspension analyzed by flow cytometry for the expression for CD19 and CD5. One representative mouse shown. (B) Histopathologic examination of spleen of Rag2−/− γc−/− mice injected with TCL1tg/tgTIR8−/− (one representative animal sacrificed after 3 months of 9 analyzed): microscopic evaluation 40× and 100×.
TCL1tg/tgTIR8−/− cells are leukemogenic. (A) CD19+ splenocytes (106 cells) were purified from 2 different TCL1tg/tgTIR8−/− mice and injected intraperitoneally into 8-week-old Rag2−/− γc−/− male mice (n = 9 each group). Mice were bled monthly, and analyzed for the appearance of CD19+CD5+ monoclonal population by flow cytometry; after 3 months mice were sacrificed, spleen removed and single cell suspension analyzed by flow cytometry for the expression for CD19 and CD5. One representative mouse shown. (B) Histopathologic examination of spleen of Rag2−/− γc−/− mice injected with TCL1tg/tgTIR8−/− (one representative animal sacrificed after 3 months of 9 analyzed): microscopic evaluation 40× and 100×.
The absence of TIR8 induces a morphologically evident transformation of leukemic cells in TCL1 transgenic mice
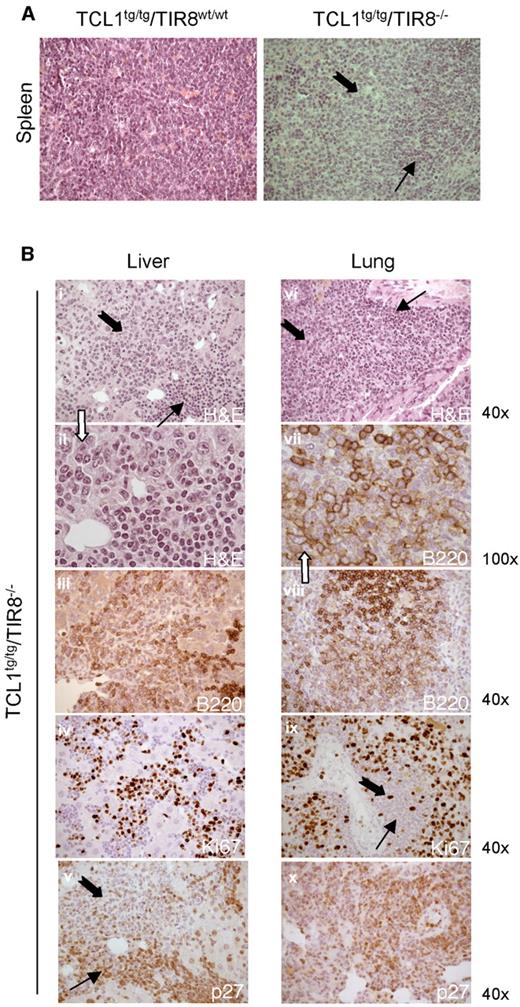
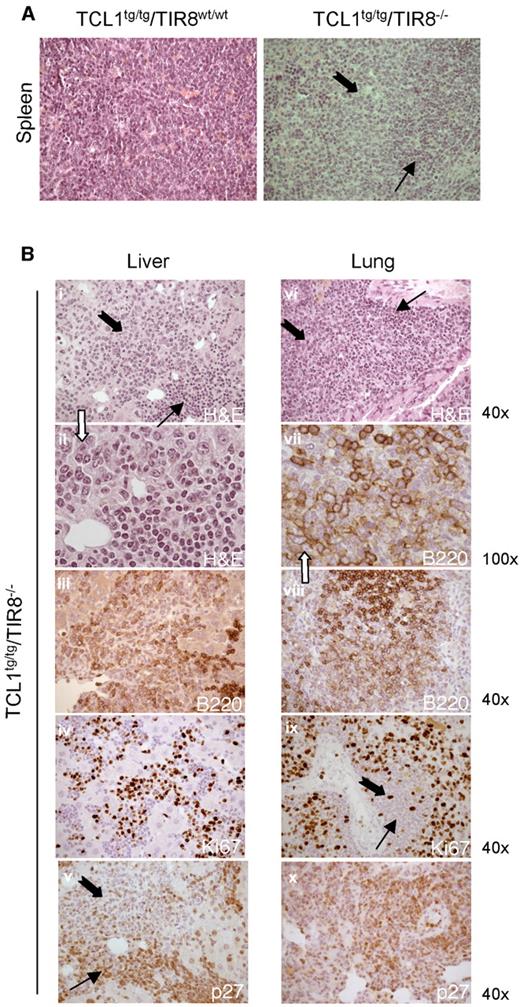
At the age of 8-13 months the splenic tissue of TCL1tg/tg/TIR8−/− mice was substantially replaced by leukemic cells compared with TCL1tg/tgTIR8wt/wt mice of the same age. In TCL1tg/tgTIR8wt/wt mice we observed only a variable degree of interfollicular effacement of splenic architecture by a homogeneous population of small-sized lymphoid cells (Figure 5A, left panel). In clear contrast, 2 types of neoplastic lymphocytes were detected in the largely infiltrated spleens of TCL1tg/tg/TIR8−/− (Figure 5A, right panel). Typical small-size lymphocytes similar to human CLL cells were admixed with an often prevalent second population of larger cells with medium to large nuclei and relatively abundant cytoplasm. Nuclei showed a more dispersed chromatin and frequently had an evident though not prominent nucleolus. The same morphological pattern was observed in the trasplanted mice (see Figure 4B). These features are reminiscent of the prolymphocytes observed in the prolymphocytoid transformation of human CLL and we will refer to this population of large cells as “prolymphocytoid.”
Prolymphocytoid transformation in TCL1 transgenic mice lacking TIR8. (A) Histopathologic examination of spleen of TCL1tg/tgTIR8wt/w and TCL1tg/tgTIR8−/− (1 representative animal 9 months old of 6 analyzed): microscopic evaluation 40×. Small and large black arrows indicate small-size and large-size cells, respectively. (B) Histopathologic examination of extranodal localizations of TCL1tg/tgTIR8−/− mice (1 representative animal 9 months of 6 analyzed). Liver (i-v) and lung (vi-x) were analyzed by H&E staining or immunohistochemical stains for B220, p27 and Ki-67 as indicated. Microscopic evaluation: 40× (i,iii-vi,viii,ix, xii) and 100× (ii,vii). Small and large black arrows indicate small-size and large-size cells, respectively.
Prolymphocytoid transformation in TCL1 transgenic mice lacking TIR8. (A) Histopathologic examination of spleen of TCL1tg/tgTIR8wt/w and TCL1tg/tgTIR8−/− (1 representative animal 9 months old of 6 analyzed): microscopic evaluation 40×. Small and large black arrows indicate small-size and large-size cells, respectively. (B) Histopathologic examination of extranodal localizations of TCL1tg/tgTIR8−/− mice (1 representative animal 9 months of 6 analyzed). Liver (i-v) and lung (vi-x) were analyzed by H&E staining or immunohistochemical stains for B220, p27 and Ki-67 as indicated. Microscopic evaluation: 40× (i,iii-vi,viii,ix, xii) and 100× (ii,vii). Small and large black arrows indicate small-size and large-size cells, respectively.
Prolymphocytoid cells were found both in lymphoid and non lymphoid organs such as lung and liver in variable proportions (Figure 5B and Table 1), had weaker immunoreactivity for B220 (Figure 5B) and heterogeneous expression of CD5 (data not shown). The expression of proliferation marker Ki67 was high and counterbalanced by undetectable levels of p27, a negative regulator of cell cycle (Figure 5B); the cells were also not immunoreactive for BCL6 (data not shown). Weak immunoreactivity for B220 and high expression of Ki67 were also observed in the transplanted mice (data not shown). IGHV gene rearrangements demonstrated that irrespective of the morphology and phenotype the same clone was present in all the tissues analyzed (Table 1).
TLR induce proliferation of leukemic B cells and down-modulate the expression of CD5
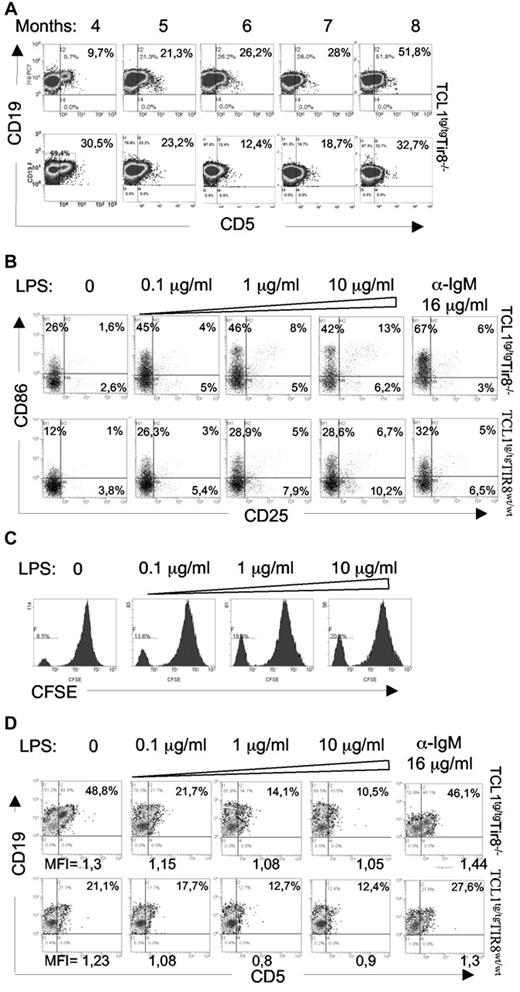
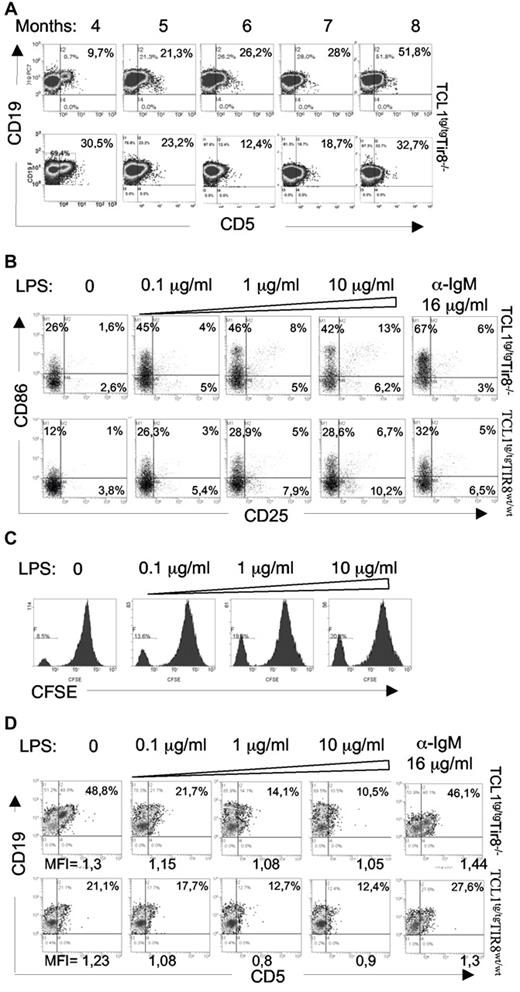
CD5 was variably expressed by the tissue-infiltrating prolymphocytes of TCL1tg/tg/TIR8−/− mice; further PB leukemic cells from 2/6 mice, whose prolymphocytoid transformation was evident from the histologic analysis of different organs, down-modulated the expression of CD5 at distinct time points (Figure 6A lower panel). Given that the expression of CD5 is down-regulated also in human prolymphocytes, we investigated the modulation of CD5 in mouse leukemic B cells.
In vitro TLR-mediated downmodulation of CD5 expression on leukemic cells. (A) TCL1tg/tgTIR8−/− mice were monitored during time (months indicated) by flow cytometry analysis of Peripheral Blood (PB) to detect leukemic clone (CD19+CD5+). 2 representative analysis (lower panel with CD5 downmodulation) of TCL1tg/tg/TIR8−/− mice are shown (n = 6). (B) CD19+enriched splenocytes from TCL1tg/tgTIR8wt/wt and TCL1tg/tg/TIR8−/− mice were cultured in vitro with increasing amounts of LPS or anti-IgM for 24 hours and analyzed by flow cytometry CD25 and CD86 expression. One representative experiment is shown (n = 5 each group). (C) CD19+ enriched splenocytes from TCL1tg/tgTIR8wt/wt mice were stained with CFSE and cultured in vitro with increasing amounts of LPS for 5 days. Flow cytometry analysis of CFSE dilution revealed a peak of proliferation in leukemic cells that was augmented by LPS treatment. One representative plot shown (n = 3). (D) CD19+enriched splenocytes (the same as in panel B) from TCL1tg/tgTIR8wt/wt and TCL1tg/tg/TIR8−/− mice were cultured in vitro with increasing amounts of LPS or anti-IgM for 24 hours and analyzed by flow cytometry for CD19 and CD5 expression. One representative experiment is shown (n = 5 each group). Mean fluorescence intensity (MFI) of CD19+CD5+ cells are indicated.
In vitro TLR-mediated downmodulation of CD5 expression on leukemic cells. (A) TCL1tg/tgTIR8−/− mice were monitored during time (months indicated) by flow cytometry analysis of Peripheral Blood (PB) to detect leukemic clone (CD19+CD5+). 2 representative analysis (lower panel with CD5 downmodulation) of TCL1tg/tg/TIR8−/− mice are shown (n = 6). (B) CD19+enriched splenocytes from TCL1tg/tgTIR8wt/wt and TCL1tg/tg/TIR8−/− mice were cultured in vitro with increasing amounts of LPS or anti-IgM for 24 hours and analyzed by flow cytometry CD25 and CD86 expression. One representative experiment is shown (n = 5 each group). (C) CD19+ enriched splenocytes from TCL1tg/tgTIR8wt/wt mice were stained with CFSE and cultured in vitro with increasing amounts of LPS for 5 days. Flow cytometry analysis of CFSE dilution revealed a peak of proliferation in leukemic cells that was augmented by LPS treatment. One representative plot shown (n = 3). (D) CD19+enriched splenocytes (the same as in panel B) from TCL1tg/tgTIR8wt/wt and TCL1tg/tg/TIR8−/− mice were cultured in vitro with increasing amounts of LPS or anti-IgM for 24 hours and analyzed by flow cytometry for CD19 and CD5 expression. One representative experiment is shown (n = 5 each group). Mean fluorescence intensity (MFI) of CD19+CD5+ cells are indicated.
In vitro experiments revealed that both BCR crosslinking and LPS stimulation were able to activate leukemic cells as shown by the up-regulation of CD86 and CD25 (Figure 6B). To note, increasing concentrations of the TLR4 ligand LPS also significantly increased the percentage of proliferating cells from 12% (± 3,29) to 26% (± 7,65; n = 3 mice; P = .034; Figure 6C). However, while the expression of CD5 remained unchanged on anti-IgM stimulation (Figure 6D), increasing doses (0.1-10 μg/mL) of LPS resulted in a relevant CD5 down-regulation in B cells from both TCL1tg/tg/TIR8−/− and TCL1tg/tgTIR8wt/wt leukemic mice (Figure 6D while we have no evidence of terminal differentiation (ie loss of surface IgM or CD19; data not shown).
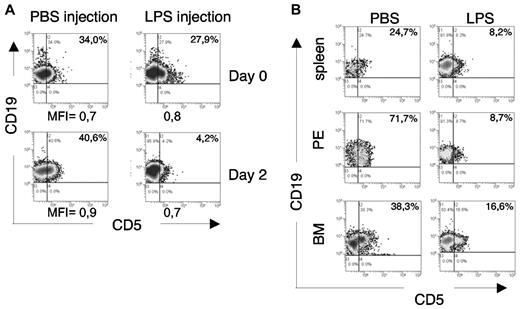
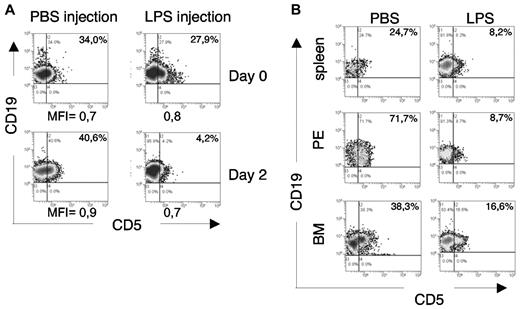
This observation led us to evaluate whether the in vivo injection of LPS might modify the CD5 expression of leukemic cells: 18 month-old leukemic TCL1tg/tgTIR8wt/wt mice (PB CD19+CD5+ cells > 30%) were injected with LPS (1 μg/g) or PBS and analyzed 48 hours later. As shown in Figure 7A, flow cytometric analysis of PB B cells revealed a significant down-regulation of CD5 in 2 of 4 mice after LPS injection, closely resembling the in vitro findings (Figure 6D). The animals were killed and a similar CD5 down-regulation was detected in all the organs analyzed (Figure 7B).
In vivo TLR-mediated downmodulation of CD5 expression on leukemic cells. (A) Leukemic TCL1tg/tgTIR8wt/wt mice were injected intraperitoneally either with 1μg/g LPS or PBS (n = 4 each group). 48 hours later, mice were bled and analyzed by flow cytometry. PB was analyzed before and after LPS injection for CD5 expression on leukemic cells. Plots from 1 mouse each group shown; 2 of 4 mice analyzed showed down-regulation of CD5 after LPS injection. MFI of CD19+CD5+ cells are indicated. (B) The same leukemic TCL1tg/tgTIR8wt/wt mice as in panel A were killed, organs removed and single-cell suspension analyzed by flow cytometry for the expression of CD19 and CD5. PE indicates peritoneal exudate; BM, bone marrow. Plots from 1 mouse in each group shown; 2 of 4 mice analyzed showed down-regulation of CD5 after LPS injection.
In vivo TLR-mediated downmodulation of CD5 expression on leukemic cells. (A) Leukemic TCL1tg/tgTIR8wt/wt mice were injected intraperitoneally either with 1μg/g LPS or PBS (n = 4 each group). 48 hours later, mice were bled and analyzed by flow cytometry. PB was analyzed before and after LPS injection for CD5 expression on leukemic cells. Plots from 1 mouse each group shown; 2 of 4 mice analyzed showed down-regulation of CD5 after LPS injection. MFI of CD19+CD5+ cells are indicated. (B) The same leukemic TCL1tg/tgTIR8wt/wt mice as in panel A were killed, organs removed and single-cell suspension analyzed by flow cytometry for the expression of CD19 and CD5. PE indicates peritoneal exudate; BM, bone marrow. Plots from 1 mouse in each group shown; 2 of 4 mice analyzed showed down-regulation of CD5 after LPS injection.
Discussion
In this work we tested the hypothesis that the development and/or progression of CLL might be influenced by the stimulation of TLR and/or ILR. To this end, we genetically inactivated TIR8 in the TCL1 transgenic mouse model and monitored the appearance and modality of leukemic cell expansion in TCL1tg/tg/TIR8−/− mice that allow an unabated TLR-mediated stimulation in a CLL-prone context. The rationale of this approach is that TIR8 inhibits the signaling receptor complexes of ILR and TLR family members thus representing a unique key regulator of inflammation, cancer related inflammation and autoimmunity.14 TIR8 is widelyexpressed in tissues with high levels in digestive tract, kidneys and lymphoid organs; it is found in selected immune cells including natural killer cells, splenocytes, monocytes and immature myeloid dendritic cells.14,28 Variable levels of TIR8 mRNA are expressed in human normal and leukemic B cells24 and we here report that its expression is progressively reduced in aging leukemic mice which tend to progressively expand monoclonal CD5+ B cell populations; therefore, it could be possible that low expression of TIR8 is an intrinsic program of CD5+ B cells. Indeed, this is supported by our evidence that normal peritoneal B cells express lower levels of TIR8 compared with B splenocytes.
Our in vivo model corroborated by in vitro studies demonstrates that, while the lack of the TLR family inhibitory receptor TIR8 does not modify normal B-cell populations in wild type mice, its genetic inactivation in the TCL1 mouse model of CLL results in an earlier, more disseminated and aggressive leukemia. Clonal cells purified from TCL1tg/tg/TIR8−/− mice are leukemogenic when transplanted into immunodeficient Rag2−/− γc−/− mice. Even more interestingly the absence of TIR8 induces a morphologically evident transformation in the leukemic cells of TCL1 transgenic mice which resembles the prolymphocytoid transformation of human CLL. In TCL1tg/tg/TIR8−/− mice prolymphocytoid cells were found in both lymphoid and non lymphoid organs. Their phenotype, including the absence of immunoreactivity for BCL6, excludes the possibility that a transformation into a large diffuse B cell lymphoma occurs. Furthermore prolymphocytoid cells have a high proliferation index as assessed by the expression of high levels of Ki67 and low to undetectable levels of the cell cycle inhibitor p27. To note, we have recently shown that TLR trigger cell cycle progression by down-regulating p27 levels in human CLL cells.29
The morphologically evident progression of CLL cells triggered by the lack of TIR8 that allows TLR stimulation was accompanied by a concomitant loss of CD5 expression. In vitro and in vivo finding demonstrate that TLR stimulation byLPS treatment down-modulates the expression of CD5 expression on the surface of leukemic cells. It is well known that CD5+ and “conventional” CD5− B lymphocytes coexist in both mice and humans. CD5 could be an activation marker, because surface IgM crosslinking induces the expression of CD5 on “conventional” B cells.30 Conversely, CD5 can be downmodulated by exposing CD5+ B cells to exogenous cytokines such as IL-1 or IL-2,31,32 IL4,33 IL-634 as well as to Epstein-Barr virus (EBV).31,35 After LPS treatment in vitro, normal murine CD5+ B1a cells up-regulate surface markers (ie, CD40 and CD86) and concomitantly down-regulate CD5.36 Our in vitro and in vivo data show that LPS stimulation of CD5+ CLL B cells induces activation and proliferation and down-regulates CD5 as well. As CD5 is a negative regulator of TCR- and BCR-mediated signaling,30 a down-regulation of CD5 might allow an increase in BCR-induced B-cell activation and proliferation. This possibility leads to speculate that in TCL1tg/tg/TIR8−/− mice the TLR-triggered down-regulation of CD5 might facilitate a BCR-mediated leukemic cell expansion which could ultimately lead to a more aggressive malignancy.
Taken together these findings imply that cell stimulation through one or more members of the TLR and/or ILR family favours the onset and especially the progression of CLL. It may be asked whether the TLR-mediated promoting effect is exerted directly onto the malignant clone or indirectly through the tumor microenvironment. TLR ligands can lead to either proliferation (TLR2 and TLR4),37,38 apoptosis (TLR3 and TLR9)39,40 or chemoresistance (TLR7 and TLR8)41 of cancer cells, depending on the specific ligand and/or the cellular context.42,43 Our in vitro data support the hypothesis that TLR ligands may directly promote leukemic cells activation and proliferation, though the possibility of an additional effect mediated by the intervention of accessory cells such as T cells, dendritic cells and monocytes cannot be ruled out. Future transplantation experiments with CLL from TIR8 wild-type TCL1 transgenic mice into TIR8 deficient recipients or vice versa will allow to demonstrate whether the TIR8 deficient phenotype is cell-autonomous. These data are in keeping with a recent report showing that leukemic cells from progressive CLL patients proliferate in response to TLR9 ligand stimulation and that the proliferative response is highly predictive of progression-free and overall survival suggesting that direct TLR stimulation of the leukemic cells may influence disease progression.44
It may also be asked which TLR or ILR specifically contribute to this process. One could reason that endogenous TLR or ILR ligands constitutively activate cognate membrane receptors in the absence of TIR8. Examples are ILR family cytokines such as IL1, IL18, IL33 and TLR ligands including PAMP (pathogen associated molecular patterns) derived from intestinal microflora and/or DAMP (danger associated molecular patterns) containing autoantigens and/or apoptotic bodies.3,6 Future experimental approaches with distinct ILR or TLR deficient animals will identify which specific molecule(s) is implicated.
In conclusion the model here presented validates TLR and/or ILR pathways as novel biologic mechanisms that favor CLL progression and could be exploited for dissecting the molecular mechanism(s) that lead to prolymphocytoid transformation in vivo and for testing ad hoc therapeutic strategies.
The publication costs of this article were defrayed in part by page charge payment. Therefore, and solely to indicate this fact, this article is hereby marked “advertisement” in accordance with 18 USC section 1734.
Acknowledgments
Eμ-TCL1 transgenic mice were generously provided by C. Croce (University Cancer Center Columbus) and N. Chiorazzi (The Feinstein Institute for Medical Research, NY). Rag2−/− γc−/− on BALB/c background were kindly provided by CIEA (Central Institute for Experimental Animals, Kawasaki, Japan) and Taconic. The authors thank Cristina Scielzo, Michela Frenquelli and Stefano Casola for helpful suggestions and discussion, and Nadia Polentarutti for technical support.
This project was supported by Leukemia Research Foundation (Illinois); Cariplo Foundation (Italy); Program Molecular Clinical Oncology-5 per mille number 9965, Associazione Italiana per la Ricerca sul Cancro (Italy); U.S./European Alliance for the Therapy of CLL, CLL Global Research Foundation (Texas); Ricerca Finalizzata (Ministero della Salute, Italy); Fondazione Italiana per la Ricerca sul Cancro (Italy) and Fondazione Ferrero (Italy).
Authorship
Contribution: M.T.S.B. designed and performed experiments, analyzed the data and wrote the paper; G.S. performed in vivo experiments and immunoglobulin studies; A.D. performed immunoglobulin studies; M.R. performed histology; T.V.R performed in vivo experiments; B.A. performed in vitro experiments; A.M. provided the TIR8–/– mice and assisted in writing the paper; M.P. analyzed data, interpreted histology and wrote the paper; P.G. analyzed data and assisted in writing the paper; C.G. provided the TIR8–/– mice, assisted in designing research, analyzed data and wrote the paper; F.C.C. designed research, analyzed the data and wrote the paper; and M.M. designed and coordinated research, performed experiments, analyzed data, and wrote the paper.
Conflict-of-interest disclosure: The authors declare no competing financial interests.
Correspondence: Federico Caligaris-Cappio, Università Vita-Salute San Raffaele, Via Olgettina 58, 20132 Milano, Italy; e-mail: caligaris.federico@hsr.it.

