Abstract
B cell–specific gene ablation of Notch2 results in the loss of the marginal zone (MZ) B-cell lineage. To analyze the effects of constitutive Notch2 signaling in B cells, we have generated a transgenic mouse strain that allows the conditional expression of a constitutively active, intracellular form of Notch2 (Notch2IC). Expression of Notch2IC at the earliest developmental stages of the B-cell lineage completely abolished B-cell generation and led to the development of ectopic T cells in the bone marrow (BM), showing that Notch2IC is acting redundantly with Notch1IC in driving ectopic T-cell differentiation. In B cells clearly committed to the B-cell lineage induction of Notch2IC drove all cells toward the MZ B-cell compartment at the expense of follicular B cells. Notch2IC-expressing B cells reflected the phenotype of wild-type MZ B cells for their localization in the MZ, the expression of characteristic surface markers, their enhanced proliferation after stimulation, and increased basal activity of Akt, Erk, and Jnk. Notch2IC-driven MZ B-cell generation in the spleen was achieved even in the absence of CD19. Our results implicate that a constitutive Notch2 signal in transitional type 1 B cells is sufficient to drive MZ B-cell differentiation.
Introduction
The main site of B-cell development is the BM, where pro-B cells develop from common lymphoid precursors, and pass through the pre-B and immature B-cell stages.1 B cells that have successfully rearranged their B-cell receptor (BCR) leave the BM as transitional B cells.2 Transitional type 1 (T1) B cells are recent emigrants from the BM that enter the spleen, where they develop further into transitional type 2 (T2) B cells and finally mature B cells.3 The two main types of mature B cells in the spleen are termed follicular (Fo) and marginal zone (MZ) B cells, which differ in their surface phenotype, anatomic localization, and immunologic function.4 Fo B cells, which constitute the majority of peripheral B cells, circulate through the blood and secondary lymphoid organs, where they differentiate into plasma or memory B cells in response to antigens. In contrast, murine MZ B cells are less abundant and sessile in the splenic MZ, which forms the border between the red and white pulp. On interaction with blood-borne bacteria, MZ B cells rapidly differentiate into plasma cells.5,6
A variety of signals have been shown to influence the cell fate decision between Fo B and MZ B cells, including signals provided by the family of Notch receptors.7 Ligand binding to the extracellular domain of Notch results in a regulated set of proteolytic cleavage events, leading to the release and translocation of the Notch intracellular fragment (NotchIC) into the nucleus, where it complexes with the DNA-binding protein RBP-J to activate transcription (for review, see Zimber-Strobl and Strobl8 and Radtke et al9 ).
In mammals, 4 different Notch receptors (Notch1-4) have been described. Both Notch1 and Notch2 are expressed in lymphocytes and function nonredundantly in these cells. In BM progenitors, ablation of Notch1 or RBP-J results in a block of T-cell development and the appearance of B cells in the thymus. In contrast, retroviral expression of Notch1IC in hematopoietic progenitor cells causes a block of B-cell development at the pre-pro-B-cell stage and simultaneously an ectopic T-cell development in the BM.10 Genetic deletion of Notch2, RBP-J, or Dll1 results in the absence of MZ B cells, whereas T cells develop in a Notch2-independent manner.11-13 Besides Notch2, a number of gene ablations in the BCR-, PI3K/Akt-, and NF-κB–linked signaling pathways display striking defects of MZ B-cell development along with normal Fo B-cell development.7 Thus, it is unclear whether Notch2 signaling is sufficient for the generation of MZ B cells, and how it interacts with other signaling pathways during this process.
To investigate the effect of constitutive Notch2 signaling in B cells, we have generated a conditional transgenic mouse strain, allowing the Cre/loxP-dependent expression of the intracellular part and thus a constitutively active form of Notch2 (Notch2IC). Notch2IC expression in early pro-B cells arrested B-cell development and led to an aberrant T-cell population in the BM. In contrast, Notch2IC expression in B cells that have been irreversibly committed to the B-cell lineage resulted in a strong shift of transitional T1 B cells towards the MZ B-cell compartment at the expense of Fo B cells even in the absence of CD19.
Methods
Generation of the transgenic mouse line Notch2ICflSTOP
Notch2IC-cDNA corresponding to positions 5253-7583 (National Center for Biotechnology Information NM_010928) was isolated from the pTracer-CMV-Notch2cDNA vector14 (kindly provided by F. Radtke, Swiss Institute for Experimental Cancer Research). The notch2IC-cDNA was placed into the pRTS-targeting vector (kindly provided by D. Calado, Immune Disease Institute Inc, Boston, MA) and electroporated into C57BL/6J × 129S6/SvEvTac-F1–derived (IDG2.3) embryonic stem cells.15 Recombinant embryonic stem cells were injected into C57BL/6 blastocysts, which were then transferred into foster mice to obtain chimeric mice.
Mice
To achieve B cell–specific expression of Notch2IC, mice carrying the Notch2ICflSTOP allele were crossed either to the CD19-Cre (C57Bl/6-background; Notch2IC//CD19Cre+/−) or to the mb1-Cre mouse strain (C57Bl/6-background; Notch2IC//mb1Cre+/−). Mice were analyzed at 8-16 weeks of age. Mice were bred and maintained in specific pathogen-free conditions, and the experiments were performed in compliance with the German Animal Welfare Act and have been approved by the institutional committee on animal experimentation and the government of Upper-Bavaria.
Cell purification and in vitro cultures
B cells were purified from spleen suspensions by depleting CD43+ cells with magnetic beads (Miltenyi Biotec). B cells were cultured for 1 hour at 37°C in complete RPMI medium supplemented with 1% FCS,16 before cells were objected to further extraction procedures.
Splenic B cells were cultured ≤ 5 days in complete RPMI medium supplemented with 10% FCS. The following stimuli were used: lipopolysaccharide (LPS; 10-25 μg/mL; Escherichia coli 055:B5; Sigma-Aldrich), IL-4 (10 ng/mL; mouse recombinant; Sigma-Aldrich), α-CD40 antibody (2.5 μg/mL; eBioscience; HM40-3). For proliferation assays, splenic B cells were labeled with 5μM CFSE (Molecular Probes) for 5 minutes at 37°C.
Flow cytometry
Antibodies specific for AA4.1, B220, CD1d, CD2 (human), CD3, CD5, CD19, CD21, CD23, CD25, CD36, CD43, CD80, CD86, ICAM-1, Thy1.2, IgD, and IgM were purchased from BD Biosciences. For intracellular stainings splenic single-cell suspensions were fixed and permeabilized with BD Cytofix/Cytoperm Plus Fixation/Permeabilization Kit and were stained with an α-phospho-Erk (pT202/pY204) antibody (Cell Signaling) and α-phospho-Jnk (pT183/pY185) antibody (Abcam) as primary and α-rabbit-IgG1-PE (Molecular Probes, Invitrogen) as secondary antibody or with the use of α-phospho-Akt-Alexa647 (pSer437; Cell Signaling). For cell-cycle analyses, splenic B cells were treated for 30 minutes on ice with a buffer containing 0.25 g of sodium citrate, 0.75 mL of Triton X-100, 0.025 g of propidium iodide, 0.005 g of Ribonuclease A, and 250 mL of distilled water. Analyses were performed on a FACSCalibur (BD Biosciences). Results were analyzed with CELLQuest or FlowJo Version 8.8.6 (TreeStar) software.
Immunohistochemistry
Immunohistochemistry was performed as described in Rastelli et al.17 All staining steps were performed at room temperatures. Slides were analyzed with an Axiovert 135 microscope (Zeiss) with a PL 10×/20 eyepiece and a 10×/0.30 Plan-Neofluar objective lens (imaging medium air). Pictures obtained with an AxioCam MRc5 digital camera in combination with AxioVision rel.4.6.3.0 software (Carl Zeiss MicroImaging GmbH) were finally processed with Adobe Photoshop CS3 software (Adobe Systems).
Western blot analysis
Extract preparations and Western blot analyses were performed as previously described.16 The hybridoma for the Notch2 antibody (C651.6DbHN) was obtained from Developmental Studies Hybridoma Bank (University of Iowa). α-Hes1 and α-Deltex1 antibodies were purchased from Santa Cruz Biotechnology; α-phospho-Jnk (pT183/pY185) antibody from Abcam; α-Erk (p44/42), α-phospho-Erk (pT202/pY204), α-Jnk (56G8), α-Akt, α-phospho-Akt (pS473, pThr308), α-p70S6K, α-phospho-p70S6K (pThr389), α-Foxo1, and α-Tubulin antibodies from Cell Signaling. Films (Agfa Healthcare) were scanned with an Epson Expression-1680Pro scanner. For Western blot quantification by densitometry, films were scanned in transmission mode with off-switched automatic gain control. A reference film was generated by creating an exposure series with the use of defined light quantities, to ensure that only Western blot bands within the dynamic range of the film and scanner were quantified. Images were quantified with ImageJ 1.43 (NIH).
Statistics
Two-tailed Student t test was applied to determine the significance of splenic weight values, percentages, and absolute numbers of flow cytometrically analyzed cell populations and ratios of signal intensities from immunoblotting.
Results
Generation of a conditional transgenic mouse strain expressing Notch2IC
Notch2IC was inserted under the control of the CAGGS (CMV early enhancer/chicken β-actin/rabbit globin) promoter together with a loxP-flanked stop cassette into the rosa26-locus (supplemental Figure 1A, available on the Blood Web site; see the Supplemental Materials link at the top of the online article). To allow identification of transgene-expressing cells, a frt-flanked IRES-hCD2 cassette was placed downstream of Notch2IC. To achieve B cell–specific expression, Notch2ICflSTOP mice were crossed either to mb1- or CD19-Cre mice.18,19 For simplicity, mice carrying one Notch2IC knock-in allele, and one CD19-Cre or mb1-Cre allele, are referred to as Notch2IC//CD19Cre+/− or Notch2IC//mb1Cre+/− mice, respectively. As controls, either Notch2ICflSTOP and CD19-Cre, or Notch2ICflSTOP and mb1-Cre mice were used.
After Cre-mediated recombination, Notch2IC was detected in large amounts in the nuclear fraction of Notch2IC knock-in B cells, whereas in the nuclear fraction of control B cells, Notch2IC levels were close to the detection limit (supplemental Figure 1B). Increased protein levels of the 2 classic Notch target genes Hes1 and Deltex1 in the extracts of Notch2IC-expressing B cells compared with control B cells furthermore confirmed the functionality of the transgenic Notch2IC (supplemental Figure 1C).
Mb1-Cre–dependent Notch2IC expression blocks B-cell development at the pro-B-cell stage and leads to an aberrant T-cell population in the BM
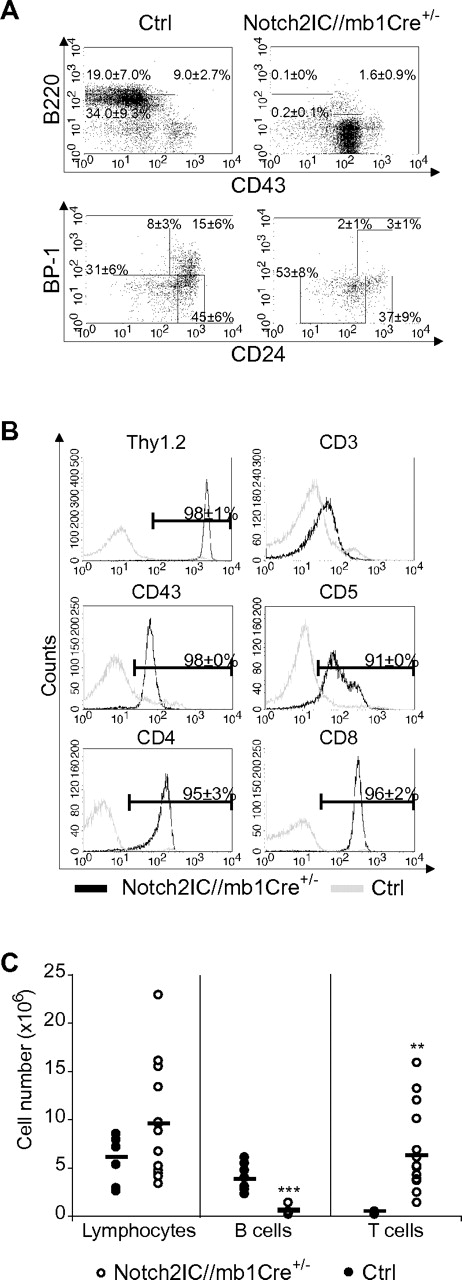
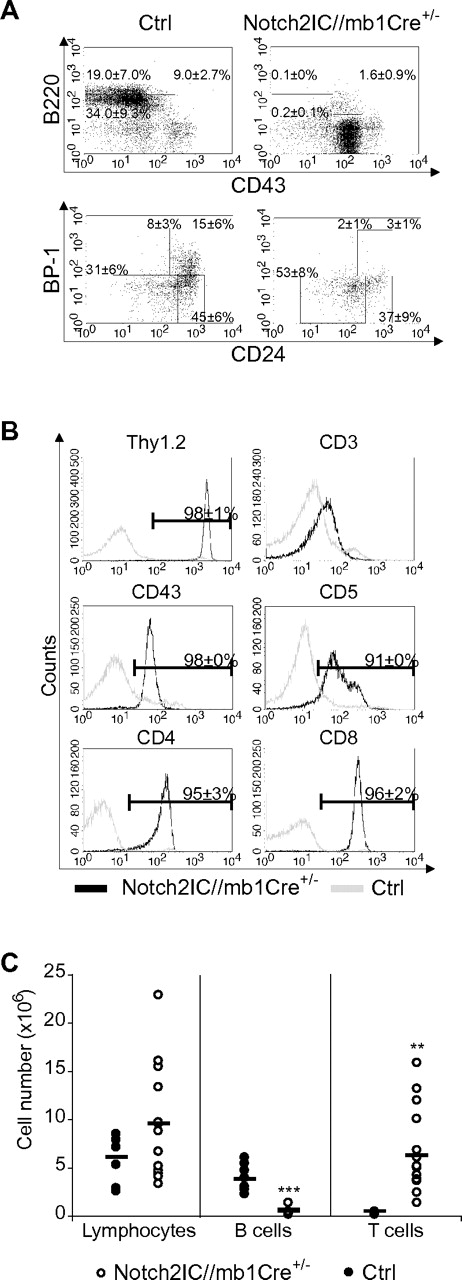
Induction of Notch2IC expression by mb1-Cre, which is already active in the earliest stages of B-cell development,18 resulted in a complete block of the B-cell lineage. Most B220+CD43+ B cells displayed a BP1− phenotype, showing that Notch2IC expression blocks B-cell maturation already at the pro-B-cell stage (Figure 1A). Only ∼ 15% of B220+CD43+ B cells displayed hCD2 expression (data not shown), suggesting that B-cell development is blocked as soon as Notch2IC is expressed.
Early B-cell development is blocked in Notch2IC//mb1Cre+/− mice. (A) Flow cytometric analysis of BM single-cell suspensions. Numbers display the percentages and SD of lymphocyte-gated pro- and large pre-B cells (B220+CD43+), immature and small pre-B cells (B220+CD43−), and mature, recirculating B cells (B220highCD43−; top) or of lymphocyte, B220+CD43+-gated Hardy Fraction A (BP1−CD24low)//early pro-B, Fraction B (BP1−CD24+)//late pro-B, Fraction C (BP1+CD24low), and Fraction C′ (BP1+CD24+)//early pre-B20 (bottom). Values were calculated from 10 analyzed mice per genotype. (B) Notch2IC//mb1Cre+/− mice display an aberrant T-cell population in the BM. BM single-cell suspensions were stained and analyzed with flow cytometry for the expression of indicated surface markers. Histograms show overlays of surface expression of the indicated molecules on lymphocyte-gated, hCD2+ BM cells from Notch2IC//mb1Cre+/− (black line) and lymphocyte-gated BM cells from control (gray line) mice. Mean percentages and SDs were calculated from 10 independent experiments. (C) In the BM of Notch2IC//mb1Cre+/− mice, absolute T-cell numbers are increased, whereas B-cell numbers are decreased. Absolute numbers of total counted cells, lymphocyte-gated, B220+ B cells and Thy1.2+ T cells in the BM of Notch2IC//mb1Cre+/− (○) and control (●) mice. Points represent data from individual mice, and horizontal bars mark the mean value.
Early B-cell development is blocked in Notch2IC//mb1Cre+/− mice. (A) Flow cytometric analysis of BM single-cell suspensions. Numbers display the percentages and SD of lymphocyte-gated pro- and large pre-B cells (B220+CD43+), immature and small pre-B cells (B220+CD43−), and mature, recirculating B cells (B220highCD43−; top) or of lymphocyte, B220+CD43+-gated Hardy Fraction A (BP1−CD24low)//early pro-B, Fraction B (BP1−CD24+)//late pro-B, Fraction C (BP1+CD24low), and Fraction C′ (BP1+CD24+)//early pre-B20 (bottom). Values were calculated from 10 analyzed mice per genotype. (B) Notch2IC//mb1Cre+/− mice display an aberrant T-cell population in the BM. BM single-cell suspensions were stained and analyzed with flow cytometry for the expression of indicated surface markers. Histograms show overlays of surface expression of the indicated molecules on lymphocyte-gated, hCD2+ BM cells from Notch2IC//mb1Cre+/− (black line) and lymphocyte-gated BM cells from control (gray line) mice. Mean percentages and SDs were calculated from 10 independent experiments. (C) In the BM of Notch2IC//mb1Cre+/− mice, absolute T-cell numbers are increased, whereas B-cell numbers are decreased. Absolute numbers of total counted cells, lymphocyte-gated, B220+ B cells and Thy1.2+ T cells in the BM of Notch2IC//mb1Cre+/− (○) and control (●) mice. Points represent data from individual mice, and horizontal bars mark the mean value.
However, hCD2 expression was detected in 72% of all lymphocyte-gated BM cells (supplemental Table 1). Most of these hCD2+ cells displayed a CD8+, CD4+, CD43+, CD5+, Thy1.2+, CD3low, or TCRβlow phenotype (Figure 1B; data not shown), indicating the development of an aberrant double-positive T-cell population. As a consequence, Thy1.2+ T-cell numbers were significantly increased in the BM of Notch2IC/mb1Cre+/− mice, leading to slightly elevated total cell numbers in the BM compared with controls (Figure 1C). In the spleen of Notch2IC/mb1Cre+/− mice, only 1.3% of the lymphocyte-gated cells were hCD2+ (supplemental Table 1; supplemental Figure 2B), suggesting that most of the Notch2IC-expressing cells do not reach the periphery. Consequently, B220+ B cells were drastically reduced in the spleen, as well as in the inguinal lymph nodes (iLNs) and in the peritoneal cavity (supplemental Figure 2). The remaining B220+ B cells in the spleen did not express IgM, IgD, CD21, or CD23 (supplemental Figure 2B; data not shown), pointing to a rather immature state of these cells. IgM+ cells could only be detected in the iLNs; however, these cells did not express hCD2 (supplemental Figure 2B). Hence, constitutive Notch2 expression in early lymphoid progenitor cells strongly suppresses B-cell lymphopoiesis from early B-lineage subsets on. Thereby, the generation of mature B1 and B2 B cells is equally affected.
MZ B cells are the dominant B-cell population in the spleen of Notch2IC//CD19Cre+/− mice
To overcome the block of early B-cell development and induction of ectopic T-cell differentiation observed with mb1-Cre, Notch2ICflSTOP mice were bred to CD19Cre mice.19 In the BM, except for a reduced number of recirculating B cells in Notch2IC//CD19Cre+/− mice, the percentages and total cell numbers of pro-, pre-, and immature B cells were comparable in mutant and control mice (supplemental Figure 3B; Table 1), indicating that the delayed expression of Notch2IC by CD19-Cre bypasses the severe block of B-cell development as seen with mb1-Cre. As indicated by the analysis of hCD2 expression, 17% of all BM and 79% of all splenic B cells expressed Notch2IC (supplemental Figure 3A).
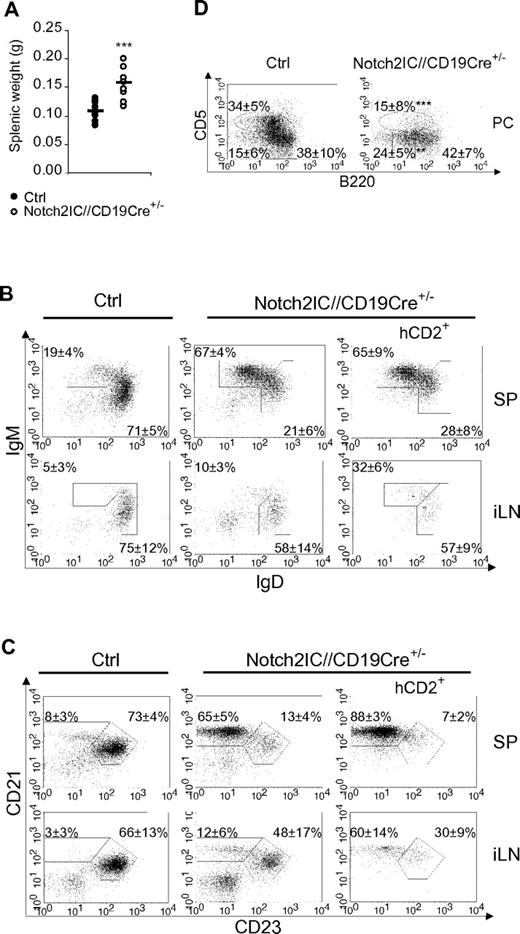
Notch2IC//CD19Cre+/− mice displayed a significant increase of the splenic weight (Figure 2A), whereas total splenic cell numbers as well as B- and T-cell numbers were comparable to age-matched controls (supplemental Figure 4A). The percentages of IgM+IgDlow as well as CD21highCD23low B cells were strongly elevated (Figure 2B-C), whereas the percentage of CD21intCD23+ Fo B cells was substantially decreased. The numbers of Fo B cells were 5 times lower and the numbers of MZ B cells were 7 times higher than those of controls (Table 1), indicating that most of the splenic B cells have adopted a MZ B-cell phenotype. The remaining Fo B-cell population expressed higher overall levels of IgM, reminiscent of the Fo-II B-cell phenotype as reviewed in Pillai and Cariappa7 (Figure 2B).
MZ B cells are the dominant B-cell population in the spleen of Notch2IC//CD19Cre+/− mice. (A) Splenic weight of 8-week-old Notch2IC//CD19Cre+/− mice and control littermates. Points represent data from individual mice, and horizontal bars mark the mean value. ***P < .001, as calculated by the 2-tailed Student t test. (B-C) Notch2IC expression strongly drives MZ B-cell differentiation. Lymphocytes of spleen (SP) and iLNs of the indicated genotype were analyzed by flow cytometry for the expression of IgM and IgD (B) or CD21 and CD23 (C). Plots B and C are gated on lymphocytes and B220+ cells. Numbers indicate mean percentages and SDs of lymphocyte-gated populations of B220+ B cells. The right panels are additionally gated on hCD2, displaying the distribution of Notch2IC-expressing cells. Fo B cells (IgM+IgD+), MZ B and transitional B cells (IgM+IgDlow; B); Fo B cells (CD21intCD23+) and MZ B cells (CD21highCD23low; C). The calculation is based on 11 independent experiments. (D) B1a and B2 cells are decreased in the peritoneal cavity (PC) of Notch2IC//CD19Cre+/− mice. Flow cytometric analysis of cells isolated from the PC. Cells are pregated on lymphocytes and IgM+ cells. Numbers display the percentages and SDs of lymphocyte-gated, IgM+ B1a (B220lowCD5+), B1b (B220lowCD5low), and B2 (B220highCD5−) cells. Values were calculated from 9 independent experiments. **P < .01 and ***P < .001, calculated by the 2-tailed Student t test, in comparison to control.
MZ B cells are the dominant B-cell population in the spleen of Notch2IC//CD19Cre+/− mice. (A) Splenic weight of 8-week-old Notch2IC//CD19Cre+/− mice and control littermates. Points represent data from individual mice, and horizontal bars mark the mean value. ***P < .001, as calculated by the 2-tailed Student t test. (B-C) Notch2IC expression strongly drives MZ B-cell differentiation. Lymphocytes of spleen (SP) and iLNs of the indicated genotype were analyzed by flow cytometry for the expression of IgM and IgD (B) or CD21 and CD23 (C). Plots B and C are gated on lymphocytes and B220+ cells. Numbers indicate mean percentages and SDs of lymphocyte-gated populations of B220+ B cells. The right panels are additionally gated on hCD2, displaying the distribution of Notch2IC-expressing cells. Fo B cells (IgM+IgD+), MZ B and transitional B cells (IgM+IgDlow; B); Fo B cells (CD21intCD23+) and MZ B cells (CD21highCD23low; C). The calculation is based on 11 independent experiments. (D) B1a and B2 cells are decreased in the peritoneal cavity (PC) of Notch2IC//CD19Cre+/− mice. Flow cytometric analysis of cells isolated from the PC. Cells are pregated on lymphocytes and IgM+ cells. Numbers display the percentages and SDs of lymphocyte-gated, IgM+ B1a (B220lowCD5+), B1b (B220lowCD5low), and B2 (B220highCD5−) cells. Values were calculated from 9 independent experiments. **P < .01 and ***P < .001, calculated by the 2-tailed Student t test, in comparison to control.
In the iLNs of Notch2IC//CD19Cre+/− mice, only 24% of B cells expressed hCD2 (data not shown), indicating that the Notch2IC-expressing B cells mainly accumulate in the spleen. Total B-cell numbers were slightly reduced, whereas T-cell numbers were almost doubled compared with control mice (supplemental Figure 4B). Analysis of hCD2+ cells showed that also in the iLNs most of the Notch2IC-expressing B cells have adopted a MZ B cell-like phenotype (Figure 2C). Histologic stainings showed that hCD2+ cells are distributed inside of the B-cell follicles of iLNs (supplemental Figure 5). In the peritoneal cavity of mutant mice, B2 and B1a cells were strongly reduced, whereas the total numbers of B1b cells were less affected (Figure 2D; supplemental Figure 4C).
Notch2IC-expressing B cells are predominantly located in the MZ and express the surface markers characteristic for MZ B cells
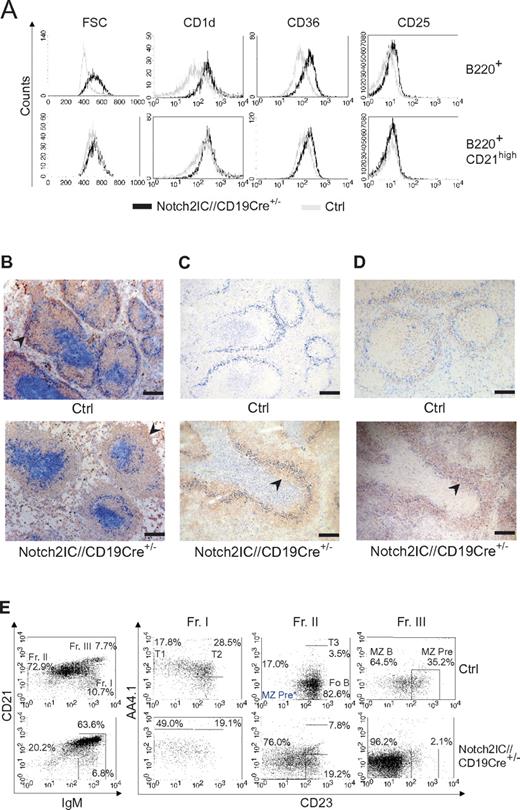
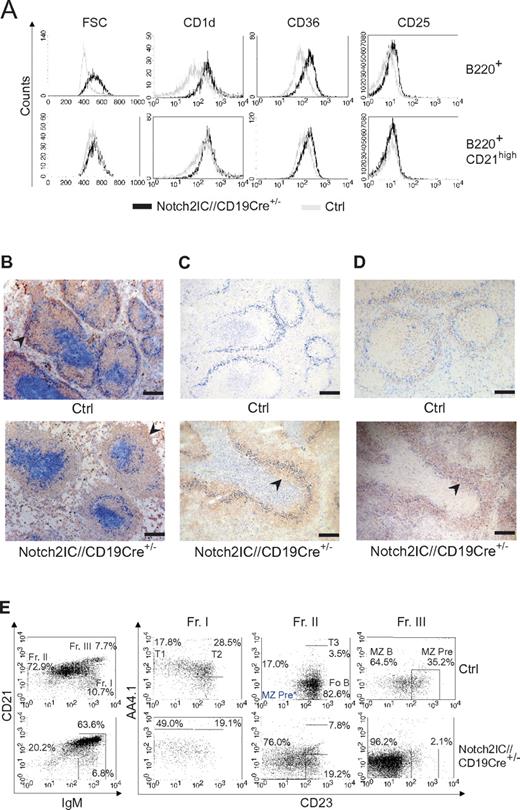
In the spleen Notch2IC knock-in B cells displayed an increased cell size and enhanced expression of the characteristic MZ B-cell markers CD1d, CD36, and CD25 in comparison to control B cells (Figure 3A). The surface expression level of these markers in mutant B cells was comparable to that of control MZ B cells (Figure 3A).
Characterization of Notch2IC-expressing B cells as MZ B cells. (A) Characteristic MZ B-cell surface marker expression on Notch2IC+ B cells. Histograms show overlays of cell size (forward scatter) or overlays of surface expression of the indicated molecules on lymphocyte-gated, B220+, hCD2+ B cells from Notch2IC//CD19Cre+/− (black line) and on lymphocyte-gated, B220+ B cells from control (gray line) mice (top). Histograms in the bottom row are additionally gated on CD21high to compare Notch2IC-expressing MZ B/MZ B precursor cells with control MZ B/MZ B precursor cells. Data are representative for 3 independent experiments. (B-D) Notch2IC-expressing B cells are mainly located in the splenic MZ. Immunohistochemical stainings of splenic cryosections for (B) MOMA-1+ metallophilic macrophages (α-MOMA1; blue), lining the MZ at the sinus, IgM+ B cells (α-IgM; red), and CD3+ T cells (α-CD3; blue). The MZ is indicated by arrows. Scale bar: 250 μm. (C) MOMA-1+ metallophilic macrophages (α-MOMA-1; marine blue), CD3+ T cells (α-CD3; pigeon blue), and hCD2+ (α-hCD2; red). An arrowhead indicates hCD2+ B cells within the follicle. Scale bar: 250 μm. (D) MOMA-1+ metallophilic macrophages (α-MOMA1; blue) and CD1d+ MZ B cells and MZ B-cell precursor cells (α-CD1d; red) and CD3+ T cells (α-CD3; blue). CD1d+ cells within the follicle are indicated by an arrow. Panels C and D are serial sections stained with different antibodies. The arrows indicate MZ B cells or MZ B-cell precursors located inside the primary follicles. Scale bar: 250 μm. (E) The numbers of MZ B-cell precursors are not increased in Notch2IC//CD19Cre+/− mice. Splenic B cells isolated by CD43+ depletion were stained with antibodies specific for CD21/35, IgM, CD23, and AA4.1 and were analyzed by flow cytometry. Plots in the left panel are lymphocyte-gated and display percentages of cells belonging to fraction I to III (Fr. I, II, III) according to Allman and colleagues21,22 ; IgMhighCD21/35low/int cells (Fr. I); IgMlow/intCD21/35int cells (Fr. II); IgMhighCD21/35high cells (Fr. III). Numbers in the right panel display the frequency of events as a function of the indicated parent gate, which is stated above. Fr. I harbors T1 and T2 B cells; Fr. II, T3 and Fo B cells as well as potential MZ B-cell precursors* (MZ Pre*); and Fr. III, MZ B cells and conventional MZ B-cell precursors. Data are representative for 3 independent experiments.
Characterization of Notch2IC-expressing B cells as MZ B cells. (A) Characteristic MZ B-cell surface marker expression on Notch2IC+ B cells. Histograms show overlays of cell size (forward scatter) or overlays of surface expression of the indicated molecules on lymphocyte-gated, B220+, hCD2+ B cells from Notch2IC//CD19Cre+/− (black line) and on lymphocyte-gated, B220+ B cells from control (gray line) mice (top). Histograms in the bottom row are additionally gated on CD21high to compare Notch2IC-expressing MZ B/MZ B precursor cells with control MZ B/MZ B precursor cells. Data are representative for 3 independent experiments. (B-D) Notch2IC-expressing B cells are mainly located in the splenic MZ. Immunohistochemical stainings of splenic cryosections for (B) MOMA-1+ metallophilic macrophages (α-MOMA1; blue), lining the MZ at the sinus, IgM+ B cells (α-IgM; red), and CD3+ T cells (α-CD3; blue). The MZ is indicated by arrows. Scale bar: 250 μm. (C) MOMA-1+ metallophilic macrophages (α-MOMA-1; marine blue), CD3+ T cells (α-CD3; pigeon blue), and hCD2+ (α-hCD2; red). An arrowhead indicates hCD2+ B cells within the follicle. Scale bar: 250 μm. (D) MOMA-1+ metallophilic macrophages (α-MOMA1; blue) and CD1d+ MZ B cells and MZ B-cell precursor cells (α-CD1d; red) and CD3+ T cells (α-CD3; blue). CD1d+ cells within the follicle are indicated by an arrow. Panels C and D are serial sections stained with different antibodies. The arrows indicate MZ B cells or MZ B-cell precursors located inside the primary follicles. Scale bar: 250 μm. (E) The numbers of MZ B-cell precursors are not increased in Notch2IC//CD19Cre+/− mice. Splenic B cells isolated by CD43+ depletion were stained with antibodies specific for CD21/35, IgM, CD23, and AA4.1 and were analyzed by flow cytometry. Plots in the left panel are lymphocyte-gated and display percentages of cells belonging to fraction I to III (Fr. I, II, III) according to Allman and colleagues21,22 ; IgMhighCD21/35low/int cells (Fr. I); IgMlow/intCD21/35int cells (Fr. II); IgMhighCD21/35high cells (Fr. III). Numbers in the right panel display the frequency of events as a function of the indicated parent gate, which is stated above. Fr. I harbors T1 and T2 B cells; Fr. II, T3 and Fo B cells as well as potential MZ B-cell precursors* (MZ Pre*); and Fr. III, MZ B cells and conventional MZ B-cell precursors. Data are representative for 3 independent experiments.
The overall follicular structure with the respective B- and T-cell zones as well as the MZ was retained in Notch2IC//CD19Cre+/− mice (Figure 3B). However, the size of the MZ was strongly enlarged, whereas the Fo B-cell zone was significantly diminished in transgenic animals versus control littermates. hCD2+ cells were predominantly located in the splenic MZ, but they were also partially found inside the follicles (Figure 3C). In contrast to controls, in which a strong CD1d staining was only detected outside the follicles in the MZ, B cells inside and outside of the follicles were stained in the same intensity in Notch2IC-expressing mice (Figure 3D), suggesting that the B cells located inside the follicles in mutant mice are rather MZ B cells or MZ B-cell precursors than real Fo B cells.
It is controversially discussed at which developmental B-cell stage Fo B and MZ B cells branch off from each other. The comparison of the transitional B-cell compartment (AA4.1+ B cells) in mutant and control mice showed a higher portion of T1 B cells in Notch2IC//CD19Cre+/− mice than in control animals (Table 1; Figure 3E). The percentage of hCD2+ cells peaked with 70% in T1 B cells, decreased in T2 and T3 B cells to < 50%, reaching > 95% in MZ and 26% in Fo B cells. The accumulation of T1 B cells and the higher percentage of hCD2 expression in T1 compared with T2 B cells suggested that in Notch2IC//CD19Cre+/− mice, MZ B cells branch off mainly from T1 B cells. Despite the strong enlargement of the MZ B-cell compartment in Notch2IC//CD19Cre+/− mice, the number of MZ B-cell precursors defined as IgMhighCD21/35highAA4.1lowCD23+ cells21,22 was not increased (Figure 3E). Instead, a population with the phenotype IgM+CD21/35+AA4.1lowCD23− was found in high numbers. These data suggest that T1 B cells expressing Notch2IC differentiate into MZ B cells, probably through a precursor stage with an IgM+CD21/35+AA4.1lowCD23− phenotype.
Notch2IC-expressing B cells are hyperresponsive to LPS and α-CD40 stimulation in vitro
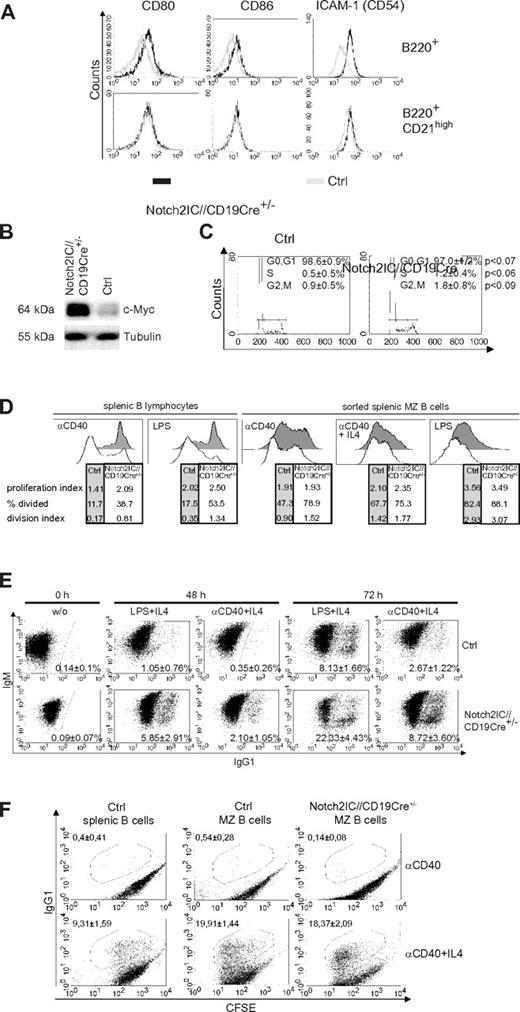
Compared with control cells, B cells of Notch2IC//CD19Cre+/− mice displayed increased expression of the activation markers CD80, CD86, and the adhesion molecule ICAM-1 (Figure 4A) as well as increased c-Myc protein levels (Figure 4B). The surface expression levels of CD80, CD86, and ICAM-1 in Notch2IC knock-in B cells were comparable to that of control MZ B cells. Directly after ex vivo isolation, the percentages of B cells in the S and G2/M phase were slightly increased in Notch2IC-expressing mice compared with controls (Figure 4C), suggesting slightly enhanced proliferation of Notch2IC+ B cells in vivo. Culturing the cells for 5 days in vitro without stimulation resulted in similar survival of Notch2IC and control B cells (supplemental Figure 6A). CFSE labeling showed that in comparison to controls, Notch2IC-expressing B cells proliferated slightly better without stimulation (supplemental Figure 6B) but displayed a considerably higher proliferation index after stimulation with α-CD40 or LPS (Figure 4D). To find out whether this difference is mainly a result of the enhanced proliferative potential of MZ B cells in comparison to Fo B cells, the experiment was repeated with sorted MZ B cells of control and Notch2IC//CD19Cre+/− mice, resulting in a comparable proliferation index after α-CD40, α-CD40+IL-4, and LPS stimulation. Nevertheless, Notch2IC-expressing cells proliferated slightly better than control MZ B cells, in particular after CD40 stimulation. In comparison to control B cells the fraction of IgG1 class-switched cells was enlarged after α-CD40+IL-4 and LPS+IL-4 stimulation (Figure 4E). However, this difference is caused by the MZ B-cell phenotype of Notch2IC-expressing B cells, because similar percentages of IgG1+ cells were detected after stimulation of sorted Notch2IC and control MZ B cells. These results indicate that the hyperresponsive phenotype of Notch2IC-expressing B cells is mainly because of their MZ B-cell phenotype.
Notch2IC-expressing B cells are preactivated and hyperresponsive to LPS and α-CD40 stimulation in vitro. (A) Notch2IC-expressing B cells express similar levels of CD80, CD86, and ICAM-1 as wt MZ B cells. Splenocytes were stained with antibodies specific for the indicated surface markers. Histograms show overlays of surface expression of the indicated molecules on lymphocyte-gated, B220+, hCD2+ B cells from Notch2IC//CD19Cre+/− (black line) and on lymphocyte-gated, B220+ B cells from control (gray line) mice (top). Histograms in the bottom row are additionally gated on CD21high cells to compare Notch2IC-expressing MZ B/MZ B precursor cells with control MZ B/MZ B precursor cells. Data are representative for 3 independent experiments. (B) Notch2IC-expressing B cells display higher c-Myc levels in comparison to control B cells. Splenic B cells were purified from Notch2IC//CD19Cre+/− and control mice, and whole-cell extracts from unstimulated cells were subjected to immunoblot analysis with the use of an antibody specific for c-Myc. Equal protein loading was controlled by α-tubulin staining. The result is representative for 5 independent experiments. (C) Slightly enhanced proliferation of Notch2IC-expressing B cells in comparison to control B cells directly after ex vivo isolation. Splenic B cells from Notch2IC//CD19Cre+/− and control mice were stained with propidium iodide and were subjected to flow cytometry for cell-cycle analysis. Markers indicate cells in phase G0+G1 (left), S (middle), and G2+M (right) of the cell cycle. Numbers indicate the mean percentages with SDs, and P values of 4 independent experiments. (D) The considerable higher proliferation rate of Notch2IC-expressing MZ B cells in comparison to control B cells is caused by their MZ B-cell phenotype. Splenic B cells or sorted MZ B cells of Notch2IC//CD19Cre+/− and control mice were labeled with CFSE and cultured for 3 days with the indicated stimuli. After 3 days, proliferation profiles of propidium iodide–negative cells were assessed by flow cytometric analysis and are displayed in the histograms. The tables under each histogram show the proliferation index (average number of divisions of proliferating cells), percentage divided (percentage of cells that initially start to divide), and the division index (average number of divisions of all cells). Values were calculated with the FlowJo Version 8.8.6 software. Numbers indicate values of 1 representative of 4 (splenic B lymphocytes) or 3 (sorted splenic MZ B cells) independent experiments. MZ B cells were sorted with a FACS Aria after staining of the surface markers B220, CD21, and CD23. In the case of sorted MZ B cells as controls either wt or CD19Cre+/− B cells were used. Both controls displayed the same proliferation abilities. Before cell sorting the cells were enriched by depleting CD43+ and CD23+ cells with magnetic beads. (E) After stimulation, switching to IgG1 is enhanced in Notch2IC-expressing B cells in comparison to control B cells. Splenic B cells of Notch2IC//CD19Cre+/− and control mice were cultured with α-CD40 and IL-4, LPS and IL-4, or without stimulation (w/o). After indicated culture times, cells were stained for IgM, IgG1, and hCD2. Numbers indicate mean percentages and SDs of IgG1+ control B cells and IgG1+, hCD2+ Notch2IC-expressing B cells of 3 independent experiments. Only propidium iodide–negative cells were included in the analysis. (F) The switching activity is similar after stimulation of sorted MZ B cells from Notch2IC//CD19Cre+/− and control mice. MZ B cells were sorted as described in panel C and cultured with α-CD40 or α-CD40+IL-4 for 3 days. Unsorted splenic B cells from control mice were included. Numbers indicate mean percentages of 3 independent experiments and SDs.
Notch2IC-expressing B cells are preactivated and hyperresponsive to LPS and α-CD40 stimulation in vitro. (A) Notch2IC-expressing B cells express similar levels of CD80, CD86, and ICAM-1 as wt MZ B cells. Splenocytes were stained with antibodies specific for the indicated surface markers. Histograms show overlays of surface expression of the indicated molecules on lymphocyte-gated, B220+, hCD2+ B cells from Notch2IC//CD19Cre+/− (black line) and on lymphocyte-gated, B220+ B cells from control (gray line) mice (top). Histograms in the bottom row are additionally gated on CD21high cells to compare Notch2IC-expressing MZ B/MZ B precursor cells with control MZ B/MZ B precursor cells. Data are representative for 3 independent experiments. (B) Notch2IC-expressing B cells display higher c-Myc levels in comparison to control B cells. Splenic B cells were purified from Notch2IC//CD19Cre+/− and control mice, and whole-cell extracts from unstimulated cells were subjected to immunoblot analysis with the use of an antibody specific for c-Myc. Equal protein loading was controlled by α-tubulin staining. The result is representative for 5 independent experiments. (C) Slightly enhanced proliferation of Notch2IC-expressing B cells in comparison to control B cells directly after ex vivo isolation. Splenic B cells from Notch2IC//CD19Cre+/− and control mice were stained with propidium iodide and were subjected to flow cytometry for cell-cycle analysis. Markers indicate cells in phase G0+G1 (left), S (middle), and G2+M (right) of the cell cycle. Numbers indicate the mean percentages with SDs, and P values of 4 independent experiments. (D) The considerable higher proliferation rate of Notch2IC-expressing MZ B cells in comparison to control B cells is caused by their MZ B-cell phenotype. Splenic B cells or sorted MZ B cells of Notch2IC//CD19Cre+/− and control mice were labeled with CFSE and cultured for 3 days with the indicated stimuli. After 3 days, proliferation profiles of propidium iodide–negative cells were assessed by flow cytometric analysis and are displayed in the histograms. The tables under each histogram show the proliferation index (average number of divisions of proliferating cells), percentage divided (percentage of cells that initially start to divide), and the division index (average number of divisions of all cells). Values were calculated with the FlowJo Version 8.8.6 software. Numbers indicate values of 1 representative of 4 (splenic B lymphocytes) or 3 (sorted splenic MZ B cells) independent experiments. MZ B cells were sorted with a FACS Aria after staining of the surface markers B220, CD21, and CD23. In the case of sorted MZ B cells as controls either wt or CD19Cre+/− B cells were used. Both controls displayed the same proliferation abilities. Before cell sorting the cells were enriched by depleting CD43+ and CD23+ cells with magnetic beads. (E) After stimulation, switching to IgG1 is enhanced in Notch2IC-expressing B cells in comparison to control B cells. Splenic B cells of Notch2IC//CD19Cre+/− and control mice were cultured with α-CD40 and IL-4, LPS and IL-4, or without stimulation (w/o). After indicated culture times, cells were stained for IgM, IgG1, and hCD2. Numbers indicate mean percentages and SDs of IgG1+ control B cells and IgG1+, hCD2+ Notch2IC-expressing B cells of 3 independent experiments. Only propidium iodide–negative cells were included in the analysis. (F) The switching activity is similar after stimulation of sorted MZ B cells from Notch2IC//CD19Cre+/− and control mice. MZ B cells were sorted as described in panel C and cultured with α-CD40 or α-CD40+IL-4 for 3 days. Unsorted splenic B cells from control mice were included. Numbers indicate mean percentages of 3 independent experiments and SDs.
After immunization with the TD antigen NP-CGG germinal center formation was nearly absent and NP-specific IgM and IgG1 titers were clearly diminished (supplemental Figure 7A). Similarly, after immunization with the TI type2 antigen NP-Ficoll, antigen-specific antibodies, especially class-switched IgG3, were lower than in controls (supplemental Figure 7B). These results are in line with a significant reduction of total IgG3 titers in unimmunized Notch2IC mice (supplemental Figure 7C). These data indicate that, despite their preactivated state, Notch2IC-expressing B cells are not able to respond to TD and TI (2) antigens, suggesting that constitutive Notch2-signaling is not compatible with a proper immune response.
Basal activity of crucial signaling pathways is similar in Notch2IC//CD19Cre+/− and control MZ B cells
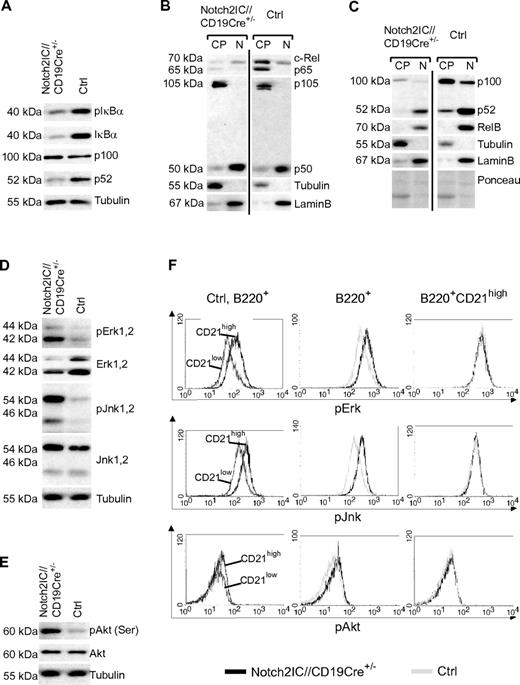
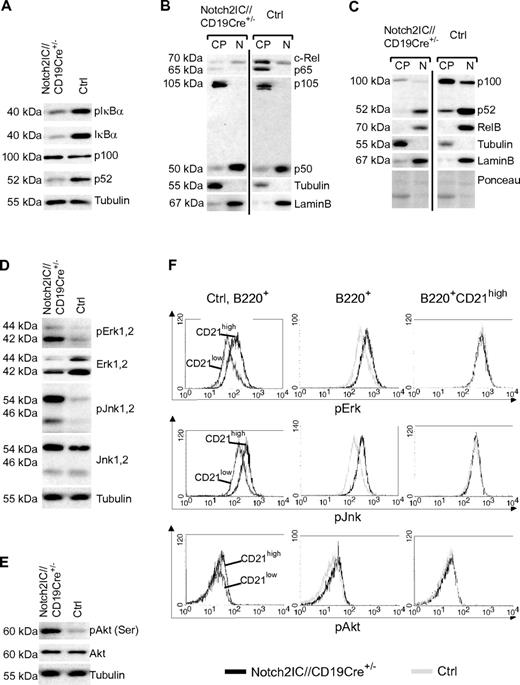
Next, we examined whether the activation of Notch2IC-expressing B cells in vitro is reflected in a higher basal activity of certain signaling pathways such as NF-κB, MAP kinase, or PI3K/Akt signaling. Both the levels of phosphorylated and nonphosphorylated IκBα as well as the cytoplasmic levels of p65 and c-Rel were clearly decreased in Notch2IC-expressing B cells (Figure 5A). However, the levels of canonical NF-κB components in the nucleuswere similar in mutant and control mice, suggesting a comparable basal activity of the canonical NF-κB pathway (Figure 5B). In contrast, strongly decreased p52 protein levels in comparison to control B cells pointed to a reduced processing of p100 and therefore to a reduced basal activity of the noncanonical NF-κB pathway (Figure 5A). This was confirmed by nuclear fractionation assays, in which we detected lower levels of p52 and RelB in the nuclear fractions of Notch2IC-expressing B cells in comparison to controls (Figure 5C). Thus, hyperactivation of Notch2IC-expressing B cells did not appear to be reflected in an increased basal NF-κB activity. However, we observed an increased phosphorylation of the MAPKs Erk and Jnk as well as of Akt in Notch2IC-expressing B cells compared with controls (Figure 5D-E). Intracellular stainings showed a higher phosphorylation of Erk, Jnk, and Akt in control MZ B cells in comparison to Fo B cells, whereas the phosphorylation status was comparable in Notch2IC-expressing and control MZ B cells (Figure 5F). Thus, Notch2IC-expressing splenic B cells reflect wild-type (wt) MZ B cells also in their increased activation of Erk, Jnk, and Akt.
Activated signaling pathways in Notch2IC-expressing B cells. (A) Decreased levels of pIκBα, IκBα, and p52 in Notch2IC-expressing B cells. Whole-cell extracts from unstimulated cells were subjected to immunoblot analysis with the use of antibodies specific for pIκBα (Ser32/36), IκBα, or an antibody specific for p100/p52. Equal protein loading was controlled by α-tubulin staining. The result is representative for 5 independent experiments. (B-C) The basal activity of the noncanonical NF-κB pathway is decreased in Notch2IC-expressing B cells. Cytoplasmic (CP) and nuclear (N) levels of NF-κB components of splenic B cells from Notch2IC//CD19Cre+/− and control mice were analyzed by immunoblot with the use of the indicated antibodies. Purity of cytoplasmic and nuclear extracts and equal protein loading were verified by α-tubulin, α-LaminB, and Ponceau staining, respectively. The experiment was performed 4 times. (D-E) In comparison to splenic control B cells, the basal activity of MAPKs and Akt is increased in Notch2IC-expressing B cells. Whole-cell extracts from unstimulated cells were subjected to immunoblot analysis with the use of antibodies specific for pJnk1/2 (Thr183/Tyr185), pErk1/2 (Thr202/Tyr204), pAkt (pS473), and the corresponding nonphosphorylated forms. Equal protein loading was controlled by α-tubulin staining. The result is representative for 5 independent experiments. (F) The phosphorylation of Erk, Jnk, and Akt is higher in wt MZ B cells in comparison to Fo B cells, but it is comparable in Notch2IC-expressing and wt MZ B cells. Splenocytes from Notch2IC//CD19Cre+/− and control mice were fixed, permeabilized, and intracellularly stained with antibodies specific for the indicated phosphorylated signaling molecules and analyzed by FACS. Histograms show overlays of the abundance of the indicated molecules on lymphocyte-gated, B220+ B cells comparing (1) CD21high (dark gray) and CD21low (black) control B-cell populations (left), (2) hCD2+ Notch2IC//CD19Cre+/− (black line) and control (gray line) total B cells (middle), or (3) hCD2+ Notch2IC//CD19Cre+/− (black line) and control (gray line) CD21high B cells (right). Data are representative for 4 independent experiments.
Activated signaling pathways in Notch2IC-expressing B cells. (A) Decreased levels of pIκBα, IκBα, and p52 in Notch2IC-expressing B cells. Whole-cell extracts from unstimulated cells were subjected to immunoblot analysis with the use of antibodies specific for pIκBα (Ser32/36), IκBα, or an antibody specific for p100/p52. Equal protein loading was controlled by α-tubulin staining. The result is representative for 5 independent experiments. (B-C) The basal activity of the noncanonical NF-κB pathway is decreased in Notch2IC-expressing B cells. Cytoplasmic (CP) and nuclear (N) levels of NF-κB components of splenic B cells from Notch2IC//CD19Cre+/− and control mice were analyzed by immunoblot with the use of the indicated antibodies. Purity of cytoplasmic and nuclear extracts and equal protein loading were verified by α-tubulin, α-LaminB, and Ponceau staining, respectively. The experiment was performed 4 times. (D-E) In comparison to splenic control B cells, the basal activity of MAPKs and Akt is increased in Notch2IC-expressing B cells. Whole-cell extracts from unstimulated cells were subjected to immunoblot analysis with the use of antibodies specific for pJnk1/2 (Thr183/Tyr185), pErk1/2 (Thr202/Tyr204), pAkt (pS473), and the corresponding nonphosphorylated forms. Equal protein loading was controlled by α-tubulin staining. The result is representative for 5 independent experiments. (F) The phosphorylation of Erk, Jnk, and Akt is higher in wt MZ B cells in comparison to Fo B cells, but it is comparable in Notch2IC-expressing and wt MZ B cells. Splenocytes from Notch2IC//CD19Cre+/− and control mice were fixed, permeabilized, and intracellularly stained with antibodies specific for the indicated phosphorylated signaling molecules and analyzed by FACS. Histograms show overlays of the abundance of the indicated molecules on lymphocyte-gated, B220+ B cells comparing (1) CD21high (dark gray) and CD21low (black) control B-cell populations (left), (2) hCD2+ Notch2IC//CD19Cre+/− (black line) and control (gray line) total B cells (middle), or (3) hCD2+ Notch2IC//CD19Cre+/− (black line) and control (gray line) CD21high B cells (right). Data are representative for 4 independent experiments.
Constitutive Notch2 signaling overcomes CD19 deficiency during MZ B-cell differentiation
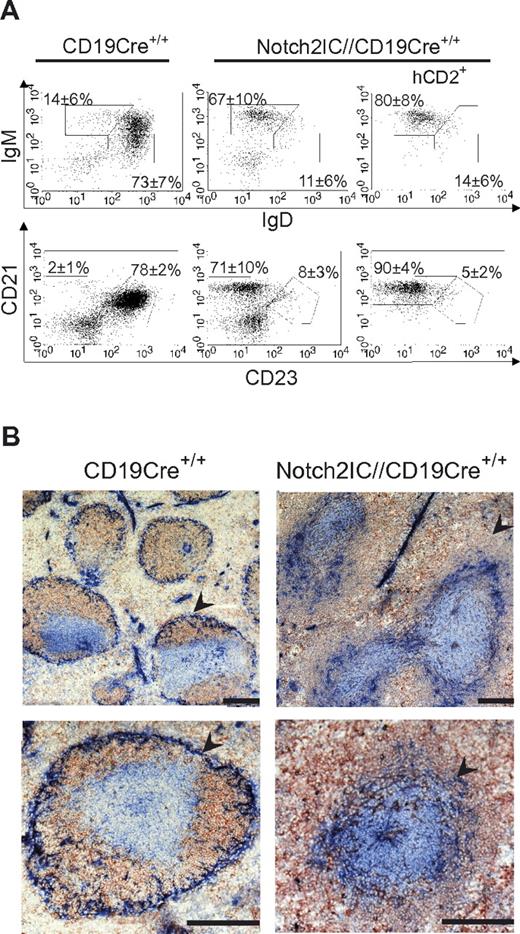
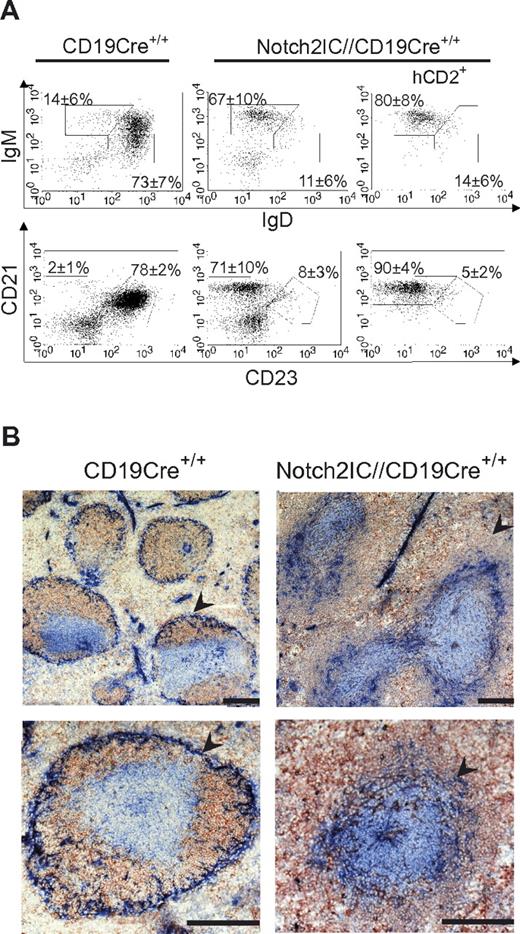
CD19 functions as a coreceptor of the BCR and is required for the generation of MZ B cells, because these cells are absent in CD19-deficient mice.23-26 To analyze whether constitutive Notch2 signaling overcomes CD19 deficiency during the generation of MZ B cells, Notch2ICflSTOP mice were crossed to CD19-Cre homozygous mice (CD19Cre+/+), which harbor the cre gene in both alleles of cd19 and therefore represent a CD19 knock-out. FACS analysis showed that, also in the absence of CD19, all B cells were shifted to the MZ B-cell compartment (Figure 6A). In splenic sections Notch2IC//CD19Cre+/+ mice displayed a similar follicular organization as Notch2IC//CD19Cre+/− mice (Figure 6B), including an enlarged MZ. However, in contrast to Notch2IC//CD19Cre+/− mice, no B cells were detected inside the follicle in Notch2IC//CD19Cre+/+ mice, most probably because of the higher deletion efficiency in T1 and T2 B cells (Table 1 and Table 2). The strong reduction of T2 and Fo B cells in Notch2IC//CD19Cre+/+ compared with CD19Cre+/+ controls (Table 2) suggests that, in these mice, most of the T1 B cells do not proceed to the T2 B-cell stage but develop directly to MZ B cells. Thus, the MZ B-cell population was not only restored but also strongly enlarged in Notch2IC//CD19Cre+/+ mice compared with control mice. B cells isolated from Notch2IC//CD19Cre+/+ mice displayed the same phenotype as Notch2IC-expressing, CD19-proficient B cells. Thus, these cells were enlarged in size, displayed a higher expression of the activation markers CD86 and CD36 and higher c-Myc levels, and showed enhanced proliferation after α-CD40 and LPS stimulation in vitro (supplemental Figure 8A-C). Despite the CD19 deficiency, the phosphorylated forms of the MAPKs Erk and Jnk remained increased (supplemental Figure 8D).
Notch2IC induces MZ B-cell development despite the absence of CD19. (A) In the spleen, most of Notch2IC-expressing, CD19-deficient B cells adopt a MZ B-cell phenotype. Splenic lymphocytes from mice of the indicated genotypes were analyzed by flow cytometry for the expression of IgM and IgD (top) or CD21 and CD23 (bottom). Numbers indicate mean percentages and SDs of lymphocyte-gated populations of B220+ B cells. The plots are pregated on lymphocytes and B220+ cells. The right panel is additionally gated on hCD2, displaying the distribution of Notch2IC-expressing cells. Fo B cells (IgM+IgD+), MZ B and transitional B cells (IgM+IgDlow; top); Fo B cells (CD21intCD23+) and MZ B cells (CD21highCD23low; bottom). The calculation is based on 3 independent experiments. (B) Notch2IC-expressing, CD19-deficient B cells are located in the MZ. Immunohistochemical staining of splenic cryosections from mice of the indicated genotypes for MOMA-1+ metallophilic macrophages (α-MOMA-1; blue), IgM+ B cells (α-IgM; red), and CD3+ T cells (α-CD3; blue). The MZ is indicated by arrows. Scale bar: 250 μm.
Notch2IC induces MZ B-cell development despite the absence of CD19. (A) In the spleen, most of Notch2IC-expressing, CD19-deficient B cells adopt a MZ B-cell phenotype. Splenic lymphocytes from mice of the indicated genotypes were analyzed by flow cytometry for the expression of IgM and IgD (top) or CD21 and CD23 (bottom). Numbers indicate mean percentages and SDs of lymphocyte-gated populations of B220+ B cells. The plots are pregated on lymphocytes and B220+ cells. The right panel is additionally gated on hCD2, displaying the distribution of Notch2IC-expressing cells. Fo B cells (IgM+IgD+), MZ B and transitional B cells (IgM+IgDlow; top); Fo B cells (CD21intCD23+) and MZ B cells (CD21highCD23low; bottom). The calculation is based on 3 independent experiments. (B) Notch2IC-expressing, CD19-deficient B cells are located in the MZ. Immunohistochemical staining of splenic cryosections from mice of the indicated genotypes for MOMA-1+ metallophilic macrophages (α-MOMA-1; blue), IgM+ B cells (α-IgM; red), and CD3+ T cells (α-CD3; blue). The MZ is indicated by arrows. Scale bar: 250 μm.
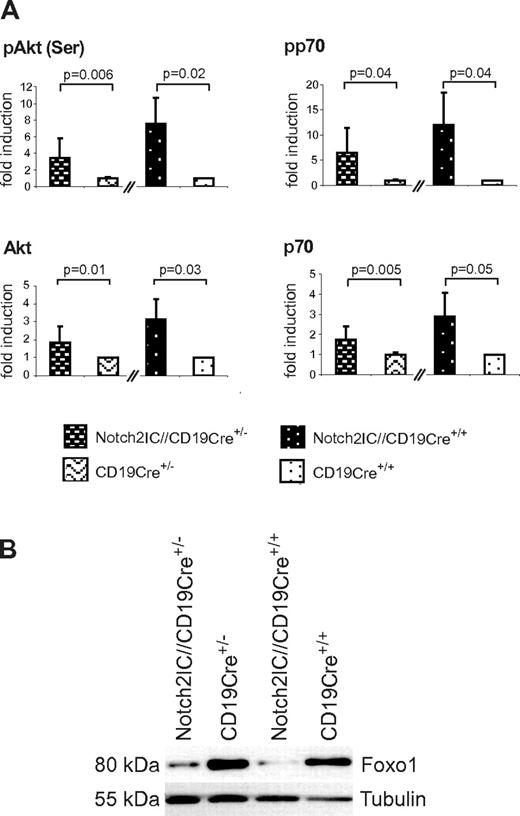
Basal Akt phosphorylation as well as phosphorylation of the Akt downstream target p70S6K were increased in Notch2IC-expressing B cells compared with the controls (Figure 7A). Moreover, the transcription factor Foxo1, which is negatively regulated by PI3K/Akt signaling,27-29 was found to be clearly diminished in Notch2IC-expressing B cells independently of their CD19 status (Figure 7B). These data indicate that constitutive Notch2 activity induces MZ B-cell lineage decision independently of CD19 and that the preactivated state of Notch2IC-expressing B cells is completely maintained in the absence of CD19.
CD19-deficient, Notch2IC-expressing B cells show increased phosphorylation of Akt and regulation of Akt downstream targets. (A) Graphs show mean values with SDs of the fold induction of indicated phosphorylated and nonphosphorylated proteins in relation to GSK3β, determined by densitometry of Western blots. Values from Notch2IC//CD19Cre+/− mice are displayed as n-fold of values from CD19Cre+/− control mice, which were set to 1. Analogously, values from Notch2IC//CD19Cre+/+ mice are displayed as n-fold of values from CD19Cre+/+ control mice, which were set to 1. Mean values were calculated from 4 independent experiments. (B) In comparison to control B cells, Foxo1 levels are decreased in Notch2IC-expressing B cells. Splenic B cells were purified from mice with indicated genotypes, and whole-cell extracts from unstimulated cells were subjected to immunoblot analysis with the use of antibodies specific for Foxo1. Equal protein loading was controlled by α-tubulin staining. The result is representative for 4 independent experiments.
CD19-deficient, Notch2IC-expressing B cells show increased phosphorylation of Akt and regulation of Akt downstream targets. (A) Graphs show mean values with SDs of the fold induction of indicated phosphorylated and nonphosphorylated proteins in relation to GSK3β, determined by densitometry of Western blots. Values from Notch2IC//CD19Cre+/− mice are displayed as n-fold of values from CD19Cre+/− control mice, which were set to 1. Analogously, values from Notch2IC//CD19Cre+/+ mice are displayed as n-fold of values from CD19Cre+/+ control mice, which were set to 1. Mean values were calculated from 4 independent experiments. (B) In comparison to control B cells, Foxo1 levels are decreased in Notch2IC-expressing B cells. Splenic B cells were purified from mice with indicated genotypes, and whole-cell extracts from unstimulated cells were subjected to immunoblot analysis with the use of antibodies specific for Foxo1. Equal protein loading was controlled by α-tubulin staining. The result is representative for 4 independent experiments.
Discussion
Gene ablations showed that beside BCR, PI3K/Akt, and NF-κB signaling, Notch2 signaling is critically involved in MZ B-cell differentiation or maintenance or both.7,11-13,22 However, until now the effects of constitutive Notch signaling on B-cell differentiation and activation have not been investigated.
Here, we describe the generation and analysis of a transgenic mouse strain, expressing Notch2IC on Cre-mediated recombination in B cells. Our data show that the outcome of constitutive Notch2 signaling highly depends on the cellular differentiation stage: Notch2IC expression in very early B-lymphoid stages, which are not irreversibly committed to the B-cell fate, blocked B-cell development completely and led to the formation of an aberrant CD4+/CD8+ T-cell population in the BM.
A similar phenotype has been reported after the transplantation of Notch1IC-transduced BM progenitors into irradiated mice,10 showing that Notch1IC and Notch2IC are acting redundantly in driving aberrant T-cell differentiation in early lymphoid progenitor cells. These data further support the hypothesis that Notch-dependent cell fate decisions are rather mediated by receptor/ligand specificity, which are ensured by tissue-specific compartmentalization of different Delta and Notch family members than by different Notch1IC and Notch2IC target genes.
Witt et al30 reported that retroviral transduction of BM cells with Notch2IC resulted in a block of B-cell development at the large pre-B-cell stage but selectively promoted B1 B-cell differentiation. In our case, Notch2IC expression induced by mb1Cre blocked B-cell development already at the pro-B-cell stage and equally affected the generation of conventional B2 and B1 B cells. The difference might be explained by differences in the onset and strength of Notch2IC expression.
Notch2IC expression in cells that are already clearly committed to the B-cell lineage resulted in a strong shift toward MZ B-cell differentiation at the expense of Fo B cells in the spleen. Although B-cell development in the BM turned out to be normal in Notch2IC//CD19Cre+/− mice, the very low deletion efficiency in pro- and pre-B cells suggests a negative selection of early B-cell stages expressing Notch2IC. In immature B cells, constitutive Notch2 signaling seems not to interfere with normal B-cell development. Accordingly, normal percentages of immature B cells were detected in the BM of Notch2IC//CD19Cre+/− mice, expressing hCD2 in > 40%. Because B cells with a MZ B-cell phenotype were barely observed in the BM of these mice, we assume that the BM does not offer the appropriate environment for MZ B-cell differentiation or that factors permissive for the generation of a MZ B-cell phenotype are still missing in the immature B-cell subset. Alternatively, B cells adopting a MZ B-cell phenotype immediately leave the BM and migrate to the spleen.
Because the deletion efficiency increased from immature B cells to T1 B cells and decreased again in T2 B cells, we propose that most of the Notch2IC-expressing MZ B cells are generated from T1 B cells. This is in accordance with other reports suggesting that MZ B cells mainly branch off from T1 B cells.31,32 In the spleen, most of the Notch2IC-expressing B cells adopted a MZ B-cell phenotype and were localized in the MZ. We observed only a few hCD2+ Fo B cells that expressed higher levels of IgM and CD21 than control Fo B cells. This population might correspond to the hCD2+CD1dhigh cells that were detected inside the B-cell follicle. This residual Fo B cell-like population might either reflect MZ B-cell precursors or IgMhigh Fo-II B cells, which have been postulated to serve as a reservoir for replenishing the MZ B-cell compartment.7,33 Those Fo-II B cells could develop out of Fo-I B cells receiving a Notch2 signal.
The Notch2IC-expressing B cells resemble wt MZ B cells in respect to the expression of surface markers and their hyperresponsiveness in vitro. Hence, Notch2IC//CD19Cre mice might be a useful tool to isolate MZ B cells in large amounts, allowing the comparison of Fo B and MZ B cells in more detail. We used these mice to further study the basal activity of signaling pathways that are active in MZ B cells. We could confirm several findings previously published for wt MZ B cells. (1) Compared with Fo B cells, IκBα levels were found to be diminished in MZ B cells, without apparent activation of the canonical NF-κB pathway.34,35 (2) Enhanced basal phosphorylation of Akt kinase and higher basal levels of c-Myc have been reported for murine primary MZ B cells in comparison to Fo B cells.34 (3) Our data add to these previous findings that basal phosphorylation of Erk and Jnk is increased in Notch2IC knock-in and control MZ B cells in comparison to Fo B cells. It is unclear whether the decreased basal noncanonical NF-κB activity in Notch2IC-expressing B cells is also a characteristic feature of MZ B cells. Thus, the overcrowded MZ B-cell compartment in Notch2IC//CD19Cre+/− mice might not allow that all MZ B cells are properly triggered by surrounding cells providing ligands for BAFF-R or CD40, which are mainly responsible for the activation of the noncanonical NF-κB signaling in B cells.
Despite their preactivated phenotype Notch2IC-expressing B cells were impaired in their immune response both to the TD antigen NP-CGG and TI type2 antigen NP-Ficoll. Especially, the finding that Notch2IC-expressing B cells do not respond to TI type2 antigens was unexpected, because it is well established that MZ B cells are the main players during TI-immune responses.36 These data suggest that constitutive Notch2 signaling interferes with the germinal center reaction and the terminal differentiation of B cells and imply that in MZ B cells Notch2 signaling has to be switched off to allow plasma cell differentiation.
The almost identical phenotypes of Notch2IC-expressing B cells and wt MZ B cells indicate active endogenous Notch2 signaling in wt MZ B cells, which might be, as previously suggested, essential for the maintenance of the MZ B-cell pool.37 Under normal circumstances, MZ B-cell precursors and MZ B cells are thought to compete for the interaction with limited Dll1 ligands, expressed on endothelial cells in the splenic red pulp.31,38 The independency of the Dll1 ligand interaction by Notch2IC expression may enable the dramatic enlargement of the MZ, which has not been observed in any other mutant mouse strain before. Moreover, this ligand independency might allow the occurrence of MZ-like B cells in the lymph node, which may arise from either transitional or Fo B cells on initiated Notch2IC expression.
We show that in the presence of constitutive Notch2 activity, the MZ B-cell lineage decision and differentiation are independent of the BCR coreceptor CD19. Moreover, the preactivated state of Notch2IC-expressing B cells, including the hyperactivation of MAPK and PI3K/Akt signaling pathways, was completely unchanged in CD19-deficient, Notch2IC knock-in cells. Furthermore, the protein level of the transcription factor Foxo1, which is negatively regulated by Akt signaling,27-29 was clearly down-regulated in Notch2IC-expressing B cells in a CD19-independent manner. However, it is still elusive how Akt is hyperactivated in the Notch2IC-expressing MZ B cells in a CD19-independent manner. Either Notch2IC directly contributes to the activation of PI3K/Akt signaling by transcriptionally modulating the expression of components that regulate PI3K/Akt signaling pathway or PI3K/Akt is constantly activated downstream of integrins and S1P receptors, which are highly expressed on MZ B cells.
Aged ≤ 1 year none of the Notch2IC//CD19 mice developed obvious signs of lymphoma (data not shown), suggesting that constitutive Notch2 signaling in B cells is not sufficient to drive B-cell lymphomagenesis. This is in accordance with our in vitro data showing that Notch2IC-expressing B cells do not spontaneously proliferate. However, after stimulation with α-CD40 Notch2IC-expressing B cells displayed an enhanced division index in comparison to control MZ B cells. This is in accordance with previous data showing that CD40 and LMP1 (Epstein-Barr viral latent membrane protein 1, mimicking a constitutive active CD40 receptor) cooperate with Notch signaling in inducing B-cell proliferation.39-41 It will be interesting to see whether deregulated Notch and CD40 signaling cooperatively drive B-cell lymphomagenesis.
Collectively, our data provide evidence that Notch2 signaling acts as a binary switch that drives, depending on the cellular background, either T-cell development or the generation of MZ B cells. Although constitutive Notch signaling has a strong oncogenic effect in T cells, it seems not to be sufficient to drive B-cell lymphomagenesis. Further studies will be necessary to elucidate the crucial downstream components mediating MZ B-cell differentiation and to further elucidate the contribution of deregulated Notch-signaling in B-cell lymphomagenesis.
The online version of this article contains a data supplement.
The publication costs of this article were defrayed in part by page charge payment. Therefore, and solely to indicate this fact, this article is hereby marked “advertisement” in accordance with 18 USC section 1734.
Acknowledgments
The authors thank Elias Hobeika and Michael Reth (MPI, Freiburg) for providing the mb1-Cre mouse strain, Dinis Calado from the Klaus Rajewsky's Laboratory for providing the pRTS-vector, Freddy Radtke for helpful discussion, and Branislav Krljanac (FLI, Jena) for helpful technical advice.
This work was supported by the Deutsche Forschungsgemeinschaft (SFB684, TRR54).
Authorship
Contribution: F.H. designed and performed experiments and assisted in writing the manuscript; S.E., C.H., G.M.-S., M.S.-S., C.J.V., and A.D. performed experiments; R.K. performed the blastocyste injection; B.M. and O.G. performed histology; and L.J.S., and U.Z.-S. designed the research and wrote the manuscript.
Conflict-of-interest disclosure: The authors declare no competing financial interests.
The current affiliation for C.H. is Genentech Inc, South San Francisco, CA.
Correspondence: Ursula Zimber-Strobl, Department of Gene Vectors, Helmholtz Center Munich, Marchioninistr 25, D-81377 Munich, Germany; e-mail: strobl@helmholtz-muenchen.de.
References
Author notes
L.J.S. and U.Z.-S. contributed equally to this study.

