Abstract
Mouse innate-like B cells are a heterogeneous collection of multifunctional cells that control infection, play housekeeping roles, contribute to adaptive immunity, and suppress inflammation. We show that, among leukocytes, chemokine internalization by the D6 receptor is a unique and universal feature of all known innate-like B-cell populations and, to our knowledge, the most effective unifying marker of these cells. Moreover, we identify novel D6active B1-cell subsets, including those we term B1d, which lack CD5 and CD11b but exhibit typical B1-cell properties, including spontaneous ex vivo production of IgM, IL-10, and anti-phosphorylcholine antibody. The unprecedented opportunity to examine D6 on primary cells has allowed us to clarify its ligand specificity and show that, consistent with a scavenging role, D6 internalizes chemokines but cannot induce Ca2+ fluxes or chemotaxis. Unexpectedly, however, D6 can also suppress the function of CXCR5, a critical chemokine receptor in innate-like B-cell biology. This is associated with a reduction in B1 cells and circulating class-switched anti-phosphorylcholine antibody in D6-deficient mice. Therefore, in the present study, we identify a unifying marker of innate-like B cells, describe novel B1-cell subsets, reveal a dual role for D6, and provide the first evidence of defects in resting D6-deficient mice.
Introduction
There are 3 mature B-cell types in mice: follicular (FO), marginal zone (MZ), and B1.1 Despite distinct ontology, localization, and immunophenotype, MZ and B1 B cells (collectively termed innate-like B cells or IBCs) are functionally related, with restricted BCR repertoires enriched for certain host, commensal-associated, and pathogen-associated Ags (eg, phosphorylcholine or PC). Ab generation by IBCs occurs without T-cell help, somatic hypermutation, or affinity maturation, and class switching is limited. After infection, IBCs rapidly generate large amounts of low-affinity IgM, IgA, and IgG3, supplementing preexisting “natural” Abs (derived mainly from IBCs2 ), and ensuring early protection against infection.3-5 Natural Abs also aid in important housekeeping functions, including apoptotic debris removal, lipoprotein sequestration,6 and microflora regulation.2 In addition to generating Abs, IBCs can transport Ag to follicular dendritic cells, present Ag to naive T cells,7,8 and produce IL-10, a key factor in B-cell–mediated immunosuppression.9 Therefore, IBCs are multifunctional cells with critical roles in homeostasis and immune responses.
Panels of Abs are needed to identify IBC subsets. Anti-CD21 and anti-CD23 distinguish MZ B cells (CD19+CD21hiCD23lo) from FO B cells (CD19+CD21intCD23hi), and provide some resolution of B-cell progenitors (eg, MZ B-cell progenitors [MZPs] are in the CD19+CD21hiCD23hi subset).1 B1 cells, which are abundant in body cavities, are categorized as CD19+CD11b+CD23− and subdivided into developmentally and functionally distinct B1a (CD5+) and B1b (CD5−) subsets. Other body cavity B cells are usually classified as FO B cells, but there are also CD11b− B1 cells (eg, B1c, CD19+CD11b−CD5+),10 which arise earlier in ontogeny and show greater reconstitution potential than CD11b+ B1 cells.11 B1 cells undergo phenotypic changes when they leave body cavities: splenic B1 cells are CD19+IgMhiCD23loCD5+, but B1 cells elsewhere are difficult to detect.12 Some proteins (eg, CD9 and CD43) are elevated on peritoneal cavity B1a/b cells,13,14 but do not allow definitive B1-cell identification in the peritoneal cavity or anywhere else. Pan-IBC markers would have considerable utility and provide unifying insights into IBCs.
Functionally distinct lymphocyte subsets carry specific chemokine receptor repertoires.15 Trafficking of IBCs differs markedly from that of FO B cells, and their Ab-secreting capacity and survival are intimately linked to migration and adhesion.7,12,16-19 Like FO B cells, IBCs are dependent on the CXCR5 ligand CXCL13, which controls departure from the MZ7,20 and B1 entry/exit from the peritoneal cavity.12,18,21 However, CXCR5 and other IBC receptors (eg, CXCR4 and CCR7)22-24 are present throughout the B-cell compartment.15 Mouse splenic B cells express transcripts for the atypical chemokine receptor D6.25,26 In transfected cell lines, D6 binds many CC chemokines, but cannot drive chemotaxis or activate signaling pathways used by other chemokine receptors.27,28 However, D6 constitutively traffics via the surface of these cell lines to facilitate chemokine scavenging,29,30 and this is thought to be the reason for its indispensable role in regulating inflammation and the associated pathologies in mice.27,28,31,32 D6 also induces β-arrestin redistribution from cytoplasm to membrane,33,34 which, according to our previous data, is driven by chemokine-independent D6 phosphorylation and is dispensable for scavenging.34 The function of this arrestin relocalization is unclear but we have proposed that it could influence the activity of chemokine receptors coexpressed with D6 in primary cells. Notably, however, D6 function on primary cells has not been investigated. Moreover, although D6 protein is expressed by lymphatic endothelial cells, trophoblasts, and some leukocytes in humans,25,35-37 little is known about its expression in mice, because such investigations have been hampered by the lack of reliable Abs.
In the present study, we used fluorescent chemokines to provide unrivalled insight into active D6 protein expression by mouse leukocytes. Remarkably, D6 activity is a restricted and distinguishing feature of IBCs, and is to our knowledge the best unifying marker of these cells. Detailed fractionation of body cavity B cells identifies novel subsets of conventional B1 cells, defines a new CD11b− B1-cell subset (B1d), and provides a rigorous definition of body cavity FO B cells (CD19+CD11b−CD5−CD23+D6−). We also provide the first ligand-specificity profile of D6 on primary cells, reveal a dual role for D6 on IBCs, and show that D6-deficient mice carry defects in their B1-cell compartments.
Methods
Mice
Wild-type (WT) and D6-deficient mice38 on a C57BL/6J (F11) background strain were housed under specific pathogen–free conditions. Studies were approved by ethical review and licensed by the United Kingdom Home Office. Age-matched females (8-12 weeks of age) were used.
Cell isolation and culture
Cells were flushed from body cavities with PBS/2mM EDTA. Lymphoid tissue suspensions were prepared by mechanical disruption and passed through 40μm nylon mesh. Blood was collected by cardiac puncture. Red cells were lysed using 0.8% NH4Cl/10mM EDTA. Where appropriate, cells were cultured in complete medium (RPMI 1640, penicillin/streptomycin, 4mM l-glutamine, and 10% FCS). FACS-sorted B cells were cultured for 3 days at 2 × 10⁵ cells/well in 200μL of medium.
Chemokine uptake assay
Cells ( ≤ 2 × 10⁶/well) were cultured at 37°C for 60 minutes in 50μL of complete medium with 20mM HEPES, pH 7.4, containing 25nM Alexa Fluor 647–coupled human CCL2 or CCL22 (CCL2AF647 or CCL22AF647, respectively; Almac) with or without 250nM unlabeled mouse chemokine (Peprotech), and then briefly washed before immunostaining.
Flow cytometry and FACS
Cells were preincubated with Fc block (BD Biosciences) in FACS buffer (PBS, 1% FCS, 0.02% sodium azide, and 5mM EDTA) and labeled with fluorescent anti-mouse Abs, including: CD19 (ID3), CD11b (M1/70), CD5 (53-7.3), and CD23 (B3B4), each labeled along with various fluorochromes (BD Biosciences); CXCR5-biotin (2G8), CD49-biotin (R1-2), CD29-biotin (Ha2/5), CD21-PE (7G6), and IgM-PE (II/41) (BD Biosciences); CD9-APC (KMC8), CD43-biotin (R2/60), and B220-AF647 (RA3-6B2) (eBiosciences); and isotype controls (BD Biosciences or eBioscience). Streptavidin-APC (BD Biosciences) detected biotinylated Abs. Dead cells were labeled using DAPI (Invitrogen) or Via-Probe (BD Biosciences). With goat anti–mouse D6 or isotype control (Abcam), cells were blocked with Fc block and donkey serum, and PE-conjugated donkey anti–goat IgG (Abcam) was used for detection. Ab-labeled cells were analyzed using FACSCalibur or MACSQuant cytometers, or sorted on a FACSAria. Data were analyzed using FlowJo Version 9.2 software (TreeStar) with populations defined by size, viability, and “fluorescence minus one” isotype controls.
Ca2+ flux
Peritoneal cavity cells (4 × 10⁶/mL) were labeled in calcium buffer (145mM NaCl, 5mM KCl, 1mM MgCl2, 10mM HEPES, 1mM CaCl2, 0.18% glucose, and 0.2% BSA, pH 7.4) with Fura-Red (4μM) and Fluo-4 (2μM) (Invitrogen) at 37°C for 30 minutes, washed twice, resuspended in calcium buffer, incubated at room temperature for 30 minutes, and then stained with Abs. Samples were incubated at 37°C for 10 minutes before flow cytometry. Baseline fluorescence was determined (30-45 seconds), CXCL13 (to 100nM) and/or CCL22 (to 50nM) was added, and then ionomycin was added (to 1μM). [Ca2+] is expressed as the Fluo-4/Fura-Red mean fluorescence intensity ratio. Data were analyzed using FlowJo software.
Quantitative PCR
RNA was extracted using RNeasy columns with DNAse treatment (QIAGEN), cDNA was generated (AffinityScript; Stratagene) and quantitative PCR was performed using the D6-specific TaqMan assay (mm0044555_m1) on a Prism 7900HT PCR system (Applied Biosystems). GAPDH-specific probes were used to normalize D6 expression. A fold change value was calculated using the delta-delta-cycle threshold method, with splenic FO or peritoneal cavity CD11b−CD5− B cells as calibrators set to 1.
Chemotaxis assay
Peritoneal cavity cells were resuspended in chemotaxis buffer (RPMI 1640 and 0.5% BSA), and B-cell subset composition determined was by FACS. 5 × 10⁵ cells were placed in the upper chambers of 24-well Transwell plates (3μm filters; Corning) above 600μL of chemotaxis buffer with or without chemokine (Peprotech), and incubated at 37°C and 5% CO2 for 3 hours. Migrated cells were stained with Abs, enumerated by FACS using CountBrite beads (Invitrogen), and converted into the percentage of input for each subset.
ELISA
IL-10 was quantified using a mouse IL-10 ELISA (Insight Genomics). For serum Ig, wells were coated with 5μg/mL of anti-mouse IgM, IgG3, or IgA polyclonal antibody (Bethyl), washed (PBS/0.05% Tween), blocked with PBS/3% BSA, and sera or supernatants were added. After 1 hour, wells were washed and captured Ag was detected using peroxidase-conjugated anti-mouse IgM (Paris Anticorps), IgG3, or IgA (Bethyl). ELISAs were developed using Sureblue (Insight Genomics). Total Ig was quantified relative to a mouse reference serum (Bethyl). For PC-specific Abs, plates were coated with PC-conjugated BSA (Biosearch) normalized with a reference serum.
Microscopy
FACS-sorted cells were cytospun onto Polysine slides (VWR International), stained (hematoxylin/eosin), and analyzed on an Axiostar Plus microscope with Axiovision Version 4.6 software.
Statistics
Data were analyzed with the unpaired Student t test or ANOVA using Prism 4 software (GraphPad).
Results
D6-mediated chemokine uptake is restricted to MZ B cells in the spleen
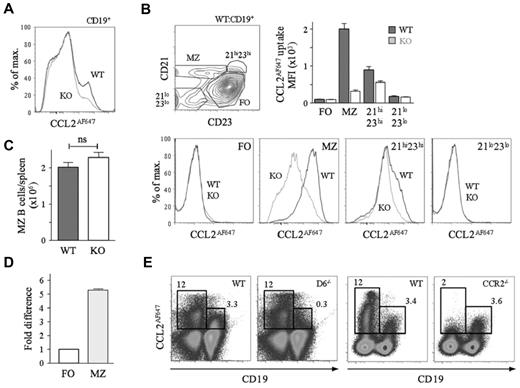
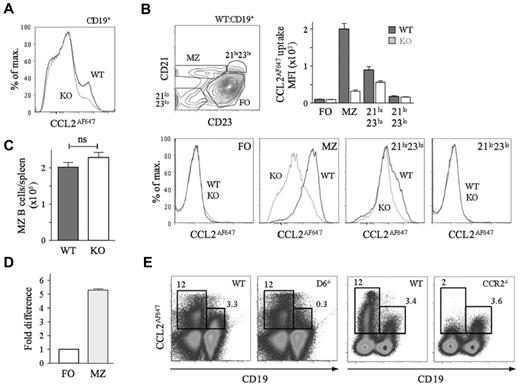
CCL2AF647-loaded splenocytes were analyzed by flow cytometry (Figure 1). Nearly all D6-dependent CCL2AF647 uptake by CD19+ cells was by MZ B cells. The CD21hiCD23hi B-cell population (which contains MZPs) also showed activity (∼ 20%; Figure 1B). Similar results were seen when CCL22AF647 was used (data not shown). CCL2AF647 uptake by WT MZ B cells was blocked by unlabeled CCL3 or CCL22, and CCL22AF647 uptake was inhibited by CCL2, which is consistent with the unique ability of D6 to bind CCL2, CCL3, and CCL22 (data not shown). MZ B-cell abundance was unaffected by D6 deletion (Figure 1C). D6 transcripts were more abundant in MZ B cells than in FO B cells (Figure 1D), which is consistent with microarray data.26 A commercially available anti-D6 polyclonal Ab, reported to preferentially bind MZ B cells,26 stained all B cells strongly compared with isotype controls, but this was unaffected by D6 deficiency (supplemental Figure 1A, available on the Blood Web site; see the Supplemental Materials link at the top of the online article). CCL2AF647 uptake, with the appropriate controls, was the only effective way of detecting mouse D6 protein.
MZ B cells express active D6. (A) Overlaid CCL2AF647 uptake histograms of WT (black) and KO (gray) CD19+ splenocytes. (B) Dot plot showing fractionation of WT CD19+ splenocytes using anti-CD21 and anti-CD23 and overlaid CCL2AF647 uptake histogram plots from WT (black) and KO (gray) subsets. Bar graph shows the average mean fluorescence intensity (MFI) ± SEM of CCL2AF647 uptake by each subset. (C) Mean number ± SEM of MZ B cells (CD19+CD23loCD21hi) per WT and KO spleen (n = 18 per strain). ns indicates not significant (D) D6 mRNA expression by FACS-purified WT splenic FO and MZ B cells. FO cells were set to 1. (E) CCL2AF647 uptake profiles of D6-deficient (D6−/−) and CCR2-deficient (CCR2−/−) CD19+ and CD19− splenocytes alongside WT samples prepared in parallel. Boxes highlight cells with specific CCL2AF647 uptake based on controls performed in the absence of CCL2AF647. Flow cytometric profiles are representative of data generated from > 3 mice per genotype per experiment, with experiments repeated at least 3 times.
MZ B cells express active D6. (A) Overlaid CCL2AF647 uptake histograms of WT (black) and KO (gray) CD19+ splenocytes. (B) Dot plot showing fractionation of WT CD19+ splenocytes using anti-CD21 and anti-CD23 and overlaid CCL2AF647 uptake histogram plots from WT (black) and KO (gray) subsets. Bar graph shows the average mean fluorescence intensity (MFI) ± SEM of CCL2AF647 uptake by each subset. (C) Mean number ± SEM of MZ B cells (CD19+CD23loCD21hi) per WT and KO spleen (n = 18 per strain). ns indicates not significant (D) D6 mRNA expression by FACS-purified WT splenic FO and MZ B cells. FO cells were set to 1. (E) CCL2AF647 uptake profiles of D6-deficient (D6−/−) and CCR2-deficient (CCR2−/−) CD19+ and CD19− splenocytes alongside WT samples prepared in parallel. Boxes highlight cells with specific CCL2AF647 uptake based on controls performed in the absence of CCL2AF647. Flow cytometric profiles are representative of data generated from > 3 mice per genotype per experiment, with experiments repeated at least 3 times.
Many WT non-B cells internalized CCL2AF647. This was unaffected by D6 deletion or inclusion of unlabeled CCL22, but was lost when CCR2 was absent (Figure 1E and data not shown). Uptake by CCR2-deficient MZ B cells was comparable to that of WT and was blocked by unlabeled CCL12 (CCR2/D6 ligand) (Figure 1E and supplemental Figure 1C). CCL2AF647 uptake by WT, non–B-cell splenic subsets (CD4+, CD8+, or CD4+CD25+ T cells, monocytes, natural killer cells, macrophages, and γδ T cells) was substantially reduced in equivalent CCR2-deficient populations, but was unaffected by D6 deletion (data not shown). Therefore, D6 activity is restricted to MZ B cells and CCR2 does not contribute to their CCL2AF647 uptake.
All conventional body cavity B1 cells show robust D6 activity
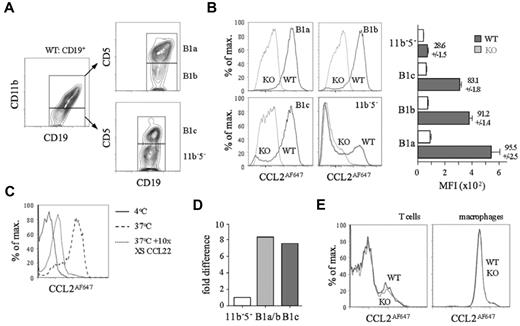
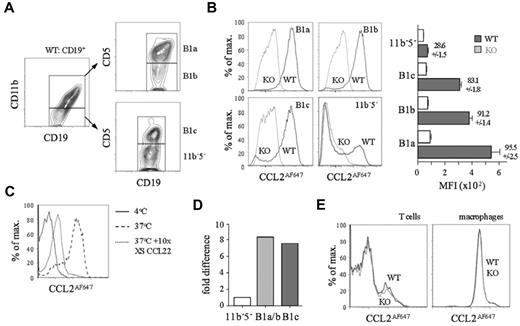
Peritoneal cavity B cells were subdivided by CD11b/CD5 expression into B1a, B1b, B1c, and CD11b−CD5− cells (Figure 2A). Strikingly, unlike their D6-deficient counterparts, nearly all WT B1a, B1b, and B1c cells, and a subset of CD11b−CD5− B cells, internalized large amounts of CCL2AF647 (Figure 2B) or CCL22AF647 (data not shown). Uptake by WT CD11b+ B cells was blocked by excess unlabeled CCL22, and was not observed at 4°C, when receptor internalization is prevented (Figure 2C). D6 transcripts were more abundant in CD11b+ B cells and B1c cells compared with CD11b−CD5− B cells (Figure 2D). The polyclonal anti-mouse D6 Ab showed no D6-dependent binding to B1a/b cells (supplemental Figure 1B). All peritoneal cavity non-B cells lacked D6 activity: some T cells and all macrophages internalized CCL2AF647, but this was unaffected by D6 deletion (Figure 2E) or inclusion of unlabeled CCL22 (data not shown). Uptake by WT and D6-deficient T cells was blocked by CCL2 or CCL12 (supplemental Figure 2) and lost from CCR2-deficient T cells (data not shown). CCL2 or CCL12 partially prevented uptake by macrophages, suggesting CCR2-dependent and D6/CCR2-independent mechanisms (supplemental Figure 2). Pleural cavity B1a, B1b, and B1c cells, and a CD11b−CD5− B-cell subset, showed strong D6-dependent CCL2AF647 uptake (supplemental Figure 3). Pleural cavity T cells and macrophages had no D6 activity. Therefore, D6 activity is a universal property of conventional body cavity B1 cells in resting mice.
All conventional peritoneal cavity B1 cells show D6-dependent CCL2AF647 uptake. (A) Flow cytometric fractionation of WT peritoneal cavity CD19+ cells using anti-CD11b and anti-CD5. (B) Overlaid CCL2AF647 uptake profiles of WT (black) and D6-deficient (KO; gray) peritoneal cavity CD19+ cell subsets. Bar graph shows average MFI ± SEM of CCL2AF647 uptake by each subset. (C) Overlaid flow cytometry plots of CCL2AF647 uptake by WT CD19+CD11b+ peritoneal cavity cells after incubation at 4°C (black) or at 37°C in the presence (gray) or absence (dashed) of a 10-fold excess of unlabeled CCL22. (D) Expression of D6 mRNA in FACS-sorted B-cell populations (pooled from 4 WT mice). B1a/b are CD19+CD11b+ cells. Expression by CD19+CD11b−CD5− (11b−5−) cells was set to 1. (E) Overlaid CCL2AF647 uptake profiles of WT (black) and KO (gray) peritoneal cavity T cells (CD19−CD11b−CD5hi) and macrophages (CD19−CD11b+CD5−). Flow cytometric profiles are representative of data generated from > 3 mice per genotype per experiment, with experiments repeated at least 3 times.
All conventional peritoneal cavity B1 cells show D6-dependent CCL2AF647 uptake. (A) Flow cytometric fractionation of WT peritoneal cavity CD19+ cells using anti-CD11b and anti-CD5. (B) Overlaid CCL2AF647 uptake profiles of WT (black) and D6-deficient (KO; gray) peritoneal cavity CD19+ cell subsets. Bar graph shows average MFI ± SEM of CCL2AF647 uptake by each subset. (C) Overlaid flow cytometry plots of CCL2AF647 uptake by WT CD19+CD11b+ peritoneal cavity cells after incubation at 4°C (black) or at 37°C in the presence (gray) or absence (dashed) of a 10-fold excess of unlabeled CCL22. (D) Expression of D6 mRNA in FACS-sorted B-cell populations (pooled from 4 WT mice). B1a/b are CD19+CD11b+ cells. Expression by CD19+CD11b−CD5− (11b−5−) cells was set to 1. (E) Overlaid CCL2AF647 uptake profiles of WT (black) and KO (gray) peritoneal cavity T cells (CD19−CD11b−CD5hi) and macrophages (CD19−CD11b+CD5−). Flow cytometric profiles are representative of data generated from > 3 mice per genotype per experiment, with experiments repeated at least 3 times.
CD23+ body cavity B1 cells have elevated expression of FO B-cell markers
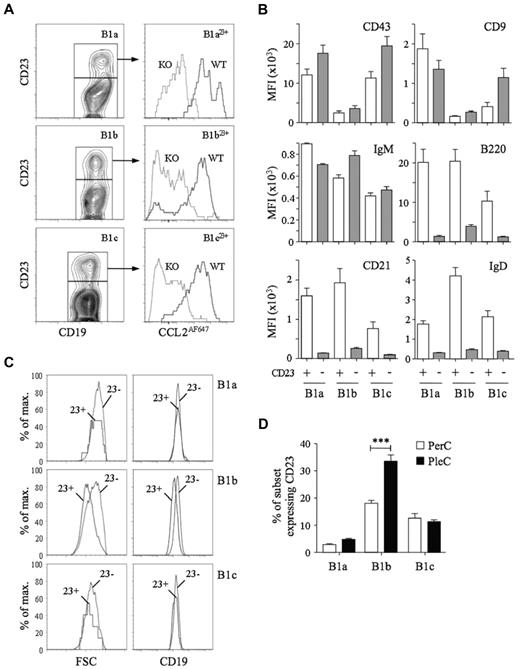
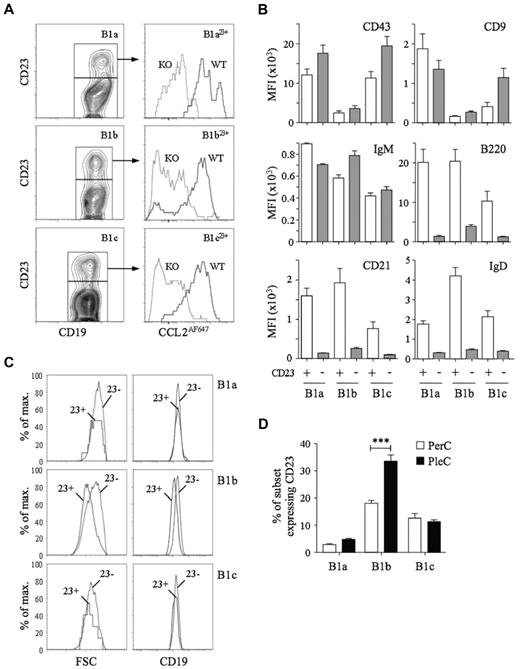
D6 activity among CD11b−CD5− body cavity B cells suggested the presence of B1 cells. CD23 is present on most FO B cells, but is thought to be absent from B1 cells, so we used anti-CD23 Abs to try to identify FO B cells among CD11b−CD5− B cells. CD11b−CD5− peritoneal cavity B cells could be subdivided into CD23+ and CD23− populations (see “D6 activity identifies B1 cells among body cavity CD11b−CD5−B cells”). Unexpectedly, CD23+ B1a, B1b, and B1c cells (termed B1a23+, B1b23+, and B1c23+, respectively) were also present, representing 5%-22% of each subset (Figure 3). CD23+ B1 cells showed strong, D6-dependent CCL2AF647 uptake and expressed abundant CD43, CD9, and IgM, but, surprisingly, also had high levels of B220, CD21, and IgD, which are typically seen as FO B-cell properties. These were not B1/FO doublets because, as in all flow cytometry, we gated for small, live cells before analysis (which successfully removed CD19+CD5hi B/T conjugates; supplemental Figure 4). Moreover, CD23+ B1 cells were not bigger than their CD23− counterparts and showed equivalent anti-CD19 fluorescence. In fact, B1b23+ cells were smaller than CD23− B1b cells and expressed less CD19. CD23+ B1 cells with strong D6 activity were also present in the pleural cavity, where a larger proportion of B1b cells were CD23+ (Figure 3D). Therefore, body cavity B1 cells expressing B1 markers (CD11b, CD5, CD43, CD9, and IgM) and with strong D6 activity can have high surface expression of proteins typically associated with FO B cells.
Characterization of D6active body cavity CD23+ B1 cells. (A) Left panels: Subfractionation of WT peritoneal cavity B1a (CD19+CD11b+CD5+), B1b (CD19+CD11b+CD5−) and B1c (CD19+CD11b−CD5+) cells by anti-CD23. Right panels: Overlaid CCL2AF647 uptake profiles of WT (black) and D6-deficient (KO, gray) peritoneal cavity CD23+ B1-cell subsets. (B) Surface immunophenotype of WT peritoneal cavity CD23+ (light gray) and CD23− (dark gray) B1-cell subsets. Data are shown as the average MFI for each marker ± SEM. (C) Forward scatter (FSC) and surface CD19 of WT peritoneal cavity CD23+ (23+) and CD23− (23−) B1 cell subsets. (D) Mean percentage ± SEM of each B1-cell subset expressing surface CD23 in WT peritoneal cavity and pleural cavity lavages (n = 5). ***P < .001. Flow cytometric profiles are representative of data from > 3 mice per genotype per experiment, with experiments repeated at least 3 times.
Characterization of D6active body cavity CD23+ B1 cells. (A) Left panels: Subfractionation of WT peritoneal cavity B1a (CD19+CD11b+CD5+), B1b (CD19+CD11b+CD5−) and B1c (CD19+CD11b−CD5+) cells by anti-CD23. Right panels: Overlaid CCL2AF647 uptake profiles of WT (black) and D6-deficient (KO, gray) peritoneal cavity CD23+ B1-cell subsets. (B) Surface immunophenotype of WT peritoneal cavity CD23+ (light gray) and CD23− (dark gray) B1-cell subsets. Data are shown as the average MFI for each marker ± SEM. (C) Forward scatter (FSC) and surface CD19 of WT peritoneal cavity CD23+ (23+) and CD23− (23−) B1 cell subsets. (D) Mean percentage ± SEM of each B1-cell subset expressing surface CD23 in WT peritoneal cavity and pleural cavity lavages (n = 5). ***P < .001. Flow cytometric profiles are representative of data from > 3 mice per genotype per experiment, with experiments repeated at least 3 times.
D6 activity identifies B1 cells among body cavity CD11b−CD5− B cells.
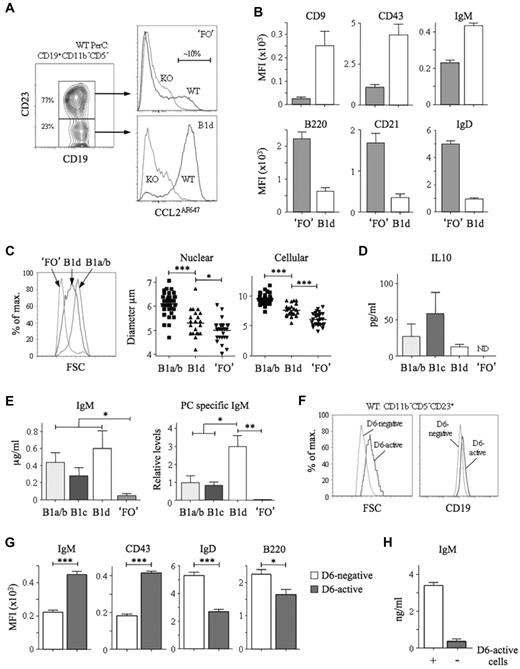
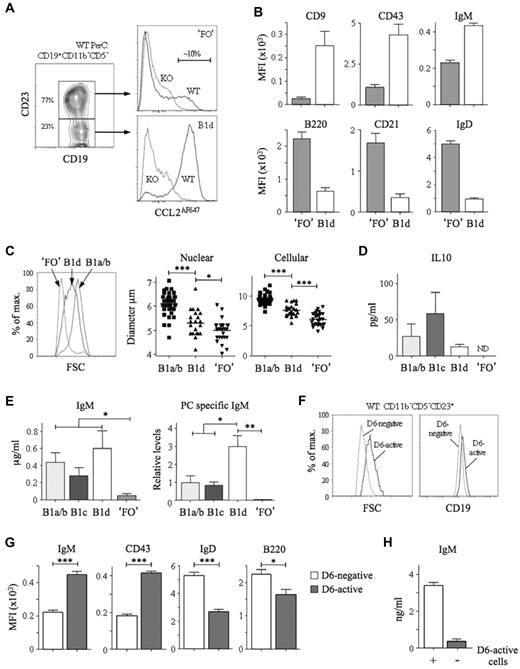
Peritoneal cavity CD11b−CD5− B cells were divisible into CD23− and CD23+ subsets (Figure 4A). Most triple-negative B cells (CD11b−CD5−CD23−) and some CD11b−CD5−CD23+ cells showed robust, D6-dependent CCL2AF647 uptake. Among pleural cavity CD11b−CD5− B cells, more than 95% CD23− cells and approximately 15% of CD23+ cells had D6 activity (data not shown). The D6 activity of CD11b−CD5−CD23− B cells implied that they were B1 cells, so we provisionally called them B1d. CD11b−CD5−CD23+ cells were predominantly D6negative, so we called them ‘FO’ B cells (the quotation marks reflecting the presence of some D6active putative B1 cells). Consistent with these definitions, B1d cells had more surface CD19, CD9, CD43, and IgM than ‘FO’ B cells, and less B220, CD21, and IgD (Figure 4A-B). They were, on average, larger than ‘FO’ B cells but smaller than B1a/b cells (Figure 4C). In addition to lacking CD11b, B1d carried less IgM, CD29, and CD49 than B1b, whereas the lack of CD5 and the lower levels of CD9 and CD43 distinguished them from B1a and B1c cells (data not shown). Characteristically, cultured B1a/b cells spontaneously secreted IL-10 and IgM enriched with anti-PC specificities (Figure 4D-E). B1c and B1d cells, but not ‘FO’ B cells, also produced substantial quantities of IL-10 and IgM. PC-specific IgM was produced by B1a/b and B1c cells, but not by ‘FO’ B cells, and, notably, was the most abundant in B1d cultures. Therefore, B1d and B1c cells, a major fraction of peritoneal cavity CD11b− B cells, have robust IBC-like activity ex vivo.
Identification and characterization of peritoneal cavity B1d and B1d23+ cells. (A) Left panel: Subfractionation of WT peritoneal cavity CD19+CD11b−CD5− cells by anti-CD23. The abundance of the 2 subsets is shown as the mean percentage of total CD19+CD11b−CD5− cells. Right panels: Overlaid CCL2AF647 uptake profiles of WT (black) and D6-deficient (KO, gray) CD23+ and CD23− subsets, referred to as ‘FO’ and B1d, respectively. Proportion of D6active ‘FO’ B cells is indicated. (B) Surface immunophenotype of WT peritoneal cavity ‘FO’ and B1d B cells. Data show average mean fluorescence intensity (MFI) ± SEM. (C) Comparison of size of WT peritoneal cavity ‘FO’, B1d, and CD11b+ B1 (B1a/b) cells by forward scatter (FSC; left panel), and microscopic measurements of nuclear and cellular diameter (middle and right panels) of FACS-sorted peritoneal cavity cells. (D-E) Production of IL-10, IgM, and anti-PC Abs by FACS-sorted, cultured CD11b+ B1 (B1a/b), B1c, B1d, and ‘FO’ cells. Data show means ± SEM of data generated from 3 repeat experiments. ND indicates not detected. (F) Overlaid forward scatter (FSC; left panel) and surface CD19 (right panel) of WT peritoneal cavity D6-active and D6-negative CD19+CD11b−CD5−CD23+ ‘FO’ cells. (G) Surface immunophenotype of WT peritoneal cavity D6-active and D6-negative CD19+CD11b−CD5−CD23+ ‘FO’ cells shown as the average mean fluorescence intensity (MFI) ± SEM. (H) Production of IgM by FACS-sorted, cultured CD19+CD11b−CD5−CD23+ cells in the absence (−) or presence (+) of their D6-active subset. Flow cytometric profiles are representative of data from at least 3 mice per genotype per experiment, with experiments repeated at least 3 times. *P < .05; **P < .01; ***P < .001.
Identification and characterization of peritoneal cavity B1d and B1d23+ cells. (A) Left panel: Subfractionation of WT peritoneal cavity CD19+CD11b−CD5− cells by anti-CD23. The abundance of the 2 subsets is shown as the mean percentage of total CD19+CD11b−CD5− cells. Right panels: Overlaid CCL2AF647 uptake profiles of WT (black) and D6-deficient (KO, gray) CD23+ and CD23− subsets, referred to as ‘FO’ and B1d, respectively. Proportion of D6active ‘FO’ B cells is indicated. (B) Surface immunophenotype of WT peritoneal cavity ‘FO’ and B1d B cells. Data show average mean fluorescence intensity (MFI) ± SEM. (C) Comparison of size of WT peritoneal cavity ‘FO’, B1d, and CD11b+ B1 (B1a/b) cells by forward scatter (FSC; left panel), and microscopic measurements of nuclear and cellular diameter (middle and right panels) of FACS-sorted peritoneal cavity cells. (D-E) Production of IL-10, IgM, and anti-PC Abs by FACS-sorted, cultured CD11b+ B1 (B1a/b), B1c, B1d, and ‘FO’ cells. Data show means ± SEM of data generated from 3 repeat experiments. ND indicates not detected. (F) Overlaid forward scatter (FSC; left panel) and surface CD19 (right panel) of WT peritoneal cavity D6-active and D6-negative CD19+CD11b−CD5−CD23+ ‘FO’ cells. (G) Surface immunophenotype of WT peritoneal cavity D6-active and D6-negative CD19+CD11b−CD5−CD23+ ‘FO’ cells shown as the average mean fluorescence intensity (MFI) ± SEM. (H) Production of IgM by FACS-sorted, cultured CD19+CD11b−CD5−CD23+ cells in the absence (−) or presence (+) of their D6-active subset. Flow cytometric profiles are representative of data from at least 3 mice per genotype per experiment, with experiments repeated at least 3 times. *P < .05; **P < .01; ***P < .001.
The existence of CD23+ B1a, B1b, and B1c cells suggested that D6active peritoneal cavity ‘FO’ B cells (Figure 4A) could be CD23+ B1d cells (B1d23+). Indeed, like B1d cells, they were larger than D6negative CD11b−CD5−CD23+ cells and expressed more CD19, IgM, and CD43 (Figure 4F-G). Like B1a23+, B1b23+, and B1c23+ cells, B1d23+ cells carried more surface IgD and B220 than B1d cells, although still less than D6negative CD11b−CD5−CD23+ cells (Figure 4G). Moreover, removal of D6active cells from CD11b−CD5−CD23+ cells substantially reduced their spontaneous, low-level IgM production (Figure 4H). Therefore, D6 activity defines phenotypically distinct cells among the CD11b−CD5−CD23+ population that resembles the CD23+ variants of all other B1 cell types.
In summary, D6 activity is not limited to conventional B1 cells, and can be used to identify novel B1 subsets among CD11b−CD5− B cells. We have defined 9 distinct body cavity B-cell subsets in naive mice: 8 show clear evidence of B1-cell identity and represent > 75% of the B-cell compartment (supplemental Table 1). Unlike existing markers, D6 activity is a specific unifying feature of these cells.
D6active B cells in omentum, spleen, blood, GALT, and intestine.
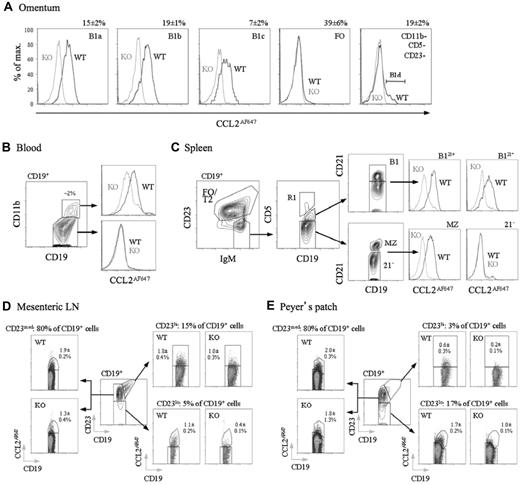
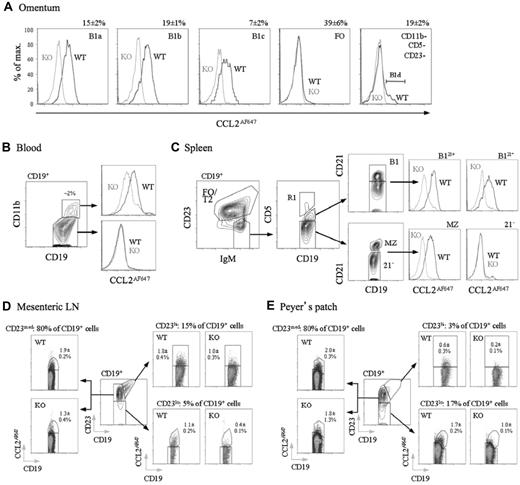
B1 cells are thought to enter and exit the peritoneal cavity via the omentum, circulate in the blood, and then reside in other lymphoid tissues, including the spleen.12,18,21,39 These cells also enter the intestinal lamina propria and the gut-associated lymphoid tissue (GALT), contributing to commensally induced IgA generation.2,16,19 We compared CCL2AF647 uptake by WT and D6-deficient B cells from these tissues/fluids (Figure 5), confirming D6 activity by competing uptake into WT B cells with unlabeled CCL22 (data not shown). Blood-borne CD11b+ B cells; omental B1a, B1b, and B1c cells (which were almost exclusively CD23−); and splenic B1 cells (CD19+IgMhiCD23loCD5+)12 all had D6 activity (Figure 5A-C). Anti-CD21 identified 2 clear splenic B1 subsets and D6active MZ B cells among IgMhiCD23loCD5− cells (Figure 5C). As expected for IBCs, splenic B1 and MZ B cells were larger and expressed less IgD than FO B cells (supplemental Figure 5). Circulating CD11b− B cells and IgMhiCD23loCD5−CD21− (enriched for T1 cells) and IgM+CD23+ splenic B cells were D6negative (Figure 1B-C and data not shown). D6active CD11b−CD5− B cells (B1d/B1d23+) were undetectable in the spleen or blood. In the omentum, less than 10% of CD11b−CD5−CD23− B cells were D6active, and CD11b−CD5−CD23+ B cells were almost exclusively D6negative (Figure 5A). This could have been due to the loss of D6 activity, but more likely reflects an increased abundance of CD23− FO B cells outside of the body cavities. Likewise, D6 activity was rare in lymph node and Peyer patch B cells (uniformly CD11b−CD5−), even in CD23lo fractions. Nonetheless, although B cells in skin-draining lymph nodes lacked D6 activity (data not shown), it was detectable among GALT B cells, particularly those in mesenteric lymph nodes, but also in Peyer patches (Figure 5D-E). D6active B cells were also found in bone marrow, colon,32 and small intestine, and all had surface immunophenotypes consistent with an IBC identity (data not shown). Therefore, along with MZ B cells and body cavity B1 cells, D6 activity is associated with IBCs, and B cells with IBC-like immunophenotypes, at other locations in resting mice.
D6active B1 cells in omentum, blood, spleen, mesenteric lymph node, and Peyer patches. (A) Overlaid CCL2AF647 uptake profiles for WT (black) and D6-deficient (KO, gray) omental CD19+ B-cell subsets (identified using Abs against CD5, CD11b, and CD23 as in the analysis of peritoneal cavity lavage cells). Numbers above plots show proportion of retrieved CD19+ cells in each subset in WT mice (means ± SEM). B1d cells (CD19+CD11b−CD5−CD23−D6active) are indicated in the far right plot. (B) Contour plot showing CD11b expression on CD19+ blood cells with the proportion of CD19+ CD11b+ cells indicated. Overlaid CCL2AF647 uptake profiles are shown in the right panels (WT, black; D6-deficient (KO), gray). (C) Contour plots showing gating of CD19+ splenocytes for FO/T2 cells, MZ B cells, and B1 cells fractionated into CD21+ (B121+) and CD21− (B121−) subsets. Events in gate R1 (CD5hi) are rare T/B-cell conjugates and were excluded. The CD19+IgMhiCD23loCD5−CD21− population, containing T1 progenitors, are labeled ‘21−'. The overlaid histograms show CCL2AF647 uptake profiles for WT (black) and D6-deficient (KO; gray) subsets. (D-E) CD19+ cells in mesenteric lymph node and pooled Peyer patches fractionated into CD23lo, CD23med, and CD23hi subsets (central dot plot in each figure). Subset size, as a proportion of retrieved WT CD19+ cells, is indicated above each CCL2AF647 uptake dot plot. The mean ± SEM of CCL2AF647-positive cells (as a proportion of retrieved CD19+ cells) is indicated on each plot. All data are representative of experiments repeated 2-5 times.
D6active B1 cells in omentum, blood, spleen, mesenteric lymph node, and Peyer patches. (A) Overlaid CCL2AF647 uptake profiles for WT (black) and D6-deficient (KO, gray) omental CD19+ B-cell subsets (identified using Abs against CD5, CD11b, and CD23 as in the analysis of peritoneal cavity lavage cells). Numbers above plots show proportion of retrieved CD19+ cells in each subset in WT mice (means ± SEM). B1d cells (CD19+CD11b−CD5−CD23−D6active) are indicated in the far right plot. (B) Contour plot showing CD11b expression on CD19+ blood cells with the proportion of CD19+ CD11b+ cells indicated. Overlaid CCL2AF647 uptake profiles are shown in the right panels (WT, black; D6-deficient (KO), gray). (C) Contour plots showing gating of CD19+ splenocytes for FO/T2 cells, MZ B cells, and B1 cells fractionated into CD21+ (B121+) and CD21− (B121−) subsets. Events in gate R1 (CD5hi) are rare T/B-cell conjugates and were excluded. The CD19+IgMhiCD23loCD5−CD21− population, containing T1 progenitors, are labeled ‘21−'. The overlaid histograms show CCL2AF647 uptake profiles for WT (black) and D6-deficient (KO; gray) subsets. (D-E) CD19+ cells in mesenteric lymph node and pooled Peyer patches fractionated into CD23lo, CD23med, and CD23hi subsets (central dot plot in each figure). Subset size, as a proportion of retrieved WT CD19+ cells, is indicated above each CCL2AF647 uptake dot plot. The mean ± SEM of CCL2AF647-positive cells (as a proportion of retrieved CD19+ cells) is indicated on each plot. All data are representative of experiments repeated 2-5 times.
B1 cell D6 does not elicit Ca2+ fluxes or induce chemotaxis
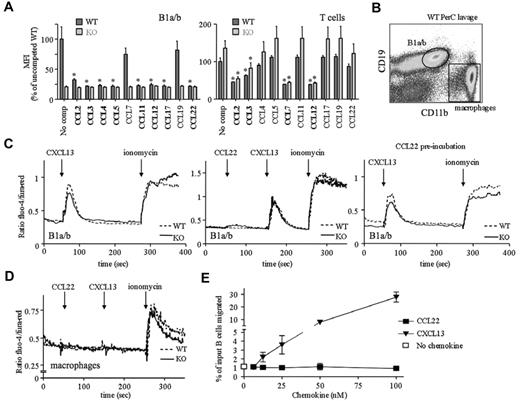
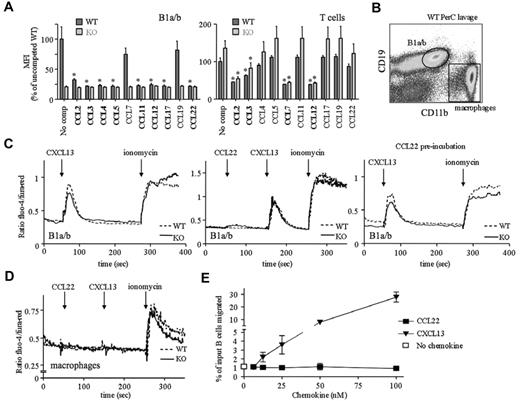
Our limited insight into the molecular biology of mouse D6 comes from in vitro studies of immortalized cell lines expressing high levels of exogenous D6. IBCs present a unique opportunity to examine D6 on primary cells. First, we explored ligand selectivity by assessing whether previously assigned D6 ligands block CCL2AF647 uptake by B1 cells (Figure 6A). CCL2, CCL3, CCL4, CCL5, CCL11, CCL17, and CCL22 did, but unexpectedly, CCL7 did not and CCL8 was unable to block D6- or CCR2-mediated CCL2AF647 uptake (data not shown). In addition, despite not being thought of as a CCR2 ligand, CCL3 partially blocked CCR2-mediated CCL2AF647 uptake by peritoneal cavity T cells (Figure 6A), splenic Ly6Chi monocytes (supplemental Figure 6), and other splenic subsets, even at low concentrations (12.5nM). We also examined signaling and chemotaxis (Figure 6B-E) using CCL22. Peritoneal cavity B1a/b cells lack CCR4 (data not shown), so D6 is their only CCL22 receptor. Positive controls (ionomycin and CXCL13, a non-D6 ligand) generated robust Ca2+ fluxes in WT and D6-deficient B1a/b cells, whereas macrophages only responded to ionomycin. CCL22 did not affect Ca2+ levels in either cell type or alter CXCL13 responses in B cells. Prolonged CCL22 preincubation did not dampen B1a/b CXCL13 responses. Similar unresponsiveness was seen with CCL2 or CCL3 (data not shown). CCL2, CCL3, CCL4, CCL5, and CCL22 were unable to induce Ca2+ fluxes in WT splenic B cells, but CXCL13 gave strong responses (data not shown). WT peritoneal cavity B cells migrated toward CXCL13 but not CCL22 or CCL3 (Figure 6E). CCL22 and CCL3 were bioactive, because they could block D6-mediated CCL2AF647 uptake and induce migration of non-B cells through receptors other than D6 (data not shown). Therefore, D6 on B1 cells internalizes its ligands but cannot induce Ca2+ fluxes or cell migration after chemokine engagement. In addition, flow cytometry using a panel of Abs (including IgM, IgD, B220, CXCR4, CXCR5, CD1d, CD9, 11a, 11b, 19, 21, 23, 29, 43, 49, 69, and 86) did not reveal any significant differences between WT and D6-deficient body cavity B cells (data not shown). These observations are consistent with the designation of D6 as a chemokine scavenger.
Chemokine binding and signaling properties of D6 on peritoneal cavity B1 cells. (A) CCL2AF647 uptake by WT and D6-deficient (KO) peritoneal cavity B1a/b (CD19+CD11b+) or T cells (CD19−CD11b−CD5+) in the presence of a 10-fold molar excess of the indicated unlabeled chemokines. No comp indicates CCL2AF647 uptake in the absence of competitor. The average mean fluorescence intensity (MFI) of competed samples is shown as a percentage ± SEM of the average MFI of uncompeted WT uptake. Asterisks mark chemokines that significantly reduced CCL2AF647 uptake by WT or D6-deficient KO cells (P < .01). (B) Gates used to gauge Ca2+ fluxes in B1a/b and macrophages. (C-D) Representative Ca2+ flux profiles of Fluo-4/Fura-Red–loaded WT and D6-deficient KO peritoneal cavity B1a/b cells (C) and macrophages (D). The points of chemokine (50-100nM) and ionomycin addition are indicated with arrows. Cells in the far right panel of panel C were incubated in 100nM CCL22 for 1 hour at 37°C before analysis. (E) Migration of WT B cells from peritoneal cavity lavages to CCL22 or CXCL13. Migration in medium alone is indicated by the unfilled square. The mean number of live cells ± SEM migrated from 4 replicate wells is presented as a percentage of input. All data are representative of 3 or more independent experiments.
Chemokine binding and signaling properties of D6 on peritoneal cavity B1 cells. (A) CCL2AF647 uptake by WT and D6-deficient (KO) peritoneal cavity B1a/b (CD19+CD11b+) or T cells (CD19−CD11b−CD5+) in the presence of a 10-fold molar excess of the indicated unlabeled chemokines. No comp indicates CCL2AF647 uptake in the absence of competitor. The average mean fluorescence intensity (MFI) of competed samples is shown as a percentage ± SEM of the average MFI of uncompeted WT uptake. Asterisks mark chemokines that significantly reduced CCL2AF647 uptake by WT or D6-deficient KO cells (P < .01). (B) Gates used to gauge Ca2+ fluxes in B1a/b and macrophages. (C-D) Representative Ca2+ flux profiles of Fluo-4/Fura-Red–loaded WT and D6-deficient KO peritoneal cavity B1a/b cells (C) and macrophages (D). The points of chemokine (50-100nM) and ionomycin addition are indicated with arrows. Cells in the far right panel of panel C were incubated in 100nM CCL22 for 1 hour at 37°C before analysis. (E) Migration of WT B cells from peritoneal cavity lavages to CCL22 or CXCL13. Migration in medium alone is indicated by the unfilled square. The mean number of live cells ± SEM migrated from 4 replicate wells is presented as a percentage of input. All data are representative of 3 or more independent experiments.
D6 deficiency modifies B1 cells, the B1-cell compartment, and anti-PC abundance
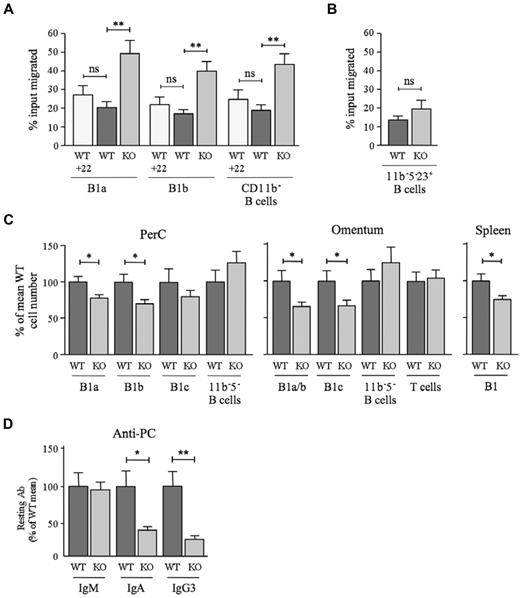
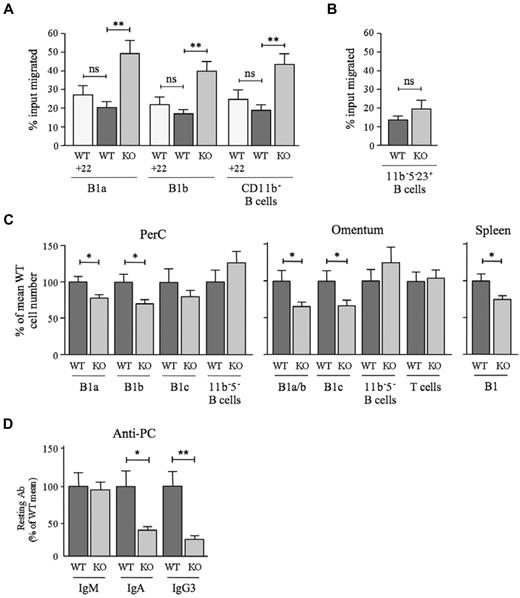
All existing in vitro and in vivo data, including those in the present study, point to a scavenging role for D6. However, D6 drives β-arrestin redistribution in cell lines,33,34 so it could also regulate responses through other chemokine receptors. Therefore, we compared the migratory responses of D6-deficient and WT peritoneal cavity B cells toward CXCL13. Interestingly, there was a substantial increase in the migration of D6-deficient B1a, B1b, and CD11b− B cells (ie, B1c, B1c23+, B1d, B1d23+, and FO B cells) toward 100nM CXCL13 compared with WT (Figure 7A). D6 engagement failed to modify the response of WT B1 cells to 100nM CXCL13, because neither the addition of CCL22 (Figure 7A) or CCL3 (data not shown) to the upper or lower chambers of chemotaxis wells nor preincubation with these chemokines (data not shown) significantly altered migration. D6 deficiency had no significant impact on basal motility or on migration to 50nM CXCL13, but it was associated with enhanced migration toward 200nM CXCL13 (supplemental Figure 7A). Peritoneal cavity CD5−CD11b−CD23+ B-cell chemotaxis toward CXCL13 was unaffected by deletion of D6 (Figure 7B), and D6-deficient inguinal lymph node B cells were not more responsive than those from WT animals (data not shown). Consistent with previous studies,24 CXCL12 was a much less effective peritoneal cavity B-cell attractant than CXCL13. Its ability to stimulate B1a and B1b cell migration was unaffected by D6 deletion (supplemental Figure 7B). Therefore, D6 can specifically suppress B1-cell migration toward CXCL13.
Impact of D6 deficiency on B1-cell motility, B1-cell abundance, and serum anti-PC levels. (A) WT and D6-deficient (KO) peritoneal cavity B cells that migrated in response to 100nM CXCL13 plus 50nM CCL22 where indicated (+22) were enumerated by flow cytometry after staining with antibodies against CD19, CD11b, and CD5. Data are representative of at least 3 experiments. (B) Proportion of WT and KO peritoneal cavity CD5−CD11b−CD23+ B cells migrating toward 100nM CXCL13. A repeat experiment generated similar results. In panels A and B, data are presented as the mean number of live cells migrated (as percentage of input) ± SEM from at least 4 replicates. (C) Number of cells in the indicated B-cell subsets in peritoneal cavity lavage, omentum, and spleen of WT and D6-deficient (KO) mice as a percentage ± SEM of WT (WT average set to 100%; peritoneal cavity, 26 mice per genotype; omentum, 20 mice per genotype; spleen, 6 mice per genotype). 11b−5− B cells were CD19+CD11b−CD5−; omental T cells were FSCloSSCloCD19−CD11b−CD23−CD5hi. (D) Mean quantity of anti-PC Abs ± SEM in the serum of resting WT and KO mice (9 per genotype). Mean WT levels were set to 100%. Similar data were generated in a repeat experiment. *P < .05; **P < .01; ***P < .001. ns indicates not significant.
Impact of D6 deficiency on B1-cell motility, B1-cell abundance, and serum anti-PC levels. (A) WT and D6-deficient (KO) peritoneal cavity B cells that migrated in response to 100nM CXCL13 plus 50nM CCL22 where indicated (+22) were enumerated by flow cytometry after staining with antibodies against CD19, CD11b, and CD5. Data are representative of at least 3 experiments. (B) Proportion of WT and KO peritoneal cavity CD5−CD11b−CD23+ B cells migrating toward 100nM CXCL13. A repeat experiment generated similar results. In panels A and B, data are presented as the mean number of live cells migrated (as percentage of input) ± SEM from at least 4 replicates. (C) Number of cells in the indicated B-cell subsets in peritoneal cavity lavage, omentum, and spleen of WT and D6-deficient (KO) mice as a percentage ± SEM of WT (WT average set to 100%; peritoneal cavity, 26 mice per genotype; omentum, 20 mice per genotype; spleen, 6 mice per genotype). 11b−5− B cells were CD19+CD11b−CD5−; omental T cells were FSCloSSCloCD19−CD11b−CD23−CD5hi. (D) Mean quantity of anti-PC Abs ± SEM in the serum of resting WT and KO mice (9 per genotype). Mean WT levels were set to 100%. Similar data were generated in a repeat experiment. *P < .05; **P < .01; ***P < .001. ns indicates not significant.
B1-cell motility regulates peritoneal cavity cellularity and Ab production against host/commensal Ag.12,16,19,22 Indeed, fewer cells were retrieved from the peritoneal cavity of D6-deficient mice compared with WT. This was due to a significant reduction in B1a and B1b cells, because macrophages, T cells, and other B-cell subsets were unaffected (Figure 7C and data not shown). D6-deficient mice also had fewer omental CD11b+ B cells and B1c cells and fewer splenic B1 cells (Figure 7C). Splenic FO B- and T-cell numbers were normal (data not shown). Furthermore, B1-cell deficiency was accompanied by a significant reduction in circulating class-switched anti-PC Abs (Figure 7D) despite normal levels of PC-specific IgM, total IgM, IgA, and IgG3 (data not shown). Therefore, D6 deficiency alters the chemotactic responsiveness of B1 cells, reduces the size of the B1-cell compartment, and suppresses constitutive production of anti-PC Abs.
Discussion
Comprehensive dissection of B-cell populations in resting mice revealed D6 activity to be a feature of all conventional IBCs (ie, MZ B cells, B1a, and B1b), and capable of identifying B1 cells in the blood, spleen, and omentum, and among body cavity CD11b− B cells (B1c and B1d). By extension, D6active B cells in intestinal lamina propria32 and GALT are presumably IBCs. In contrast, we did not detect D6 activity on non-B cells, bone marrow B-cell precursors or B1 progenitors (CD19+B220lo/−veLin−),40 or CD138+ plasma cells (data not shown). Activation of BCR and/or TLRs failed to induce D6 activity on splenic or peritoneal cavity FO B cells, although it did in some cases reduce B1 or MZ B-cell D6 activity (data not shown). Nonetheless, D6-mediated chemokine uptake is clearly a unique and specific property of IBCs in resting mice; in fact, to our knowledge, it is the best unifying marker of these cells. D6 showed far broader expression among IBCs than any surface marker we examined, which could not even identify all B1 cells in the body cavities. For example, neither anti-CD9 nor anti-CD43 distinguished peritoneal cavity B1b and B1d cells from FO B cells (supplemental Figure 8). Fc receptor-like protein FCRL5 (FcRH3) might be as widely expressed as D6 activity among IBCs.41 It is absent from splenic FO B cells, but was detected on MZ B cells, MZPs, and B220+CD5+ and B220loCD5− peritoneal cavity B cells. Some peritoneal cavity ‘FO’ B cells (defined as B220hiCD5−) were also FCRL5+. These might have been B1b23+, B1d, or B1d23+ cells. It will be interesting to examine FCRL5 expression by splenic B1 cells and other IBCs outside of body cavities and directly compare the distribution of FCRL5 and D6 activity among B cells.
We were surprised to find B1 cells (B1a-d23+) with elevated expression of ‘typical’ FO B-cell markers, but this is not without precedent. Bw cells, the dominant peritoneal cavity B-cell subset in outbred mice, are CD5−CD11b+B220hiIgMhiIgDhiCD43−CD9−,42 which is similar to B1b23+ cells (CD5−CD11b+B220hiIgMhi IgDhiCD43loCD9lo). Bw cells are enriched for auto-antibodies and anti-PC specificities, which are features of IBCs. We predict that they will also prove to have robust D6 activity.
The precise interrelationship between body cavity B1-cell subsets remains to be defined. Peritoneal cavity CD11b− B1 cells arise earlier in B1 ontogeny, show greater reconstitution potential, and can act as CD11b+ B1-cell progenitors.11 Based on immunophenotypes, it is possible that B1c and B1d cells are progenitors for B1a and B1b cells, respectively. Interestingly, we found rare D6negative cells within body cavity B1c and B1d subsets. Because MZPs only carry weak D6 activity (Figure 1B) and transitional B cells are D6negative, we speculate that these cells are more primitive B1 progenitors.
Immunophenotyping, D6 activity, and ex vivo functional studies support using CD19+CD11b−CD5−CD23+D6negative as a rigorous definition of body cavity FO B cells. This has implications for previous work. For example, peritoneal cavity ‘FO’ B cells have been reported to be expanded in CCR7-deficient mice,23 B1-like and capable of giving rise to B1b,43 or capable of specific peritoneal cavity homing,44 based on B220hi, B220+CD11b−CD5−, or CD19+B220hiCD23+ immunophenotypes, respectively. These populations contain substantial numbers of B1 cells. Similarly, gene-deficient mice with reported defects in FO or B1 B-cell development were analyzed using what was, in retrospect, imprecise phenotyping. BAFF depletion, or deletion of BAFF or BAFF-R, is reported to cause profound FO B-cell deficiency, with B1 cells unaffected,45 reduced in the peritoneal cavity only,46 or reduced in the spleen only.47 In each case, a different—and inadequate—B1-cell identification method was used. Likewise, IL-7 deficiency is reported to only affect FO B cells, but the observed 75% loss of CD11b− peritoneal cavity B cells might include B1 cells.48
Fluorescent chemokine uptake is currently the only way of effectively detecting D6 protein in mice. It also provides unrivalled sensitivity for CCR2 detection (Figure 1), outperforming the anti-CCR2 Abs we have tested, including the widely used mAb MC2149 (data not shown). Our study highlights the importance of using primary cells to define receptor specificity. Mouse D6 is promiscuous, but CCL7 and CCL8 are not ligands. CCL7 induces migration via CCR1-315 ; by avoiding D6-mediated scavenging, it might be uniquely placed to drive protracted periods of recruitment during inflammation. Mouse CCL8, typically classified as a CCR2 ligand, did not block uptake by CCR2. In fact, it has recently emerged that mouse CCL8 is a ligand for CCR8, not CCR2, with CCL12 being the likely ortholog of human CCL8 (a bona fide human CCR2 ligand).50 Unexpectedly, CCL2AF647 uptake via CCR2 was blocked by CCL3, contrary to the accepted view that it does not bind CCR2.15 CCL3 competition was previously used to infer D6 usage during CCL2AF647 uptake,25 but these data need careful reevaluation. CCL22 competition alone reliably confirms D6 usage, whereas CCL7 competition is an effective CCR2 discriminator.
IBC D6 internalizes chemokines, but cannot induce Ca2+ fluxes or chemotaxis. This is the first examination of D6 on primary cells, and provides critical support for the scavenger model of D6 function. D6-mediated chemokine scavenging, like IL-10 release, might contribute to the anti-inflammatory properties of IBCs, and experiments are under way to explore this possibility. Understanding where and when D6-mediated scavenging occurs requires consideration of the microanatomical limitations of IBCs and their behavior during inflammation. Peritonitis or splenic inflammation is typically accompanied by the rapid departure and differentiation of large numbers of IBCs from the peritoneal cavity or MZ, respectively. However, IBC compartments repopulate as inflammation subsides and homeostasis is restored, and we predict that it is during this period that chemokine modulation by IBC D6 is important.
D6 deficiency leads to 3 IBC phenotypes: (1) enhanced B1-cell responses to CXCL13, (2) reduction in B1 cells, and (3) lower levels of serum anti-PC Abs. These phenotypes might be linked, because the migratory properties of B1 cells profoundly influence their survival and Ab-secreting capacity.12,16,18,19 Resting CXCL13- and CXCR5-deficient mice have few body cavity and omental B1 cells,12,22,23 and reduced serum IgM specific for PC, despite normal levels of total IgM, IgA, and IgG3.12 The phenotypes in D6-deficient animals are less dramatic, but the enhanced sensitivity of their B1 cells to CXCL13 might alter their recirculation and distribution to perturb access to niches required for optimal survival, expansion, and/or differentiation. CXCL13-deficient mice also show poor responses to exogenous T-cell–independent Ags.12 Although D6 deficiency had no obvious impact on Ab responses to standard intraperitoneal doses of conventional T-cell–independent Ags (data not shown), more detailed investigations are under way (varying Ag dose and route of delivery) to reveal any critical roles for D6 during IBC responses.
The mechanisms responsible for the enhanced CXCL13 responsiveness of D6-deficient B1 cells are unclear. D6 deletion did not affect the surface expression of CXCR5 before or after exposure to CXCL13 (data not shown), and WT B1-cell responses to CXCL13 were not altered by D6 ligands, which is consistent with the inability of D6 to transduce signals. Interestingly, D6-mediated β-arrestin redistribution occurs in the absence of chemokines, and is unaffected by chemokine exposure.33,34 β-arrestins are critical regulators of G-protein–coupled receptors that are cap-able of switching signaling from G-protein–dependent to G-protein–independent pathways, and their activity is profoundly influenced by subcellular localization. Their presence at B1-cell surfaces, driven by D6 expression, might alter signaling and subsequent migratory responses mediated by robust CXCR5 acti-vation. We have found that β-arrestin redistribution relies on D6 phosphorylation, yet neither β-arrestins nor D6 phosphorylation is required for scavenging.34 Therefore, by controlling D6 phosphorylation, IBCs might be able to rapidly fine-tune responsiveness to CXCL13 without affecting scavenging.
IBCs are the sole D6active leukocyte subset detectable in resting mice, and D6 activity is a unifying feature of this heterogeneous B-cell population. Our study reveals, in unprecedented detail, the remarkable complexity of the body cavity B1-cell compartments, and identifies novel B1-cell subsets (B1d and CD23+ B1a-d). Through chemokine scavenging and suppression of CXCL13 responsiveness, D6 plays a dual role on IBCs, and this controls the cellularity of the IBC compartment and its ability to generate anti-PC Abs. It is now critical to define whether and how IBCs contribute to the well-documented ability of D6 to suppress tissue inflammation.
The online version of this article contains a data supplement.
The publication costs of this article were defrayed in part by page charge payment. Therefore, and solely to indicate this fact, this article is hereby marked “advertisement” in accordance with 18 USC section 1734.
Acknowledgments
This study was funded by Arthritis Research UK (C.A.H.H., I.B.M., C.S.G., and R.J.B.N.), by the Biotechnology and Biological Sciences Research Council (C.A.H.H., C.S.G., and R.J.B.N.), by the Medical Research Council (Y.B. and R.J.B.N.), and by the Wellcome Trust (L.F., R.K., and R.J.B.N.). R.J.B.N. acknowledges the support of Dr Wilson.
Authorship
Contribution: C.A.H.H. performed most of the experiments, analyzed data, designed experiments, and contributed to writing the manuscript; C.S., R.K., L.F., and Y.B. helped with the experiments; I.B.M. helped with early experimental design; C.S.G. helped to design experiments, analyzed data, and edited the manuscript; and R.J.B.N. conceived and directed the study, analyzed data, prepared figures, and wrote the manuscript.
Conflict-of-interest disclosure: The authors declare no competing financial interests.
The current affiliation of C.S. is Translational Gastroenterology Unit, Experimental Medicine Division, Nuffield Department of Clinical Medicine, John Radcliffe Hospital, University of Oxford, Oxford, United Kingdom.
Correspondence: Robert Nibbs, Institute of Infection, Immunity and Inflammation, Glasgow Biomedical Research Centre, 120 Uni-versity Place, University of Glasgow, Glasgow, United Kingdom; e-mail: robert.nibbs@glasgow.ac.uk.

