Abstract
HOX homeobox genes are important regulators of normal and malignant hematopoiesis. Abdominal-type HOXA genes like HOXA9 are highly leukemogenic. However, little is known about transformation by anterior HOXA genes. Here we performed a comprehensive assessment of the oncogenic potential of every HOXA gene in primary hematopoietic cells. With exception of HOXA2 and HOXA5, all HOXA genes caused a block or delay of hematopoietic differentiation and cooperated with Meis1. No evidence for the alleged tumor-suppressor function of HOXA5 could be found. Whereas all active HOXA genes immortalized mixed granulocytic/monocytic populations, HOXA13 preferentially specified monocytoid development. The anterior HOXA genes HOXA1, HOXA4, and HOXA6 transformed cells, generating permanent cell lines, although they did so less potently than HOXA9. Upon transplantation these lines induced myeloproliferation and acute myeloid leukemia in recipient animals. Kinetic studies with inducible HOX derivatives demonstrated that anterior HOXA genes autonomously contributed to cellular transformation. This function was not mediated by endogenous Hoxa9, which was persistently expressed in cells transformed by anterior HOX genes. In summary our results demonstrate a hitherto unexpected role of anterior HOXA genes in hematopoietic malignancy.
Introduction
Next to their role in determining the identity of body segments throughout embryogenesis, the clustered HOX homeobox genes also control differentiation and self-renewal of hematopoietic stem and precursor cells. In particular genes of the HOXA cluster and to a lesser extent of the HOXB group are highly transcribed in hematopoietic precursors. During maturation HOX expression is gradually extinguished.1 An ectopic expression of HOX genes therefore has profound consequences for hematopoiesis. One prominent example is HOXB4, which controls stem cell pool size. As a consequence, artificial introduction of HOXB4 can be used to expand hematopoietic stem cell numbers.2,3 A relative overexpression of HOX genes also is a hallmark of many hematological malignancies, and a high concentration of HOXA9 in leukemic blasts has been shown to be an adverse prognostic parameter.4 Proper HOX control is frequently lost in acute myeloid leukemia (AML), where these genes can be erroneously activated by mutations of their upstream regulators CDX2 and CDX4.5-8 Also, mixed-lineage leukemia (MLL) fusion proteins in MLL induce aberrant HOX transcription, and the HOX expression pattern is a characteristic diagnostic criterion for this type of leukemia.9 In several cases of T-cell acute lymphoblastic leukemia (ALL), a recurrent inversion inv(7)(p15q34) places part of the HOXA cluster under control of the promoter normally driving the T-cell receptor. As a consequence, this genetic aberration leads to inappropriate HOX transcription.10,11 In addition, various HOX genes are directly involved in leukemogenic fusions with nucleoporins. HOXA9, for example, is fused to NUP98 by a translocation t(7;11)(p15;p15) that is frequently detected as sole genetic anomaly in AML.12,13
In addition to these clinical observations, direct experimental evidence also illustrates the oncogenic capacity of HOX proteins. HOXA9 and HOXA7, as well as their protein dimerization partner MEIS1 (another homeobox gene of the “3-amino-acid-loop-extension = TALE” class), frequently were coactivated in retroviral tagging experiments.14 Likewise, artificial overexpression of HOXA7, HOXA9, or HOXA10 in combination with MEIS1 caused leukemia in animal models.1 The coexpression of MEIS1 accelerates HOX-driven leukemogenesis by activation of genes that also are present in hematopoietic stem cells.15-18
In summary, all available data point to a major role in particular of the “posterior” HOXA genes A7 to A10 as important hematopoietic oncogenes. Despite this HOX dominance in leukemia, a systematic, comparative assessment of the transforming capacity of all HOXA genes has never been undertaken. It is unknown why posterior HOX genes appear to predominate. Moreover, there are conflicting results of whether individual HOX genes are necessary for transformation or whether leukemogenesis is the consequence of a coordinated action involving the combined action of several HOX genes. Especially in the case of MLL fusion proteins that activate expression of many HOX genes,19 highly contradictory reports have been published. Whereas a loss of either Hoxa9 or Hoxa7 seemed to impair transformation by MLL-ENL,20 later it was demonstrated by the same laboratory that neither Hoxa9 nor Hoxa7 were necessary for transformation by MLL-GAS7.21 In a similar direction, knock-down of HOXA9 significantly impaired growth and leukemogenicity of a variety of human MLL cell lines,22 whereas MLL-AF9 knock-in animals still developed leukemia even in a Hoxa9-null background.23
Here we provide the first comprehensive and comparative assessment of the transforming capacity of all HOXA genes in primary hematopoietic cells. We show that the oncogenic activity of HOXA proteins extends beyond the known oncogenes A7 to A10 to anterior HOXA genes HOXA1, HOXA4, and HOXA6 and demonstrate that these genes act autonomously and not simply through activation of HOXA9. Rather HOXA9 expression is associated with a certain state of myelomonocytic differentiation. This provides a likely explanation for the predominance of HOXA9. At the same time this gene may or may not be necessary for transformation, depending on whether the combined oncogenic capacity of the other coexpressed HOX genes is sufficient to keep the cells in a proliferative precursor state.
Methods
Plasmids, cells, and antibodies
The cDNAs of all human HOXA genes were amplified by polymerase chain reaction (PCR) either from clones of the I.M.A.G.E. collection (obtained through ImaGenes) or from cDNA derived from a mix of various human cell lines. An HA epitope tag was inserted immediately upstream of the ATG of each reading frame, and the whole construct was cloned into the retroviral vector pMSCVhygro (Clontech, a Takara Bio Company). Meis1 inserted into pMSCVneo was a laboratory stock. Primary hematopoietic cells were isolated from bone marrow of mice pretreated 5 days before marrow harvest with 150 mg/kg 5-fluorouracil (Sigma-Aldrich). Retroviral packaging was performed in the phoenix-E packaging line.24 Antibodies for Western blot detection and fluorescence-activated cell sorting (FACS) were from Sigma-Aldrich, BD Biosciences, or ImmunoTools.
Replating assay
The transforming potential of HOXA proteins was determined by serial replating assays as previously reported.25,26 In this experiment an inhibition of hematopoietic differentiation is detected as surrogate parameter for transformation activity. A block in differentiation can be visualized as enhanced clonogenic capacity of hematopoietic precursor cells after repeated replating in semisolid medium. In short, primary bone marrow cells were transduced either individually with HOXA constructs or with a combination of HOXA and Meis1 viruses. Subsequently the cells were cultured and replated 3 times every 5 to 7 days in MethoCult (M3234) methylcellulose medium (StemCell Technologies) under appropriate antibiotic selection. Recombinant, murine cytokines (PeproTech) were present in the following concentrations: interleukin-3, interleukin-6, granulocyte/macrophage colony-stimulating factor, 10 ng/mL; stem cell factor, 100 ng/mL. Replating assays were performed 2 to 4 times per construct. For derivation of cell lines, colonies of the fourth plating round were explanted and grown in RPMI1640 supplemented with cytokines as described previously. Cells proliferating continuously for longer than 2 months in liquid culture were considered immortalized.
Transplantation experiments
Primary hematopoietic cells from 8-week-old BALB/C mice were infected with retroviruses coding for Meis1 and HOXA1, HOXA4, HOXA6, or HOXA9 as described previously. After selection for 2 rounds in methocel 1 × 10⁶ transduced cells were transplanted together with 1 × 10⁶ normal bone marrow cells as radioprotectant into lethally irradiated (9 Gy) syngenic recipients by tail vein injection. All mice experiments were approved by the University Erlangen Institutional Review Board.
mRNA quantification
All mRNA concentrations were measured by SYBR-green–based quantitative reverse-transcription PCR (qRT-PCR) by the use of Stratagene chemistry on a Stratagene MX3000P real-time cycler according to the instructions of the manufacturer. Primers were designed spanning introns, and primer sequences are available on request. Calibration across biological replicates was performed by normalizing to β-actin levels and relative quantities were determined by the 2−ΔΔCt method. All HOXA PCR products were cloned into pBluescript, and known quantities of purified plasmids were used to determine an absolute calibration factor for each primer pair (amplification efficiency) that was factored into the relative actin/gene ratio to allow interprimer comparisons. All data are plotted as average and SD of triplicates.
Results
Concordance of HOXA expression extends to anterior HOXA genes
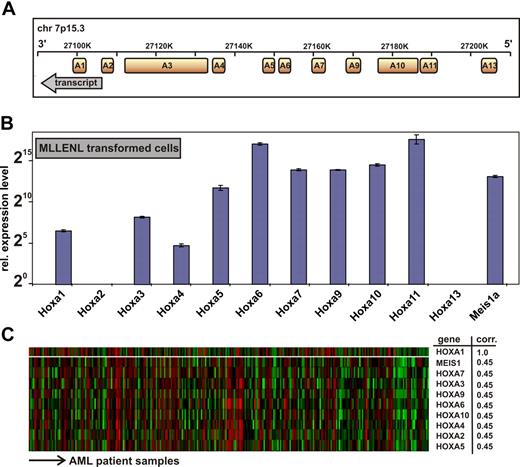
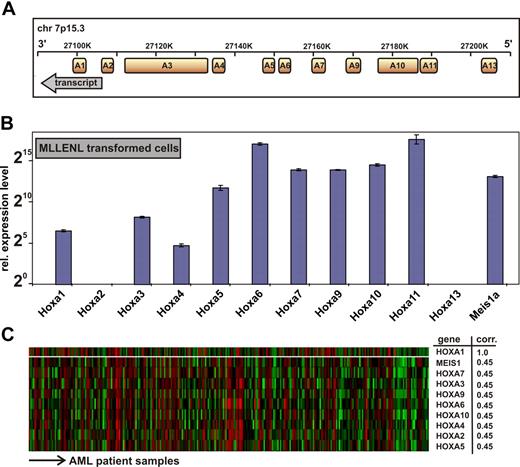
All human HOXA genes are tightly clustered in an approximately 100-kb stretch on chromosome 7p15.3 with anterior genes A1 to A6 (related to labial, proboscipedia, deformed, sex-combs reduced, and antennapedia genes in Drosophila) located 3′ of the posterior genes (Figure 1A).27 The mammalian posterior HOX genes representing fly ultrabithorax and abdominal (HOXA7 to HOXA13) have been found widely involved in leukemia. In addition, to obtain further insight into the function of anterior HOXA genes in malignant hematopoiesis, we first revisited the HOX expression pattern in leukemia samples. Because MLL fusion proteins are upstream regulators of HOX gene expression, we determined the complete HOXA signature in MLLENL-transformed murine primary cells by quantitative qRT-PCR (Figure 1B). To enable an absolute comparison between HOX transcript levels, each primer pair was calibrated against a plasmid standard. Although HOX transcript levels varied considerably with an approximately 1000-fold difference between HOXA4 and HOXA11, all HOXA genes with exception of A2 and A13 were present in MLLENL-transformed cell lines.
Genomic organization and expression of HOXA genes in leukemia cells. (A) Transcript map of the human HOXA cluster on chromosome 7p15.3. The map is drawn according to scale. Transcript direction is indicated by an arrow. (B) Hoxa expression pattern in a murine MLLENL-transformed cell line. Transcript levels were quantitatively determined by q-RT PCR corrected for amplification efficiency across primer pairs and normalized to actin. Given are average values and standard deviations for triplicates with a relative expression level of one unit (20) corresponding to a ΔCt = 20 with respect to actin. (C) Correlation of HOXA gene expression across a sample set of 285 cases of AML.27 Shown are HOXA genes with a significant correlation to HOXA1 expression (top line) across samples as determined by Oncomine, an expression database search and analysis tool (http://www.oncomine.org). Each line of the heat map corresponds to a HOXA gene as indicated to the right, and each column is indicative for a single patient sample. “corr” indicates correlation coefficient, indicating the degree of concordant expression within a single patient sample.
Genomic organization and expression of HOXA genes in leukemia cells. (A) Transcript map of the human HOXA cluster on chromosome 7p15.3. The map is drawn according to scale. Transcript direction is indicated by an arrow. (B) Hoxa expression pattern in a murine MLLENL-transformed cell line. Transcript levels were quantitatively determined by q-RT PCR corrected for amplification efficiency across primer pairs and normalized to actin. Given are average values and standard deviations for triplicates with a relative expression level of one unit (20) corresponding to a ΔCt = 20 with respect to actin. (C) Correlation of HOXA gene expression across a sample set of 285 cases of AML.27 Shown are HOXA genes with a significant correlation to HOXA1 expression (top line) across samples as determined by Oncomine, an expression database search and analysis tool (http://www.oncomine.org). Each line of the heat map corresponds to a HOXA gene as indicated to the right, and each column is indicative for a single patient sample. “corr” indicates correlation coefficient, indicating the degree of concordant expression within a single patient sample.
MLL aberrations occur only in a minor subset of acute leukemia with aberrant HOX gene expression. Therefore, we wanted to know whether anterior HOX expression is also detectable in a larger set of real patient data not restricted to MLL cases. For this purpose we performed a search in Oncomine (http://www.oncomine.org) across 285 samples of AML27 regardless of their chromosomal abnormality. (Among these, only 19 patients were diagnosed with an 11q23 abnormality.) This analysis revealed that expression of HOX genes from HOXA1 to HOXA10, which include anterior HOX genes, was highly concordant across the complete spectrum of AML (Figure 1C).
HOXA expression affects hematopoietic differentiation and transforms cells
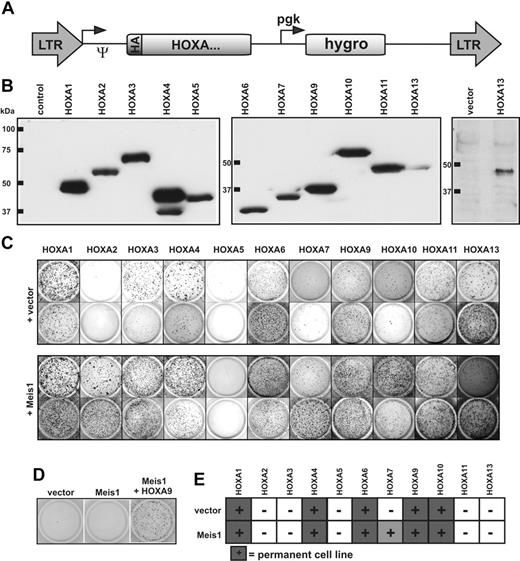
To assess the transforming potential of each HOXA gene individually, all human HOXA cDNAs were cloned into a retroviral vector backbone in a uniform format. To aid detection, a HA epitope tag was added to the amino-terminus of each reading frame (Figure 2A). Immunoblotting confirmed correct expression of all constructs (Figure 2B). Hematopoietic transformation leads to an increase in clonogenic capacity of hematopoietic precursor cells. Therefore, the oncogenic properties of HOXA proteins were probed by a colony-forming assay (CFC test). Primary hematopoietic precursor cells were retrovirally transduced with each HOXA gene either alone or in combination with the HOX-dimerization partner Meis1 (because the human MEIS1 cDNA was not available, the highly conserved murine version was used). The transduced cells were cultured in selective methylcellulose medium supplemented with cytokines. Cells from dispersed colonies were subject to 3 replatings at 5- to 7-day intervals. Whereas normal cells differentiate and stop proliferation, cells containing a transforming agent cease differentiation and also form colonies in later replating rounds. With the exception of HOXA2 and HOXA5, all other HOXA genes reproducibly and consistently induced colony formation, indicating an effect on hematopoietic differentiation (Figure 2C).
Analysis of the HOXA transforming potential in primary hematopoietic cells. (A) Schematic map of the retroviral constructs used in this study. The expression of the HA-tagged HOXA cDNAs is driven by the long terminal repeat (LTR) promoter of pMSCVhygro (Ψ-packaging signal), whereas the hygromycin resistance gene is under control of a phosphoglycerate kinase (pgk) promoter. (B) HA-specific immunoblot of cellular proteins extracted from retroviral packaging cell lines transfected as indicated. To exclude a potential spill-over of HA-HOXA11 into the HA-HOXA13 lane, expression of HA-HOXA13 is shown again next to a vector control in a separate blot. Please note that because of the highly acidic carboxy-terminus, HA-HOXA7 migrates aberrantly slow in sodium dodecyl sulfate–polyacrylamide gel electrophoresis. (C) Serial replating assays of HOXA-transduced cells. The figure shows colonies arising after 3 replating rounds. Cells were transduced with HOXA genes either individually or in combination with Meis1 as indicated. Two typical examples for each construct are shown of up to 4 experiments performed in total. (D) Replating assays with Meis1. Transduction of Meis1 alone did not have any effect on hematopoietic differentiation, as evidenced by a lack of colony-forming capacity in replating assays like those described previously. (E) Generation of HOXA-transformed cell lines. HOXA or HOXA/Meis1-transduced cells that were able to generate permanently growing cell lines (> 2 months continuously in culture) at least twice in 3 attempts are marked by filled squares. HOXA7 yielded lines only in the presence of Meis1.
Analysis of the HOXA transforming potential in primary hematopoietic cells. (A) Schematic map of the retroviral constructs used in this study. The expression of the HA-tagged HOXA cDNAs is driven by the long terminal repeat (LTR) promoter of pMSCVhygro (Ψ-packaging signal), whereas the hygromycin resistance gene is under control of a phosphoglycerate kinase (pgk) promoter. (B) HA-specific immunoblot of cellular proteins extracted from retroviral packaging cell lines transfected as indicated. To exclude a potential spill-over of HA-HOXA11 into the HA-HOXA13 lane, expression of HA-HOXA13 is shown again next to a vector control in a separate blot. Please note that because of the highly acidic carboxy-terminus, HA-HOXA7 migrates aberrantly slow in sodium dodecyl sulfate–polyacrylamide gel electrophoresis. (C) Serial replating assays of HOXA-transduced cells. The figure shows colonies arising after 3 replating rounds. Cells were transduced with HOXA genes either individually or in combination with Meis1 as indicated. Two typical examples for each construct are shown of up to 4 experiments performed in total. (D) Replating assays with Meis1. Transduction of Meis1 alone did not have any effect on hematopoietic differentiation, as evidenced by a lack of colony-forming capacity in replating assays like those described previously. (E) Generation of HOXA-transformed cell lines. HOXA or HOXA/Meis1-transduced cells that were able to generate permanently growing cell lines (> 2 months continuously in culture) at least twice in 3 attempts are marked by filled squares. HOXA7 yielded lines only in the presence of Meis1.
Surprisingly, Meis1 augmented the efficacy of all HOXA genes except HOXA5, resulting in a more vigorous growth and increased colony numbers (Figure 2C and not shown). In the presence of Meis1 even HOXA2 displayed CFC activity, although this gene by itself was inactive. The impact of Meis1 was clearly cooperative because Meis1 alone had no effect (Figure 2D). To discriminate delayed maturation from true growth transformation, cells from the fourth round of plating were transferred to liquid media to allow cell lines to grow. Most HOX-transduced cells eventually completed development and ceased proliferation. As expected, cells expressing posterior HOX genes A9 and A10 as well as cells transduced with HOXA7 in combination with Meis1 reproducibly established permanent cell lines. Notably, however, anterior HOX genes HOXA1, HOXA4, and HOXA6 with or without Meis1 also were able to immortalize cells. These lines proliferated continuously for several months in culture without any sign of crisis, indicating a true transformation event (Figure 2E). Interestingly, colony numbers obtained in the replating assays did not necessarily predict the outgrowth of cell lines. For example, HOXA10 consistently yielded lower numbers of colonies than the related HOXA11; yet, HOXA10 cell lines could be reliably derived, whereas this was not feasible with HOXA11.
HOXA5 does not act as tumor suppressor in the hematopoietic lineage
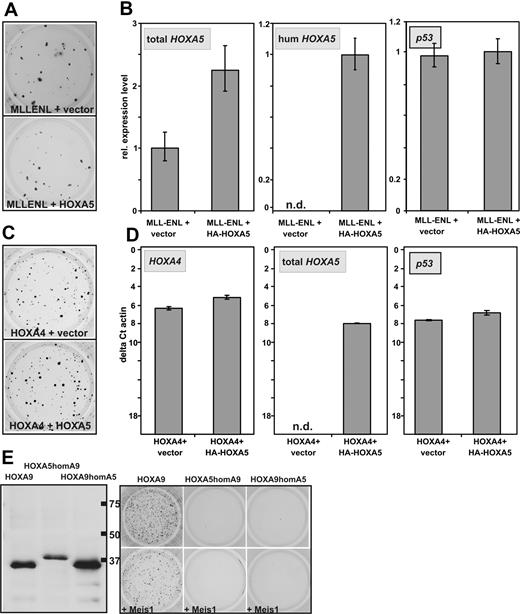
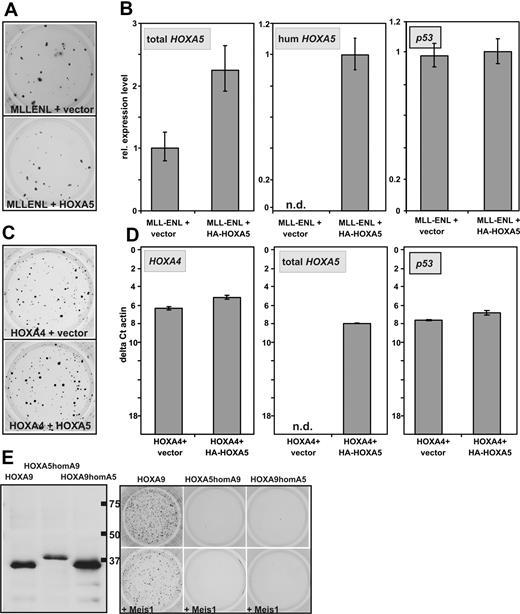
In breast cancer HOXA5 has been described as tumor suppressor gene that is able to induce transcription of p53.28,29 In leukemia, a relative hypermethylation and therefore lower expression of HOXA5 has been associated with improved survival.30,31 To test whether the auspicious absence of CFC capacity of HOXA5 is caused by a putative tumor suppressor function, it was tested whether HOXA5 is able to counteract the transforming ability of MLLENL. For this purpose hematopoietic precursors were transduced with MLLENL and either HOXA5 or empty vector as control. Cells were plated in hygromycin selecting for the presence of the HOXA5 provirus. In these experiments cotransduction of HOXA5 had no significant effect on colony formation induced by MLLENL (Figure 3A). This was not attributable to a defect in the retroviral construct because human HOXA5 expression could be specifically detected (Figure 3B) and total HOXA5 (human and murine) was increased significantly in MLLENL/HOXA5 double-transformed cells. Also, p53 transcription was not induced by additional HOXA5.
Absence of HOXA5 tumor suppressor properties in hematopoietic cells. (A) Typical example of a replating assay with cells transduced with MLLENL and HOXA5 or empty vector as control. (B) Relative levels of total HOXA5 (ie, murine and transduced human HOXA5), human HOXA5, and p53 mRNAs in cells explanted from a replating assay as shown in panel A. (C) Typical example of a replating assay performed with cells cotransduced with HOXA4 and HOXA5 or control vector as indicated. (D) Transcript levels of HOXA4, HOXA5 (total HOXA5), as well as of p53 were determined by qRT-PCR in cells transduced either with HOXA4/HOXA5 or HOXA4/vector as control. To allow a direct comparison of HOXA4 and HOXA5 expression levels, the scale is given in absolute units relative to β-actin (as ΔCt vs β-actin). (E) Homeobox-swap experiments. (Left) HA-specific immunoblot of swap-constructs exchanging the homeobox motif of HOXA5 against the homeobox of HOXA9 (HOXA5homA9) or vice versa (HOXA9homA5). Normal HOXA9 is shown for comparison. (Right) Typical result of a colony-forming assay in which swap-mutants are used.
Absence of HOXA5 tumor suppressor properties in hematopoietic cells. (A) Typical example of a replating assay with cells transduced with MLLENL and HOXA5 or empty vector as control. (B) Relative levels of total HOXA5 (ie, murine and transduced human HOXA5), human HOXA5, and p53 mRNAs in cells explanted from a replating assay as shown in panel A. (C) Typical example of a replating assay performed with cells cotransduced with HOXA4 and HOXA5 or control vector as indicated. (D) Transcript levels of HOXA4, HOXA5 (total HOXA5), as well as of p53 were determined by qRT-PCR in cells transduced either with HOXA4/HOXA5 or HOXA4/vector as control. To allow a direct comparison of HOXA4 and HOXA5 expression levels, the scale is given in absolute units relative to β-actin (as ΔCt vs β-actin). (E) Homeobox-swap experiments. (Left) HA-specific immunoblot of swap-constructs exchanging the homeobox motif of HOXA5 against the homeobox of HOXA9 (HOXA5homA9) or vice versa (HOXA9homA5). Normal HOXA9 is shown for comparison. (Right) Typical result of a colony-forming assay in which swap-mutants are used.
Similar results were obtained in cells cotransduced with HOXA4 and HOXA5. HOXA4-transformed cells normally do not express endogenous Hoxa5 (see Figure 6A). Again cotransduction of HOXA5 did not significantly affect colony formation or p53 transcript abundance despite the induction of HOXA5 expression to a level comparable with the amount of HOXA4 in the cells (Figure 3C-D). To elucidate whether the exceptional behavior of HOXA5 is attributable to differences in the homeodomain or whether it is dependent on other effector regions of this protein, swap mutants were constructed exchanging the homeodomains of HOXA5 and HOXA9. Despite correct expression, neither HOXA5 containing the HOXA9 homeodomain nor the opposite construct displayed any detectable transforming ability regardless of Meis1 coexpression (Figure 3E). This finding suggested that homeobox-dependent homing on target genes is not the only factor that distinguishes HOXA5 from the other HOXA cluster proteins.
HOXA13 transduction favors monocytic development
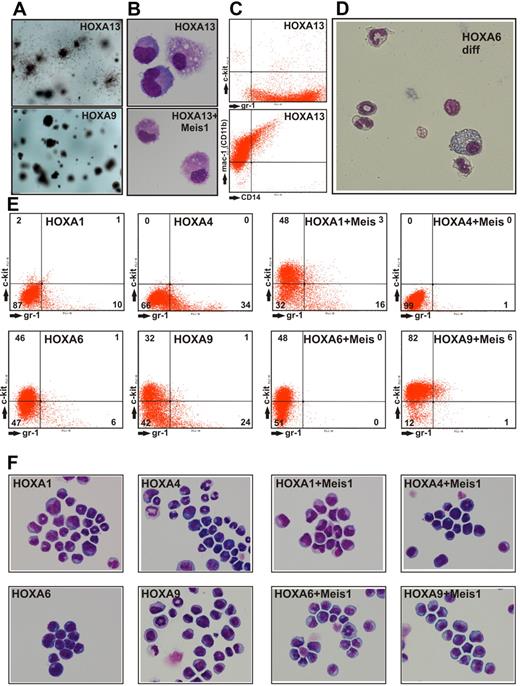
During replating assays we noted that cells expressing HOXA13 showed colony morphology different from all other HOXA-transduced cultures. HOXA13 colonies were prominently surrounded by cells that appeared mobile (Figure 4A). This result was not simply attributable to terminal differentiation into macrophages because HOXA13 cells explanted from methocel were still proliferating for 2 to 3 weeks in liquid culture. HOXA13-transduced cells were characterized by an exclusively monocytic/macrophage phenotype (Figure 4B). These cells also proved to be highly positive for the surface markers Gr-1 (Ly-6G), Mac-1 (CD11b), and a subpopulation also carried CD14 (Figure 4C). No c-Kit expression was detected, excluding the outgrowth of a mast cell population. In contrast to HOXA13 cells, all other cell populations obtained by transduction with HOXA genes also could develop into granulocytes. The mixed granulocytic/monocytic potential of these cells became especially clear during terminal differentiation elicited by inactivation of the transforming HOX gene (achieved by conditional HOXA derivatives, see below and Figure 4D).
Characterization of HOXA-transduced cells. (A) Macroscopic aspect of methylcellulose cultures after 2 rounds of replating. HOXA13-transduced cells formed colonies surrounded by dispersed cells, whereas all other HOXA genes created colonies akin to the typical example of HOXA9transduced cells. (B) May-Grünwald-Giemsa–stained cytospin samples of cells explanted from a CFC assay of HOXA13 or HOXA13/ Meis1-transduced cells. Microphotographs of May-Grünwald-Giemsa–stained cells were taken at room temperature with a Nikon Digital Sight DS-Fi1 electronic camera attached to a Zeiss Axioskop with a Zeiss Neofluar 63×/1.25 objective and processed with Corel Draw software without any image enhancements. (C) FACS analysis of HOXA13-transduced cells explanted from methocel. (D) Morphology of cells obtained 6 days after inactivation of a conditional derivative of HOXA6 (HOXA6-ER). In the absence of the transforming HOX gene, cells stop proliferation and form mixed granulocytic/monocyte/macrophage cultures. Microphotograph was taken as described for panel B except that a 40× objective was used. (E) FACS staining of permanent cell lines derived from cells transduced with HOXA1, HOXA4, and HOXA6 either individually or in combination with Meis1 as indicated. As control similar lines derived from HOXA9 transduced cells are shown. Staining was performed with phycoerythrin-conjugated anti-Kit and fluorescein isothiocyanate-labeled anti-Gr-1 antibodies. (F) May-Grünwald-Giemsa–stained cytospins of the cells shown in panel A. Microphotographs of May-Grünwald-Giemsa–stained cells were taken at room temperature with a Nikon Digital Sight DS-Fi1 electronic camera attached to a Zeiss Axioskop with a Zeiss Neofluar 40×/1.25 objective and processed with Corel Draw software without any image enhancements.
Characterization of HOXA-transduced cells. (A) Macroscopic aspect of methylcellulose cultures after 2 rounds of replating. HOXA13-transduced cells formed colonies surrounded by dispersed cells, whereas all other HOXA genes created colonies akin to the typical example of HOXA9transduced cells. (B) May-Grünwald-Giemsa–stained cytospin samples of cells explanted from a CFC assay of HOXA13 or HOXA13/ Meis1-transduced cells. Microphotographs of May-Grünwald-Giemsa–stained cells were taken at room temperature with a Nikon Digital Sight DS-Fi1 electronic camera attached to a Zeiss Axioskop with a Zeiss Neofluar 63×/1.25 objective and processed with Corel Draw software without any image enhancements. (C) FACS analysis of HOXA13-transduced cells explanted from methocel. (D) Morphology of cells obtained 6 days after inactivation of a conditional derivative of HOXA6 (HOXA6-ER). In the absence of the transforming HOX gene, cells stop proliferation and form mixed granulocytic/monocyte/macrophage cultures. Microphotograph was taken as described for panel B except that a 40× objective was used. (E) FACS staining of permanent cell lines derived from cells transduced with HOXA1, HOXA4, and HOXA6 either individually or in combination with Meis1 as indicated. As control similar lines derived from HOXA9 transduced cells are shown. Staining was performed with phycoerythrin-conjugated anti-Kit and fluorescein isothiocyanate-labeled anti-Gr-1 antibodies. (F) May-Grünwald-Giemsa–stained cytospins of the cells shown in panel A. Microphotographs of May-Grünwald-Giemsa–stained cells were taken at room temperature with a Nikon Digital Sight DS-Fi1 electronic camera attached to a Zeiss Axioskop with a Zeiss Neofluar 40×/1.25 objective and processed with Corel Draw software without any image enhancements.
Anterior HOX genes immortalize myelomonocytic cells
To characterize the cell lines generated by HOXA1, HOXA4, and HOXA6 in comparison with HOXA9-transformed cells, the surface marker profile and the microscopic phenotype were determined by FACS and cytospin experiments. During myeloid differentiation down-regulation of the precursor associated protein c-Kit (CD117) is followed by a gradual increase of the differentiation marker Gr-1 (Ly-6G). Therefore, the differentiation state of cells can be determined by measuring these 2 surface molecules. The distribution of Gr-1– and c-Kit–positive cells suggested that HOXA9 and HOXA6 blocked differentiation at an earlier stage than HOXA1 and HOXA4 (Figure 4E). Coexpression of Meis1 had a cooperative effect on all HOXA genes tested because cell lines containing HOXA and Meis1 contained less Gr-1 and/or more c-Kit–positive cells compared with their “HOX-only” counterparts. These findings were mirrored by the cytospin experiments (Figure 4F) as a more differentiated immunophenotype correlated to an increased number of cells with granulocytic nuclear morphology (indentured, ring-shaped, and lobular nuclei).
Anterior HOX genes induce myeloproliferation and AML in animals
To further investigate the oncogenic capacity of anterior HOXA genes transplantation assays were performed. For this purpose primary hematopoietic cells were cotransduced with Meis1 and HOXA1, HOXA4, HOXA6, or with HOXA9 as control. Cotransduction of Meis1 was chosen because it is known that in the absence of this cooperative factor even the strong oncogene HOXA9 induces leukemia only with long latency and reduced penetrance.32
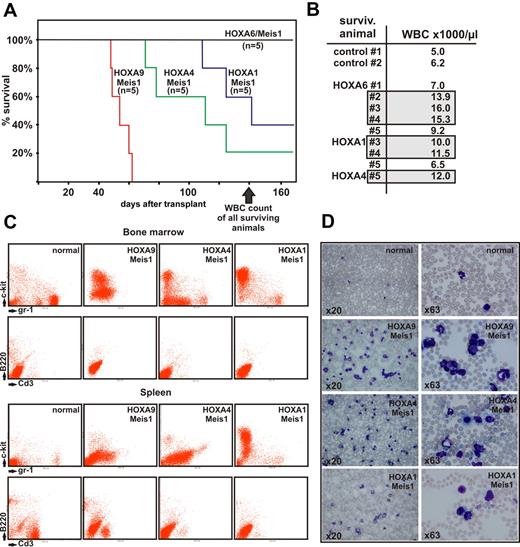
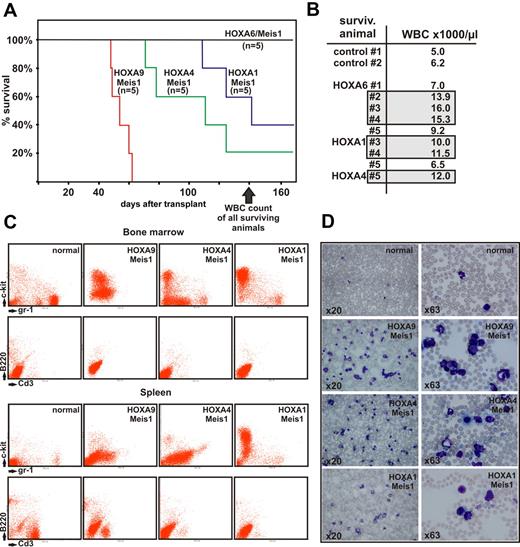
Lethally irradiated, syngenic recipients were transplanted with 1 × 10⁶ transduced cells and 1 × 10⁶ normal bone marrow cells as radioprotectant. Animals were kept with normal chow and water ad libitum. After a latency of approximately 50 days the first recipients started to show signs of advanced disease, such as ruffled fur, hunched posture, pale ears, and labored breathing. At 140 days after transplantation 11 of 20 animals died (Figure 5A), and 6 of 9 remaining animals demonstrated elevated peripheral blood counts with white blood cell (WBC) numbers exceeding 10 000/μL (Figure 5B).
Transplantation experiments. (A) Kaplan-Meier survival curve of animals transplanted with hematopoietic precursors transduced with a HOXA gene and Meis1 as indicated (n = 5 for each cohort of animals). The figure depicts the state of the experiment at 140 days after transplantation. (B) WBC counts in peripheral blood of surviving animals from panel A (transduced with HOXA/Meis1) at 140 days after transplant. Gray boxes indicate individuals with elevated WBC numbers (>10 000 cells/μL) in each group. Control animals were age-matched nontransplanted ones. (C) FACS analysis of bone marrow and spleen cells from euthanized animals. Cells were double-stained as noted either for c-Kit and Gr-1 as precursor/granulocytic markers or with B220/CD3 to detect lymphoid cells. Each set of panels shows a representative sample of a single animal. (D) Peripheral blood smears stained with May-Grünwald-Giemsa. Blood was taken from the same animal as analyzed in panel C, stained, and microphotographs were taken at 2 different magnifications as described for Figure 4.
Transplantation experiments. (A) Kaplan-Meier survival curve of animals transplanted with hematopoietic precursors transduced with a HOXA gene and Meis1 as indicated (n = 5 for each cohort of animals). The figure depicts the state of the experiment at 140 days after transplantation. (B) WBC counts in peripheral blood of surviving animals from panel A (transduced with HOXA/Meis1) at 140 days after transplant. Gray boxes indicate individuals with elevated WBC numbers (>10 000 cells/μL) in each group. Control animals were age-matched nontransplanted ones. (C) FACS analysis of bone marrow and spleen cells from euthanized animals. Cells were double-stained as noted either for c-Kit and Gr-1 as precursor/granulocytic markers or with B220/CD3 to detect lymphoid cells. Each set of panels shows a representative sample of a single animal. (D) Peripheral blood smears stained with May-Grünwald-Giemsa. Blood was taken from the same animal as analyzed in panel C, stained, and microphotographs were taken at 2 different magnifications as described for Figure 4.
As expected, HOXA9 in combination with Meis1 had the strongest oncogenic effect, with all animals succumbing to advanced leukemia at day 52. Interestingly, and contrary to our expectations, HOXA4/Meis1-transduced cells caused leukemia with a shorter latency than HOXA1/Meis1 or HOXA6/Meis1 cells. In vitro HOXA4/Meis1 cells were blocked at a later stage of differentiation than their HOXA1/Meis1 or HOXA6/Meis1 counterparts (Figure 4E). Regardless of the latency period, all animals experienced a very similar disease phenotype. Macroscopically, splenomegaly (130-1200 mg spleen weight, normal control animals < 100 mg) was accompanied by a pale appearance of liver and bone marrow. FACS analysis revealed an extensive infiltration of spleen and bone marrow with c-Kit– and/or Gr-1–positive cells (Figure 5C). Normal lymphoid components of these organs were repressed at variable degrees. In addition a high number of myeloid cells either as blasts or in various states of differentiation could be detected in peripheral blood (Figure 5D), indicating that these animals experienced AML. Peripheral blood smears from animals with elevated blood counts but still surviving at day 140 also contained a greater than normal number of myeloid elements (not shown). This finding suggested that overt disease is preceded by a phase of myeloproliferation because it also has been observed frequently in other transplantation studies.
The role of HOXA9 in transformation by anterior HOXA genes
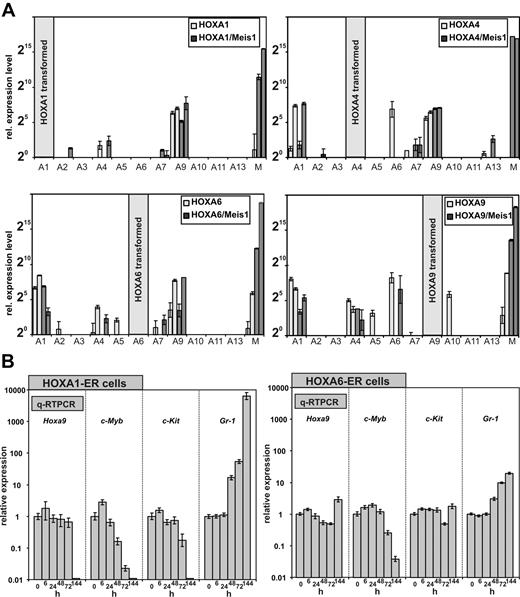
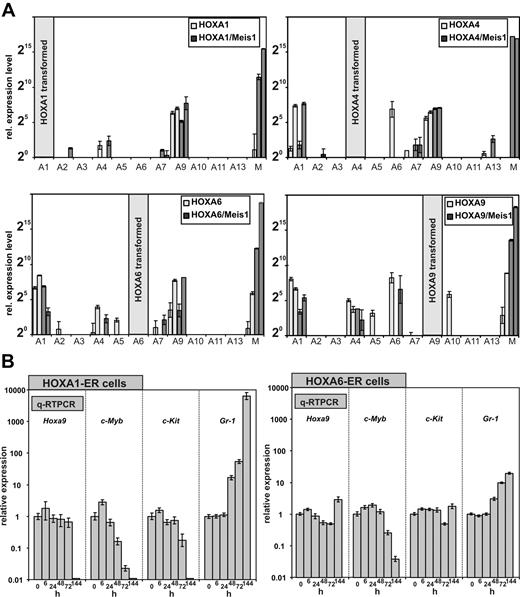
The expression of HOXA genes is frequently coordinated, and a cross-regulation of HOX genes by other HOX genes has been observed. Therefore, we wanted to determine whether the anterior HOXA genes achieve cellular transformation on their own or whether they do so by induction of their neighboring genes. For this purpose, a quantitative HOX profile was determined in cell lines transformed by HOXA1, A4, and A6 either individually or in combination with Meis1. As control a similar profiling was performed for HOXA9 and HOXA9/Meis1 cells. Surprisingly, qRT-PCR revealed that all HOXA immortalized cell lines consistently expressed Hoxa9 irrespective of Meis1 cotransduction and regardless which HOX gene was used for transformation. Other Hox genes were more sporadically detected. However, if other Hox genes were coexpressed, again a clear predominance of Hoxa1, Hoxa4, and Hoxa6 was noted (Figure 6A).
HOXA expression signature in HOXA transformed cell lines. (A) In total 4 cell lines (2 without and 2 with coexpression of Meis1) were generated by transduction with HOXA1, HOXA4, HOXA6, and as control with HOXA9. RNA was extracted from these lines, and a complete quantitative HOXA expression profile was assembled by RT-PCR. Plotted are relative HOXA (and Meis1) expression levels for cells transduced with HOX-only (light columns) or with a HOXA/Meis1 combination (dark columns). One expression unit corresponds to a ΔCt of 20 relative to actin. Plotted are average and SD of triplicates. (B left) Differentiation kinetics of cells transformed by conditional HOXA1 and HOXA6. A conditional derivative of HOXA1 was created by fusion with the tamoxifen responsive ligand binding domain of a modified estrogen receptor. Cell lines were generated in the presence of tamoxifen, and at time point “0” tamoxifen was withdrawn. RNA was extracted from these cells 6, 24, 48, 72, and 144 hours after tamoxifen depletion and absolute levels of endogenous (murine) Hoxa9, c-Myb, c-Kit, and Gr-1 were measured by q-RT PCR. c-Kit (CD117) is a marker for precursor cells whereas Gr-1 indicates differentiation. c-Myb has been described as an essential mediator of HOXA9 mediated transformation. Given are average values and standard deviations of triplicates of relative quantities calibrated to actin and normalized to concentrations in the presence of tamoxifen (= time point 0 hours). (B right) Similar experiment as described in the left panel, with the use of HOXA6-ER cells.
HOXA expression signature in HOXA transformed cell lines. (A) In total 4 cell lines (2 without and 2 with coexpression of Meis1) were generated by transduction with HOXA1, HOXA4, HOXA6, and as control with HOXA9. RNA was extracted from these lines, and a complete quantitative HOXA expression profile was assembled by RT-PCR. Plotted are relative HOXA (and Meis1) expression levels for cells transduced with HOX-only (light columns) or with a HOXA/Meis1 combination (dark columns). One expression unit corresponds to a ΔCt of 20 relative to actin. Plotted are average and SD of triplicates. (B left) Differentiation kinetics of cells transformed by conditional HOXA1 and HOXA6. A conditional derivative of HOXA1 was created by fusion with the tamoxifen responsive ligand binding domain of a modified estrogen receptor. Cell lines were generated in the presence of tamoxifen, and at time point “0” tamoxifen was withdrawn. RNA was extracted from these cells 6, 24, 48, 72, and 144 hours after tamoxifen depletion and absolute levels of endogenous (murine) Hoxa9, c-Myb, c-Kit, and Gr-1 were measured by q-RT PCR. c-Kit (CD117) is a marker for precursor cells whereas Gr-1 indicates differentiation. c-Myb has been described as an essential mediator of HOXA9 mediated transformation. Given are average values and standard deviations of triplicates of relative quantities calibrated to actin and normalized to concentrations in the presence of tamoxifen (= time point 0 hours). (B right) Similar experiment as described in the left panel, with the use of HOXA6-ER cells.
The consistent expression of endogenous Hoxa9 in the immortalized cell lines brought up the question of whether anterior HOX genes contribute directly to the observed differentiation block or whether they do so exclusively through up-regulation of Hoxa9. In the former case a shut-down of anterior HOX genes should induce cellular differentiation before possible alterations in Hoxa9 levels become detectable. Otherwise, Hoxa9 should decrease previous to differentiation. To determine the order of events, conditional derivatives of HOXA1 and HOXA6 were created. To this end HOXA1 and HOXA6 were fused at the carboxy-terminus with a tamoxifen-responsive estrogen-receptor ligand binding domain. Transduction of primary cells with these inducible HOX proteins in the presence of the inductor tamoxifen generated transformed lines with immunophenotypes comparable with lines created with the constitutive counterparts (not shown). HOXA4 did not become inducible by fusion with the estrogen receptor (ER) domain and therefore was not included in these experiments. HOXA1-ER and HOXA6-ER lines could be cultivated for longer than 2 months in tamoxifen-supplemented medium, and upon inductor withdrawal these cells stopped proliferation within 72 hours and executed a program of terminal differentiation (Figure 4D and not shown).
To clarify the epistatic relationship between HOXA1/6 and HOXA9, the kinetics of differentiation were followed by quantitative determination of transcript levels for Hoxa9, c-Kit, Gr-1, and c-Myb (Figure 6B). c-Myb has been shown previously to be an essential downstream mediator of HOXA9/Meis1-induced transformation.33 For HOXA1-ER cells, the first signs of differentiation could already be detected 48 hours after tamoxifen removal. Gr-1 levels increased significantly with a concomitant decrease in c-Myb followed by a slightly delayed down-regulation of c-Kit at 72 hours after HOXA1 inactivation. However, Hoxa9 transcript concentration did not change until 144 hours, when differentiation was far advanced and c-Myb as well as c-Kit was not present any more. This finding argued strongly against a direct regulation of Hoxa9 by HOXA1 and favored an autonomous role for HOXA1 in hematopoietic transformation. Although with delayed kinetics, comparable results were obtained also with HOXA6-ER cells (Figure 6B). At 144 hours after termination of tamoxifen treatment, neither Hoxa9 nor c-Kit showed a significant response in HOXA6-ER cells, whereas down-regulation of c-Myb and an increase in Gr-1 clearly proved the onset of differentiation. Therefore, HOXA6 did not act directly through Hoxa9 but had an independent capability to block hematopoietic differentiation.
Discussion
Here we present the first comprehensive study that compares all HOXA genes under standardized conditions for their transforming ability in the hematopoietic system. Next to the known leukemogenic HOX genes HOXA7, HOXA9, and HOXA10, 3 anterior HOXA genes (HOXA1, HOXA4, and HOXA6) displayed a clear transforming potential, and with exception of HOXA5 all other HOXA genes induced at least a delay in hematopoietic differentiation.
The auspicious absence of any impact of HOXA5 on hematopoietic maturation would appear to fit well with the known role of this gene as tumor suppressor in breast cancer cells. It has been demonstrated that this effect of HOXA5 is at least partially attributable to induction of p53.28,29 In addition it has been noted that hypermethylation of HOXA5 and an accompanying suppression of HOXA5 expression in leukemic cells is correlated with an adverse prognosis.30,31 This finding is in stark contrast to the fact that HOXA5 is coordinately expressed together with other leukemogenic HOX genes in many AML blasts and especially so in MLL fusion transformed cells.9,19 Although no hints for a transforming ability of HOXA5 could be found in our test system this gene also did not act as tumor suppressor favoring a neutral role for HOXA5. This might reconcile the conflicting data because HOXA5 expression levels may be only a secondary parameter that can be positively or negatively correlated to aggressive leukemia.
The second gene with unusual properties among the HOXA cluster was HOXA13 that had a propensity to favor development of monocytic cells and macrophages. Little is known about HOXA13 in leukemia. Taketani et al34 described a fusion of the nucleoporin NUP98 with HOXA13 in a case of monocytic leukemia, and the same publication also reports that HOXA13 is expressed more frequently in monocytic versus other leukemia lines. In addition HOXA13 was found to be activated by a translocation in a patient with T-cell ALL.35 The authors of this study performed CFC assays with HOXA13-transduced cells that also resulted in exclusive outgrowth of monocytoid cells. How HOXA13 affects lineage control will be a rewarding subject for further studies.
The remaining HOXA genes affected differentiation of a myelomonocytic precursor cell. Despite the prominent transforming potential of anterior HOX genes HOXA1, HOXA4, and HOXA6 for primary cells, this property has not yet been noted with exception of a very recent article36 that suggested an influence of HOXA6 on the proliferation of FDCPmix and other established cell lines. Interestingly, every cell line generated by transduction with anterior HOX genes invariably also expressed endogenous Hoxa9. Despite this close correlation Hoxa9 was not under direct control of the anterior neighbors. Rather Hoxa9 expression was associated with a certain state of myeloid differentiation. As a consequence, immortalization of precursors at this level of maturation would indirectly also cause coexpression of Hoxa9.
Although endogenous Hoxa9 might aid to maintain the transformed state, it clearly was not sufficient. A loss of HOXA1 or HOXA6 activity initiated differentiation before endogenous Hoxa9 levels decreased. Therefore, the anterior HOX genes clearly possess their own independent transforming potential. As a consequence, the overall phenotype will be determined by the sum of the individual inputs. This scenario provides a likely explanation for a whole series of conflicting reports in literature. HOXA9 expression is predominant in myeloid neoplasias19 and in lymphatic leukemia with MLL involvement. In addition, HOXA9 has been identified as the most reliable predictor of disease outcome.4 Still, it could not be unambiguously determined whether HOXA9 is absolutely necessary for transformation. The results presented here suggest that it may or may not, depending on whether the sum of the individual transforming activities of the other HOX genes is sufficient to offset the effect of differentiation stimuli. Figuratively, HOXA genes would be the counterweight to differentiation signals on a balance that determines the outcome between differentiation and proliferation (for a graphical representation of this concept, see supplemental Figure 1, available on the Blood website; see the Supplemental Materials link at the top of the online article). Cells generally expressing high levels of HOXA genes, such as cells transformed by certain MLL fusion proteins, might tolerate a loss of HOXA9, whereas this might tip the balance toward differentiation in other cells with lower HOX expression.
The constitutive presence of Hoxa9 in cell lines generated by anterior HOX genes is one likely reason for the surprising cooperation of these genes with Meis1. For dimerization with HOX proteins, MEIS requires a particular interaction motif37 that is encoded only in the abdominal-type HOXA genes A9 to A13. MEIS1 stabilizes the DNA interaction of HOX/MEIS1 complexes and has a profound influence on the oncogenicity of HOX proteins. Coexpression of MEIS1 dramatically accelerates leukemogenesis by HOX, and MEIS1 is required to establish a stem-cell like gene expression program in leukemic blasts of various etiology.17,38,39 In our experiment an exogenous supply of Meis1 may exert its effect through interaction with the endogenous Hoxa9 present in cells transformed by anterior HOXA genes. In this way a direct interaction with these HOXA proteins is not necessary. Alternatively, it might be possible that Meis1 interacts with anterior HOXA proteins through Pbx. It has been shown that Meis1 and Pbx can co-occupy promoters important for hematopoietic transformation.40 Anterior HOXA proteins contain Pbx binding motifs, thus enabling the formation of Meis-Pbx-HOX trimeric complexes. Interestingly, Meis1 has been previously reported to cooperate with 2 “anterior” members of the HOX-paralog group B. HOXB3 and HOXB4 are not leukemogenic by themselves; however, coexpression with Meis1 evokes a potent transforming potential of these genes.38,41 In summary, HOXA proteins are more like rheostats and less like “on-off” switches that allow the organism to fine-tune the complicated process of hematopoietic differentiation adapting it to the demands of an ever-changing environment.
The online version of this article contains a data supplement.
The publication costs of this article were defrayed in part by page charge payment. Therefore, and solely to indicate this fact, this article is hereby marked “advertisement” in accordance with 18 USC section 1734.
Acknowledgments
We thank Renate Zimmermann for technical support.
This work was supported by Deutsche Forschungsgemeinschaft (DFG) grant SL27/6-3 and in part by SFB473/D2. Equipment funding from Jose-Carerras-Stiftung and Curt-Bohnewald-Fond is gratefully acknowledged.
Authorship
Contribution: R.K.S. designed the research; C.B., S.B., D.M., M.-P.G.C., E.M., and R.K.S. performed research and collected data; C.B. and R.K.S. analyzed and interpreted data; and R.K.S. wrote the manuscript.
Conflict-of-interest disclosure: The authors declare no competing financial interests.
Correspondence: Robert K. Slany, Genetics, University Erlangen, Staudtstr 5, 91058 Erlangen, Germany; e-mail: rslany@biologie.uni-erlangen.de.
References
Author notes
C.B. and S.B. contributed equally to this work.

