

Abstract
Clinical studies have shown a large interindividual variability in rituximab exposure and its significant influence on clinical response in patients receiving similar doses of antibody. The aim of this study was to evaluate the influence of tumor burden on dose-concentration-response relationships of rituximab. Murine lymphoma cells (EL4, 8 × 10³), transduced with human CD20 cDNA and transfected with luciferase plasmid (EL4-huCD20-Luc), were intravenously injected into C57BL/6J mice. Tumor burden detection, dissemination, and progression were evaluated quantitatively by in vivo bioluminescence imaging. Different doses of rituximab (6, 12, 20, or 40 mg/kg) were infused 13 days after lymphoma cell inoculation, and rituximab serum concentrations were measured by enzyme-linked immunosorbent assay. Without rituximab, all mice developed disseminated lymphoma and died within 30 days, whereas a significant dose-response relationship was observed in mice receiving rituximab. The 20-mg/kg dose was adequate to study interindividual variability in response because 23% of mice were cured, 59% had partial response, and 18% had disease progression. Rituximab concentrations were inversely correlated with tumor burden; mice with low tumor burden had high rituximab concentrations. Furthermore, rituximab exposure influenced response and survival. Finally, using a pharmacokinetic-pharmacodynamic model, we demonstrated that tumor burden significantly influenced rituximab efficacy.
Introduction
Rituximab (MabThera, Rituxan), a chimeric IgG1κ monoclonal antibody (mAb) directed against the CD20 antigen, has dramatically improved the outcome of patients with non-Hodgkin lymphoma (NHL). It is now indicated in association with chemotherapy in both low- and high-grade NHLs and as maintenance therapy in relapsed follicular NHL. As for most antibodies, a large variability in clinical response is observed when rituximab is given as a single agent. Individual characteristics that were shown to explain this variability are genetic factors such as FcγRIIIa-158V/F polymorphism1 or factors leading to rituximab trapping, such as tumor burden,2 level of CD20 expression,3 and presence of circulating CD20.4
In phase 2 trials using rituximab as single agent in untreated patients with indolent NHL, 60% to 70% objective response was obtained5-7 and responders showed different patterns of response, with only few of them experiencing complete remission. The pivotal study8 clearly showed a large variability in rituximab exposure between patients treated for relapsed B-NHL. Because authors later demonstrated a relationship between rituximab concentrations and both clinical response and progression-free survival (a low exposure being associated with progressive disease [PD] and shorter progression-free survival),2,9,10 a trial was designed to improve rituximab individual exposure using pharmacokinetic-guided administrations.11 However, the authors failed to demonstrate a clear advantage of this approach, and responder patients still had significantly higher rituximab concentrations than nonresponders. These results underline the need for a better understanding of factors influencing rituximab exposure before new rituximab administration modalities may be proposed.
Distribution, availability, and number of tumor antigens as well as presence of circulating antigens are factors known to influence pharmacokinetics of mAbs12 and could explain part of the differences in rituximab pharmacokinetics observed between different types of B-NHL. In the pivotal study, the authors observed an inverse relationship between serum level of rituximab and both circulating B cells and tumor burden at baseline.2,8 However, patients treated after autologous stem cell transplantation and thus characterized by minimal residual disease had serum concentrations similar to those measured in relapsed patients.13 These conflicting results may be explained by the difficulty of evaluating tumor burden in clinical practice. In the pivotal study, tumor burden was defined by the maximum lesion diameter or the sum of products of the diameters of the 6 largest lesions assessed by CT scan. There is currently no technology allowing precise measurement of the mass of disseminated lymphomas in patients.14 This partly explains the lack of study analyzing the relationship between tumor volume measured by a quantitative method and rituximab concentrations and/or efficacy. Rituximab has dramatically improved the standard-of-care treatments of patients with NHLs, and there is an urgent need to quantify the dose-concentration-effect relationship of rituximab using pharmacokinetic-pharmacodynamic analysis and to identify the individual factors influencing it.
The aim of this study was therefore to characterize the dose-concentration-effect relationship of rituximab and to investigate the role of tumor burden on this relationship. We used a murine syngeneic model of lymphoma expressing human CD20 and luciferase gene (EL4-huCD20-Luc) and a quantitative bioluminescent imaging method adapted for bimodality analysis (D.D., S.P., F. Dommange, M.O., S.L., J. Golay, A.L.P., G.P., P.B., H.W., and G.C., manuscript submitted July 2008). In the present study, we observed an influence of tumor volume on rituximab exposure and response and developed a pharmacokinetic-pharmacodynamic model describing this relationship.
Methods
EL4-huCD20-Luc cell line
EL4 murine T lymphoma cells transduced with human CD20 cDNA (EL4-huCD20)15 were kindly provided by Dr J. Golay (Laboratory of Cellular and Gene Therapy “G. Lanzani,” Ospedali Riuniti, Bergamo, Italy). Plasmid containing luciferase cDNA (pCMV-Luc, Stratagene, La Jolla, CA) was transfected into EL4-huCD20 cells using Lipofectamine 2000 reagent (Invitrogen, Carlsbad, CA). Transfected cells were selected with standard medium containing 300 μg/mL G418 (Euromedex, Mundolsheim, France). Clonal EL4-huCD20 cells expressing luciferase (EL4-huCD20-Luc) were generated by limiting dilution culture of G418-resistant colonies. Intensity and stability of the luciferase and huCD20 expressions were checked before each experiment. CD20 expression was assessed by flow cytometry (Epics XL-MCL, Beckman Coulter, Fullerton, CA) using mouse CD20 mAb directly coupled with fluorescein isothiocyanate (Beckman Coulter). For analysis of antigen density, the number of membrane CD20 molecules was estimated using the specific mAb binding value provided by Qifikit assay (Dako, Trappes, France). Data were analyzed using the software System II (Beckman Coulter). For luciferase expression analysis, 20 μL lysis reagent (Luciferase Cell Culture Lysis Reagent, Promega, Charbonnières, France) was added to 2 × 10⁵ EL4-huCD20-Luc cells according to the manufacturer's recommendations. Cells were distributed in opaque wells (BandW isoplate, PerkinElmer Wallac, Waltham, MA), and 100 μL reagent containing luciferin and ATP (Luciferase Assay Reagent, Promega) was added before placing the plates in a Wallac Victor 1240 luminometer (PerkinElmer Wallac).
Syngeneic lymphoma model and bimodal imaging analysis
Animal protocols were approved by the Regional Committee of Ethics for the Animal Experimentation UNI37-014 and were in accordance with the International Guidance for Animal Care and Use.
In all experiments with tumor inoculation, C57BL/6J mice (male, 10-12 weeks of age) purchased from Charles River (L'Arbresle, France) were intravenously injected with 8 × 10³ EL4-huCD20-Luc in 200 μL phosphate-buffered saline (PBS) on day 0. Before each experiment, stability of hu-CD20 expression was checked by cytometric analysis. Thirteen days later (the time needed for a quantifiable tumor growth), a single dose of 6, 12, 20, or 40 mg/kg rituximab (ch-IgG1k anti-CD20, ch-C2B8, Mabthera; Roche, Neuilly, France) was intravenously injected. For rituximab pharmacokinetics analysis in animals without tumor, a group of mice was injected with 200 μL PBS and received 13 days later a single dose of 20 mg/kg rituximab. In some experiments, 6 mg/kg infliximab (ch-IgG1κ anti–tumor necrosis factor-α (TNF-α; Schering-Plough, Levallois Perret, France) was injected together with rituximab.
In vivo bioluminescence imaging (BLI) was performed on day 9, day 13, and then twice a week until the death of the animals. Mice were anesthetized to obtain a prolonged immobility. They were shaven off on the ventral and dorsal faces and were intraperitoneally injected with 2 mg beetle luciferin (potassium salt, Promega). Four minutes later, bioluminescence analyses were carried out using an ORCA II BT C4742-98-26 LW (Hamamatsu Photonics, Massy, France). Data acquisition and image processing were achieved using HiPic software (Hamamatsu Photonics). Merging of bioluminescence images was obtained using WASABI software version 1.5 (Hamamatsu Photonics). Matlab software version 7.0 (MathWorks, Paris, France) was used to eliminate cosmic radiations and background noise. ImageJ software (http://rsb.info.nih.gov/ij/index.html) was used to delineate regions of interest by segmentation analysis (D.D., S.P., F. Dommange, M.O., S.L., J. Golay, A.L.P., G.P., P.B., H.W., and G.C., manuscript submitted, July 2008). Complete response (CR) was defined by a complete disappearance of detectable bioluminescence signal, partial response (PR) by significant but transient reduction in bioluminescence activity, and PD by a lack of decrease of bioluminescence activity.
Antibody biodistribution was assessed using ibritumomab tiuxetan (mu-IgG1k anti-CD20, muC2B8, Zevalin, Bayer, Lys-lez-Lannoy, France) labeled with Tc99m in the same way as the manufacturer's recommendations for the labeling of yttrium 90 ibritumorab tiuxetan. Mice received 130 μCi labeled ibritumomab, and biodistribution was assessed by gamma camera (Gamma Imager, Biospace Mesures, Paris, France) every day for 3 days. Gamma Acquisition version 3.0 and Gamma Vision+ version 3.8.5 software (Biospace Mesures) were used for biodistribution data analysis. In some experiments, mice received 400 μCi labeled ibritumomab. They were killed on day 1, and antibody distribution was evaluated on 3-μm cuts of pathologic lymph nodes as previously determined by BLI analysis. Radioactivity was revealed on mammographic films for 15 minutes.
Immunohistochemistry and polymerase chain reaction analysis of tumors
Liver, spleen, kidneys, lymph nodes, and bone marrow cells from rituximab-treated and untreated mice were collected on days 9, 13, 16, 21, 24, 27, 30, and 34. On days 13, 24, and 34, the samples were examined after hematein-eosin-safran staining and were assessed for CD20 expression (clone L26; Dako Denmark, Glostrup, Denmark) by immunochemistry using the streptavidin-biotin complex technique (Lab Vision, Fremont, CA).
At the same times, liver, spleen, lymph nodes, and bone marrow cells were homogenized, and DNA was immediately purified with DNAzol BD Reagent extraction (Invitrogen) according to the manufacturer's procedures. A total of 200 ng DNA was amplified by polymerase chain reaction (PCR) in 10 mM Tris-HCl, pH 8.3, 50 mM KCl, 0.2 mM dNTP, 2 mM MgCl2 with 0.5 U Taq DNA polymerase, and 1.5 × 10⁻⁷ M of huCD20 specific primers (5′-AATTCAGTAAATGGGACTTTCCCG-3′, 5′-ACTATGTTAGATTTGGGTCTGGAG-3′). Amplifications were performed with a 5-minute denaturation step at 95°C, followed by 30 cycles of denaturation (95°C for 1 minute), annealing (64°C for 1 minute), and extension (72°C for 1 minute. PCR products were run on a 8% TBE acrylamide gel Novex (Invitrogen) and revealed by ethidium bromide (Invitrogen). A 691-pb DNA fragment containing huCD20 was detected on samples from inoculated animals. To verify DNA samples, a normal murine endogenous gene (glyceraldehyde-3-phosphate dehydrogenase, GAPDH) was also PCR amplified as control using specific primers (5′-AATGGTGAAGGTCGGTGTGAAC-3′, 5′-GAAGATGGTGATGGGCTTCC-3′) as described previously.16
Antibody concentrations
Blood samples were collected at the vein of the eye with heparin mini-capillary blood tube twice a week from day 13 to the death of the animals. Tubes were centrifuged (900g for 30 minutes) and plasma was frozen at −20°C until analysis. Rituximab and infliximab plasma concentrations were measured using enzyme-linked immunosorbent assays adapted from methods described previously.17,18 Briefly, microwell plates (Nalge Nunc International, Rochester, NY) were coated with an antirituximab idiotype monoclonal antibody (MCA 2260; Serotec, Cergy Pontoise, France) or recombinant human TNF-α (Tebu, Le Perray en Yvelines, France) at concentration of 1 μg/mL and 0.75 μg/mL, respectively. Mouse plasma, diluted 1/100 in PBS buffer, was added to the wells, and a goat antihuman IgG conjugated to horseradish peroxidase (A2290; Sigma-Aldrich, Lyon, France) was used for detection. The plates were developed using the substrate generator Sigmafast O-phenylenediamine dihydrochlmoride (P9187; Sigma-Aldrich), and absorbance was read using a spectrophotometer. Therapeutic antibodies concentrations were calculated using calibration curves of known concentrations of rituximab or infliximab. The lower limits of quantification of these assays were 0.2 μg/mL and 0.04 μg/mL rituximab and infliximab, respectively.
Rituximab pharmacokinetic-pharmacodynamic modeling
In untreated mice, the injection of EL4-huCD20-Luc cells was followed by an exponential increase in bioluminescence activity, which was described by:

where A is bioluminescence, A0 is baseline bioluminescence (measured on D13), kin is a zero-order tumor production constant (describing an exponential growth), and kout is a first-order constant describing spontaneous tumor lysis (decrease in bioluminescence).
Rituximab pharmacokinetics and concentration-effect relationship were modeled simultaneously. The elimination of infliximab was described by a conventional monoexponential decline:

where C is the plasma concentration of the therapeutic antibody and k10 is a first-order elimination constant. The plot of rituximab plasma concentrations over time in PR showed a deviation from this log-linear decrease, with an apparent acceleration in rituximab elimination with time. Because this could be explained by the binding of rituximab to an increasing tumor mass, the elimination rate of the mAb was described by the following equation:
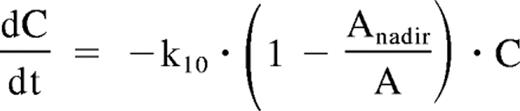
where C is the plasma concentration of the therapeutic antibody, k10 is a first-order rituximab elimination constant, and Anadir is the minimum observed value of A during rituximab treatment.
In CR and PR mice, the relationship between rituximab plasma concentration and bioluminescence was described by adding a sigmoid Emax model to equation 1 as follows:
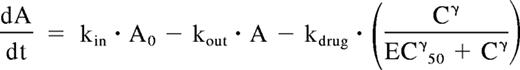
where kdrug is a zero-order constant corresponding to maximal rituximab-induced tumor lysis, EC50 is the concentration of rituximab leading to 50% of kdrug, and γ is the slope factor. Because rituximab effect displayed an “on/off” pattern, γ was fixed to 10. Therefore, EC50 was the threshold concentration for which rituximab-induced tumor lysis was present. Pharmacokinetic and concentration-effect modeling were performed using WinNonLin professional version 4.1 (Pharsight, Mountain View, CA).
Statistics
The results of each series of experiments are expressed as the mean values plus or minus SEM. Statistical tests were performed with Instat software (GraphPad Software, San Diego, CA) and included the paired Student t test, Tukey-Kramer multiple comparisons test, and Wilcoxon test when appropriate. All the animals were killed on day 60 after inoculation. Survivals were calculated using the Kaplan-Meier method from the day of lymphoma cell inoculation to the death of animals. Comparison of survivals was performed using the log-rank test. A P value less than .05 was considered significant.
Results
Therapeutic effect of rituximab
In all mice, an intravenous injection of 8 × 10³ EL4-huCD20-Luc cells led to the development of tumors involving lymph nodes, spleen, liver, and bone marrow, these organs being infiltrated by CD20+ large lymphoma cells (D.D., S.P., F. Dommange, M.O., S.L., J. Golay, A.L.P., G.P., P.B., H.W., and G.C., manuscript submitted, July 2008). BLI analysis showed an exponential increase in activity corresponding to the in vivo growth of lymphoma tumors (Figure 1A), with 73% and 100% of mice having a quantifiable lymphoma development on day 9 and day 13, respectively. Death was observed in all mice after a median time of 22 days (range, 15-27 days; Figure 1B). EL4-huCD20-Luc cells could be detected by PCR in lymph nodes 2 weeks (W2) after lymphoma cells inoculation and at W3 and W4 in bone marrow and liver, respectively (Figure 1C). In mice treated with 6 mg/kg of rituximab 1 day after inoculation of EL4-huCD20-Luc cells, rituximab prevented the development of lymphoma tumor (Figure 1A), leading to a significantly longer survival (Figure 1B) with 100% of mice in CR. Mice killed 60 days after lymphoma cell inoculation showed no lymphoma involvement in lymph nodes, thymus, spleen, or liver as assessed by macroscopic examination and cytometric analysis of huCD20+ cells (data not shown). EL4-huCD20-Luc cells were detected by PCR at W2 in lymph nodes and at W3 in bone marrow but were undetectable at W4 in all organs collected (Figure 1C).

Therapeutic effect of rituximab after EL4-huCD20-Luc lymphoma cell inoculation. Mice were inoculated with 8 × 10³ EL4-huCD20-Luc intravenously and then administered 6 mg/kg rituximab (■) or PBS (△) the day after (D1) or administered different doses (6, 12, 20, or 40 mg/kg) of rituximab on preestablished lymphoma tumor on day 13 (D13). Tumor growth and mice survival were evaluated by BLI on D9, D13, and then twice a week until the death of the mice. (A) Compared with control group, in vivo lymphoma growth was completely abrogated by administration of 6 mg/kg rituximab on D1 (significantly different P < .001). (B) Mice administered rituximab on D1 showed a significantly increased survival compared with the control group (P < .05). (C) PCR analysis on liver, lymph nodes, and bone marrow showed a disappearance of EL4-huCD20-Luc as early as 4 weeks after the infusion of rituximab on D1. (D) Mouse survival was significantly increased after infusion of 12, 20, or 40 mg/kg of rituximab on D13. *Significant difference, P < .05; 6 mg/kg rituximab did not modify mouse survival; P > .05.
Therapeutic effect of rituximab after EL4-huCD20-Luc lymphoma cell inoculation. Mice were inoculated with 8 × 10³ EL4-huCD20-Luc intravenously and then administered 6 mg/kg rituximab (■) or PBS (△) the day after (D1) or administered different doses (6, 12, 20, or 40 mg/kg) of rituximab on preestablished lymphoma tumor on day 13 (D13). Tumor growth and mice survival were evaluated by BLI on D9, D13, and then twice a week until the death of the mice. (A) Compared with control group, in vivo lymphoma growth was completely abrogated by administration of 6 mg/kg rituximab on D1 (significantly different P < .001). (B) Mice administered rituximab on D1 showed a significantly increased survival compared with the control group (P < .05). (C) PCR analysis on liver, lymph nodes, and bone marrow showed a disappearance of EL4-huCD20-Luc as early as 4 weeks after the infusion of rituximab on D1. (D) Mouse survival was significantly increased after infusion of 12, 20, or 40 mg/kg of rituximab on D13. *Significant difference, P < .05; 6 mg/kg rituximab did not modify mouse survival; P > .05.
Influence of tumor burden on rituximab response
To analyze the dose-response relationship of rituximab, we infused doses of 6, 12, 20, or 40 mg/kg of rituximab on D13, the time needed for the development of a disseminated disease quantifiable by BLI. We observed that 6 mg/kg of rituximab did not modify survival, median survival time being 22 days (range, 16-27 days; Figure 1D), whereas mice treated with 12, 20, or 40 mg/kg of rituximab had a significantly longer survival than those of the control group with median survivals of 28 days (range, 19-34 days), 32 days (range, 19-60 days), and 43 days (range, 37-60 days), respectively (Figure 1D). The 20-mg/kg dose of rituximab led to a variable response, with 23% of mice in CR, 59% in PR, and 18% in PD (Figure 2A). BLI analysis showed a slight reduction of lymphoma growth in PD mice compared with untreated mice, whereas lymphoma growth was completely abrogated, with undetectable disease, in mice with CR (Figure 2B). As defined in “Syngeneic lymphoma model and bimodal imaging analysis,” mice with PR had a partial and transient decrease of bioluminescence activity. Median survival of mice with PD was not different from that of the control group (22 days; range, 17-28 days), whereas survivals were significantly longer for mice with PR (median, 33 days; range, 27-42 days, P < .05) or with CR (100% of mice alive at 60 days, P < .05; Figure 2C).

Variability of response to rituximab on preestablished lymphoma tumors. (A) Bioluminescent imaging pictures: a group of 37 mice was administered 20 mg/kg rituximab on day 13 and 23% of CR, 59% of PR, and 18% of PD were observed. (B) In vivo tumor growth assessed by BLI in mice in PD (▼), PR (■), or CR (●) after infusion of 20 mg/kg rituximab (P < .001). (C) Survival was significantly increased in mice in CR (●) compared with those in PR (■), PD (▼), or control group receiving PBS (△) on D13. *P < .05.
Variability of response to rituximab on preestablished lymphoma tumors. (A) Bioluminescent imaging pictures: a group of 37 mice was administered 20 mg/kg rituximab on day 13 and 23% of CR, 59% of PR, and 18% of PD were observed. (B) In vivo tumor growth assessed by BLI in mice in PD (▼), PR (■), or CR (●) after infusion of 20 mg/kg rituximab (P < .001). (C) Survival was significantly increased in mice in CR (●) compared with those in PR (■), PD (▼), or control group receiving PBS (△) on D13. *P < .05.
Because our aim was to develop an animal model representative of the variability in response observed in treated patients, the 20-mg/kg dose of rituximab was selected to study the influence of tumor burden on rituximab plasma concentrations and efficacy. Tumor burden was measured before rituximab injection on day 13. This was done for each lymphoma tumor and measured in arbitrary units (AU) corresponding to the bioluminescent activity of the tumor site in number of gray level divided by the volume in pixel and corrected by the absorption of light by tissues according to tumor localization. For mice displaying several lymphoma tumors, tumor burden was assessed by the sum of specific bioluminescence activity of all tumor sites. Thus, the value of tumor burden reflects not only the size but also the bioluminescence activity of all lymphoma tumor sites (D.D., S.P., F. Dommange, M.O., S.L., J. Golay, A.L.P., G.P., P.B., H.W., and G.C., manuscript submitted, July 2008). After the inoculation of 8 × 10³ EL4-huCD20-Luc cells, median tumor burden on D13 was 1.52 × 10⁶ AU (range, 2.22 × 10⁴ to 5.09 × 10⁶ AU). There was significant differences in tumor burden on D13 between the 3 types of response to rituximab (Figure 3A, P < .05). We therefore defined 3 groups of animals, with low (< 0.15 × 10⁶ AU, n = 7, 18%), intermediate (0.15 × 10⁶ to 3 × 10⁶ AU, n = 24, 62%), or high (> 3 × 10⁶ AU, n = 8, 20%) tumor burden. Mice with a low tumor burden had a significantly higher CR rate (66%) and a significant longer survival (66% alive at 60 days) than mice with intermediate (CR rate, 0%; median survival, 30.5 days; range, 18-37 days) or high tumor burden (CR rate, 0%; median survival, 22.6 days; range, 17-33 days, Figure 3B; P < .05).

Tumor burden influence on response and survival. (A) Response to 20 mg/kg rituximab administered on day 13 was significantly different according to tumor burden (P < .05; n = 37). ○ represents individual values of tumor burden; and ● represents respective means ( ± SD). (B) Three groups of animals with low (< 0.15 × 10⁶ AU, n = 7) ( □ ), intermediate (0.15 × 10⁶ to 3 × 10⁶ AU, n = 24) (△), and high (> 3 × 10⁶ AU, n = 8) (●) tumor burden. Survival was significantly higher for mice with low tumor burden compared with mice with intermediate and high tumor burden; P < .05.
Tumor burden influence on response and survival. (A) Response to 20 mg/kg rituximab administered on day 13 was significantly different according to tumor burden (P < .05; n = 37). ○ represents individual values of tumor burden; and ● represents respective means ( ± SD). (B) Three groups of animals with low (< 0.15 × 10⁶ AU, n = 7) ( □ ), intermediate (0.15 × 10⁶ to 3 × 10⁶ AU, n = 24) (△), and high (> 3 × 10⁶ AU, n = 8) (●) tumor burden. Survival was significantly higher for mice with low tumor burden compared with mice with intermediate and high tumor burden; P < .05.
Pharmacokinetics and concentration-effect relationship of rituximab
In the group of mice treated with 20 mg/kg of rituximab, mAb plasma concentrations were measured twice a week from day 13 until mice death (n = 39). Some mice (n = 7) were also administered 6 mg/kg infliximab on D13, and the plasma concentrations of this mAb were measured at the same times as rituximab. The presence of tumor had an influence on rituximab pharmacokinetics because the control group without tumor had significantly higher rituximab concentrations than the group with a tumor involvement. In inoculated mice, rituximab concentrations were higher in the animals with lower tumor burden than in those with intermediate or high tumor burden (Figure 4A). An association between concentration and response was found because mice in CR had significantly higher rituximab concentrations than mice in PR or PD (Figure 4B). Rituximab concentration had also an influence on survival because it was significantly better in mice with rituximab concentrations higher than 1.5 μg/mL 14 days after mAb infusion than in those with a lower concentration.

Rituximab exposure is influenced by tumor burden and influences response to treatment and survival. (A) Mice without tumor had significantly higher rituximab concentrations than mice with tumor (▼). Mice with low tumor burden (< 0.15 × 10⁶ AU) ( □ ) had significantly higher rituximab concentrations than those with intermediate (from 0.15 × 10⁶ to 3 × 10⁶ AU) (△) or high (> 3 × 10⁶ AU) tumor burden (●) (*P < .05, **P < .01, ***P < .001). (B) Mice in CR (○) had significantly higher rituximab concentrations compared with mice in PR (■) or in PD (△). *P < .05, **P < .01, ***P < .001.
Rituximab exposure is influenced by tumor burden and influences response to treatment and survival. (A) Mice without tumor had significantly higher rituximab concentrations than mice with tumor (▼). Mice with low tumor burden (< 0.15 × 10⁶ AU) ( □ ) had significantly higher rituximab concentrations than those with intermediate (from 0.15 × 10⁶ to 3 × 10⁶ AU) (△) or high (> 3 × 10⁶ AU) tumor burden (●) (*P < .05, **P < .01, ***P < .001). (B) Mice in CR (○) had significantly higher rituximab concentrations compared with mice in PR (■) or in PD (△). *P < .05, **P < .01, ***P < .001.
We developed a mathematical model (Equation 1) describing tumor growth in untreated mice and integrating both an exponential growth rate and a spontaneous tumor lysis. A large interindividual variability was observed in the parameters (Figure 5A), with kout values = 0 (ie, no spontaneous tumor lysis) in some mice. Because infliximab does not bind to mouse TNF-α, the pharmacokinetics of this mAb should not be influenced by tumor mass. Mean (interindividual coefficient of variation CV) estimated infliximab parameters were: volume of distribution (Vd) = 2.0 mL (106%) and k10 = 8.2 × 10⁻³ h−1 (54%). In mice with CR, decrease in rituximab concentration was log-linear and the pharmacokinetics of this mAb could therefore be described by a conventional equation (equation 2). In these mice, mean (interindividual CV) rituximab pharmacokinetics parameters were: Vd = 4.8 mL (36%) and k10 = 6.6 × 10⁻³ h−1 (31%). In mice with PR, decrease in tumor mass stopped approximately 13 days after rituximab injection, at which time tumor mass reincreased. There was an acceleration in rituximab elimination concomitant with this tumor reincrease, and rituximab pharmacokinetics were satisfactorily described by a model integrating tumor mass (equation 3). Mean (interindividual CV) parameters were: Vd = 2.1 mL (82%) and k10 = 5.3 × 10⁻² h−1 (64%).

Pharmacokinetic-pharmacodynamic modeling of tumoral progression and rituximab plasma concentrations. (A) Pharmacodynamic parameters describing tumor mass in treated and untreated mice. Results are given as mean (interindividual CV). (B) Relationship between tumor burden and kdrug, a pharmacodynamic parameter that quantifies rituximab efficacy, observed values (●), and model-predicted values (continuous line; r2 = 0.89).
Pharmacokinetic-pharmacodynamic modeling of tumoral progression and rituximab plasma concentrations. (A) Pharmacodynamic parameters describing tumor mass in treated and untreated mice. Results are given as mean (interindividual CV). (B) Relationship between tumor burden and kdrug, a pharmacodynamic parameter that quantifies rituximab efficacy, observed values (●), and model-predicted values (continuous line; r2 = 0.89).
In PR and CR mice, the concentration-effect relationship of rituximab was satisfactorily described by a pharmacokinetic-pharmacodynamic model (equation 4 and Figure 5A). Because during rituximab treatment, bioluminescence decreased in a log-linear manner, that is, independently of rituximab concentrations, this model describes the effect of rituximab as an “on-off” phenomenon using a γ value of 10. Finally, we found a significant correlation (r2 = 0.89) between tumor burden measured on D13 and Kdrug, a constant quantifying rituximab efficacy (Figure 5B).
Anti-CD20 monoclonal antibody distribution
After infusion of a fixed dose of 130 μCi Tc99m-labeled ibritumomab-tiuxetan (muIgG1κ, muC2B8), we observed a significant (r2 = 0.97) correlation between tumor burden and the amount of labeled mu-C2B8 antibody located in the tumor and detected by immunoscintigraphy (Figure 6A). This radioactivity located in the tumor decreased with time in mice with high tumor burden, whereas it increased in mice with low tumor burden and slightly decreased in mice with intermediate tumor burden (Figure 6B). These data suggest that mice with high tumor burden “captured” more antibodies but these antibodies were more quickly released from tumor than in mice with low tumor burden. Intranodal distribution of Tc99m-labeled ibritumomab-tiuxetan was therefore evaluated 24 hours after infusion of 400 μCi radiolabeled antibody on cuts of involved lymph nodes with different sizes (determined and quantified by BLI analysis). Immunohistochemistry and hematein-eosin-safran staining controls showed a homogeneous tumoral cells infiltration and an absence of hypoxic or necrotic area in all lymph nodes (data not shown). We found that small lymph nodes had homogeneous distribution of labeled antibody within the tumor whereas antibody did not penetrate the middle of largest lymph nodes that was not vascularized (Figure 6C,D).

Distribution of mu-IgG1k anti-huCD20 (C2B8, ibritumomab-tiuxetan). (A) A group of 30 mice received 130 μCi radiolabeled ibritumomab and biodistribution was assessed by immunoscintigraphy. Amount of radioactivity was correlated with tumor burden (r2 = 0.97). (B) Radioactivity decreased with time for mice with high (> 3 × 10⁶ AU) (●) and intermediate (from 0.15 × 10⁶ to 3 × 10⁶ AU) (△) tumor burden, whereas it increased for mice with low (< 0.15 × 10⁶ AU) ( □ ) tumor burden. (C,D) To evaluate antibody tissue distribution, a group of mice (n = 20) received 400 μCi radiolabeled ibritumomab and were killed on day 1. Involved nodes identified and quantified by BLI were then collected, and radioactivity was evaluated on 3-μm cuts. The gray level code indicates range of radioactivity in lymph nodes from low (white) to high (black). The radioactive intensity was measured on a diameter and reported below. The smallest nodes showed a homogeneous antibody distribution, whereas no radioactivity was found in the middle of the biggest nodes. Blood vessels (*) and radioactivity were colocalized at the peripheral of the nodes. Results shown are representative of independent experiments.
Distribution of mu-IgG1k anti-huCD20 (C2B8, ibritumomab-tiuxetan). (A) A group of 30 mice received 130 μCi radiolabeled ibritumomab and biodistribution was assessed by immunoscintigraphy. Amount of radioactivity was correlated with tumor burden (r2 = 0.97). (B) Radioactivity decreased with time for mice with high (> 3 × 10⁶ AU) (●) and intermediate (from 0.15 × 10⁶ to 3 × 10⁶ AU) (△) tumor burden, whereas it increased for mice with low (< 0.15 × 10⁶ AU) ( □ ) tumor burden. (C,D) To evaluate antibody tissue distribution, a group of mice (n = 20) received 400 μCi radiolabeled ibritumomab and were killed on day 1. Involved nodes identified and quantified by BLI were then collected, and radioactivity was evaluated on 3-μm cuts. The gray level code indicates range of radioactivity in lymph nodes from low (white) to high (black). The radioactive intensity was measured on a diameter and reported below. The smallest nodes showed a homogeneous antibody distribution, whereas no radioactivity was found in the middle of the biggest nodes. Blood vessels (*) and radioactivity were colocalized at the peripheral of the nodes. Results shown are representative of independent experiments.
Discussion
Despite its efficacy, most of previously untreated patients with indolent NHL are in PR after rituximab monotherapy.5-7 There is therefore a need for a better understanding of factors influencing rituximab efficacy. It has been reported2,19 that tumor burden could be one of them and may influence both rituximab exposure (ie, dose-concentration relationship) and rituximab efficacy (ie, concentration-effect relationship).19-22 The aim of the present study was to characterize the role of tumor burden on the dose-concentration-effect relationship using a syngeneic murine model of lymphoma expressing human CD20. We developed pharmacokinetic and pharmacokinetic-pharmacodynamic models, which allowed us to demonstrate the influence of tumor mass on rituximab pharmacokinetics and the influence of tumor burden on the dose-effect relationship of rituximab.
Murine lymphoma models are usually subcutaneous23 and tumor growth estimated by the measure of 2 diameters.24 Our model shared characteristics usually observed in human with a disseminated disease involving mainly lymph nodes, spleen, or liver and leading to the death of mice in absence of rituximab treatment. Furthermore, we have developed a quantitative BLI method that allows the assessment of global tumor growth in all animals and takes into account the depth of each tumor. Given the fact that tumor cells expressed a constant level of human CD20 (mean ± SEM of 126 350 ± 1170 per cell; D.D., S.P., F. Dommange, M.O., S.L., J. Golay, A.L.P., G.P., P.B., H.W., and G.C., manuscript submitted, July 2008), it can be assumed that tumor burden as assessed by our quantitative method in different animals is proportional to the number of targets. We demonstrated that rituximab is able to cure animals with disseminated EL4-huCD20-Luc lymphoma with a clear dose-response relationship. Our murine model is the first model reproducing a disseminated lymphoma expressing human CD20 where tumor volume is the only variable parameter. It represents therefore a unique model to study the role of tumor burden on the dose-concentration-effect relationship of rituximab.
Tumor growth and rituximab pharmacokinetics were satisfactorily described by mathematical models. Because there was an interindividual variability in response with the 20-mg/kg dose, this dose was selected to study the sources of variability of clinical response reported in patients. For mice with CR, rituximab displayed a linear elimination; whereas for mice with PR, rituximab elimination accelerated dramatically with the resumption of tumor growth. The lack of effect of tumor growth on infliximab pharmacokinetics indicates that the nonlinear elimination of rituximab is not related to its Fc portion but more probably to a “consumption” of the mAb by its target tumor cells. The antibody distribution analysis demonstrated that it penetrated into the middle of small lymph nodes but not in that of large lymph nodes. We have verified that there was no necrotic area in the middle of large nodes, and these results suggest that, in the case of large tumors, the anti-CD20 binds to the tumor cells at the periphery of the nodes but may not penetrate into the middle of the nodes. It is also plausible that large tumors had lower central distribution because of a lack of antibody excess in circulation, ie, all mAbs were adsorbed before all available CD20 were bound.
In this model, we clearly demonstrated a dose-response relationship of rituximab. In the group of mice treated with 40 mg/kg (n = 6), all mice experienced a response with 3 PR and 3 CR. These mice had an intermediate (n = 3) or high (n = 3) tumor burden (data not shown) at the time of rituximab infusion, suggesting that an increase in dose could compensate for larger tumors.
Our study was designed to analyze the role of tumor burden on the dose-concentration-effect relationship of rituximab. Mathematical models were used to confirm our analyses and to quantify the relationships. As observed in clinical studies,2 high rituximab plasma concentrations were associated with a better tumor response (Equation 4 and Figure 4B) and a longer mouse survival. A high tumor burden on day 13 was associated with low rituximab concentrations (Figure 4A), an impairment of rituximab concentration-effect relationship with low value of kdrug, a parameter corresponding to rituximab efficacy (Figure 5B), and both lower tumor response (Figure 3A) and shorter mouse survival (Figure 3B). The effect of tumor burden was not limited to its magnitude on day 13 because, in mice with partial or complete response, tumor mass was shown to accelerate rituximab elimination (equation 3). Our pharmacokinetic-pharmacodynamic model was not appropriate to describe mice with PD (where, by definition, Kdrug = 0) and, therefore, does not suggest a mechanism of tumor resistance to treatment. However, a slight reduction in tumor growth was observed in these mice, which had significantly higher tumor burden compared with mice with CR and PR. This suggests that the amount of available antibodies was dramatically low compared with the number of tumor cells, even if others mechanisms such as loss or mutation of CD20 may be also possible.
In human, rituximab is currently used at the same dose and schedules of infusion (ie, interval and number of infusion) have been empirically defined. In the present study, we clearly demonstrated that tumor (CD20) burden influences both rituximab exposure and efficacy. Taken together, our results offer stronger evidence for the concept of the individual adjustment of rituximab dose to tumor burden. These results should be taken into account in the development of new schedules of antibodies administration in anticancer therapy.
The publication costs of this article were defrayed in part by page charge payment. Therefore, and solely to indicate this fact, this article is hereby marked “advertisement” in accordance with 18 USC section 1734.
Acknowledgments
The authors thank Danielle Degenne (Laboratoire d'Immunologie, Centre Hospitalier Regional Universitaire de Tours, France), Anne Claire Duveau (Université François Rabelais Tours, Faculté de Médecine, Tours, France), Maryline Lemée, Stéphanie Rétif (Centre National de la Recherche Scientifique UPS44, Orléans, France), and Aurélie Sergent (IFIPS Optronique, Paris, France) for their helpful assistance.
This work was supported by Association pour la Recherche contre le Cancer (grant 3229), the Institut National du Cancer and Cancéropôle Grand Ouest (MAb IMPACT, IMProving ACTivation of FcγRIIIa-expressing effector cells, pharmacogenetic-based optimisation of monoclonal antibody therapy for cancer, federative project), and Roche France. D.D. was supported by grant from Région Center and fellowship from the Société Française d'Hématologie.
Authorship
Contribution: D.D. designed and performed research, collected, analyzed, and interpreted data, and wrote the manuscript; G.C. and G.P. designed research, analyzed data, performed the coordination and funding of the study, interpreted data, and wrote the manuscript; D.T., M.O., S.L., S.P., and A.L.P. performed experiments, analyzed data, and participated in the writing of the manuscript; and H.W. and P.B. participated in the writing of the manuscript.
Conflict-of-interest disclosure: The authors declare no competing financial interests.
Correspondence: Guillaume Cartron, Service d'Hématologie et Biothérapies, Inserm U847, CHU Lapeyronie, CHU Montpellier, 191 avenue du doyen Gaston Giraud, 34295 Montpellier, France; e-mail: guillaume.cartron@med.univ-tours.fr.

