Abstract
Recently, the cancer stem cell hypothesis has gained significant recognition as the descriptor of tumorigenesis. Although previous studies relied on transplanting human or rat tumor cells into immunecompromised mice, our study used the Hoechst 33342 dye–based side population (SP) technique to isolate and transplant stem cell–like cancer cells (SCLCCs) from the 4T1 and NXS2 murine carcinoma cell lines into the immune-competent microenvironment of syngeneic mice. 4T1 cells displayed an SP of 2% with a Sca-1highc-Kit–CD45– phenotype, whereas NXS2 cells contained an SP of 0.2% with a Sca-1highCD24highc-Kit–CD45–GD high2 phenotype. Reverse transcription–polymerase chain reaction (RT-PCR) further revealed up-regulation in SP cells of ABCG2, Sca-1, Wnt-1, and TGF-β2. Additionally, 4T1 and NXS2 SP cells exhibited increased resistance to chemotherapy, and 4T1 SP cells also showed an increased ability to efflux doxorubicin, which correlated with a selective increase in the percentage of SP cells found in the tumors of doxorubicin-treated mice. Most importantly, SP cells showed a markedly higher repopulation and tumorigenic potential in vivo, which correlated with an increased number of cells in the SP compartment of SP-derived tumors. Taken together, these results show that we successfully characterized SCLCCs from 2 murine carcinoma cell lines in the immune-competent microenvironment of syngeneic mice.
Introduction
According to the cancer stem cell hypothesis, tumor initiation and tumor growth are driven by a small population of stem cell–like cancer cells (SCLCCs), which have an indefinite proliferative and differentiation potential.1,2 The limited number of SCLCCs in the tumor and their specific phenotypes have been made responsible for their escape from conventional therapies resulting in disease relapse.1,3,4 These SCLCCs have been identified in hematologic tumors, such as leukemia,5,6 as well as in various solid malignancies such as brain, breast, prostate, and lung cancers.7-11 SCLCCs have been identified in such tumors, as well as tumor cell lines, based on the expression, or lack thereof, of surface markers such as CD44, CD24, CD29, Lin, CD133, and Sca-1 or by their ability to form spheres in cell culture.7,8,11-13
Another useful approach for identification and purification of SCLCCs, specifically in the absence of surface marker expression, has been to use the phenomenon that stem cells in general have the ability to efflux lipophilic, fluorescent dyes such as Hoechst 33342. The efflux of the Hoechst 33342 dye has been correlated with ABC transporters, in particular ABCG2,14 and can be inhibited with Ca++-channel blockers. This Hoechstlow population has been designated the side population (SP), and it was first shown in the hematopoietic system that SP cells within the bone marrow are greatly enriched for stem cells.15,16 In addition to the identification of hematopoietic stem cells (HSCs) in the bone marrow, this method has also been used to identify SP cells with stem cell properties in various tissues such as mammary gland, skin, brain, and liver.17-21 Most recently, this approach was also applied to identify an SCLCC-enriched SP compartment in various human and rat carcinomas.22-25
To date, the majority of studies examining SCLCCs isolated these cells from human or rat tumors or tumor cell lines and tested their tumorigenic potential by transplanting them into immune-compromised severe combined immunodeficient (SCID), SCID/NOD (nonobese diabetic), or nude mice.7,9,23,24,26 As of late, the clinical relevance of such models has come into question. For example, it has been suggested that xenografts in immune-compromised mice may not recapitulate the full extent of tumor development seen in human cancers.27 Importantly, the host immune status and the microenvironment both play a crucial role during tumor initiation and development because they can alter expression levels of a wide range of genes in tumor cells. Therefore, xenografts in immune-compromised mice lack a crucial syngeneic interface between tumor and microenvironment, which may reflect on tumor growth and dissemination dynamics.28-31
Here, we demonstrate for the first time that the SCLCC concept can also be applied to syngeneic mouse tumor models. To this end, we identified a low Hoechst 33342 dye–retaining SP in murine 4T1 breast carcinoma and NXS2 neuroblastoma cell lines, which display stem cell characteristics in vitro, and, most importantly, are considerably more tumorigenic in immune-competent syngeneic mice. Therefore, these murine models may provide novel approaches for the in-depth characterization of SCLCCs in an immune-competent syngeneic tumor microenvironment.
Materials and methods
Animals and cell lines
Female BALB/c, C57Bl/6, and A/J mice, 6- to 8-weeks of age, were purchased from the Scripps Research Institute Rodent Breeding Facility (La Jolla, CA). All animal experiments were performed according to National Institutes of Health guidelines. The 4T1 mammary carcinoma cell line was generously provided by Dr Suzanne Ostrand-Rosenberg (University of Maryland, Baltimore). 4T1 cells were maintained in RPMI-1640 Medium (American Type Culture Collection [ATCC], Manassas, VA), 10% FBS, 1% Glutamax-1, and 1% sodium bicarbonate, whereas NXS2 cells were maintained in RPMI-1640 Medium (Gibco BRL, Gaithersburg, MD), 10% FBS, and 1% Glutamax-1. Both cells lines were grown in 37°C, 5% CO2 incubators. Our animal protocol was approved by The Scripps Research Institute Institutional Animal Care and Use Committee.
Flow cytometry analysis and cell sorting
We stained 1 × 10⁶ tumor cells/mL with 5 μg/mL Hoechst 33342 dye (Sigma, St Louis, MO) or Hoechst dye plus 100 mM (+/–) verapamil hydrochloride (Sigma) and incubated cells at 37°C for 1 hour as described previously.22,32 Cells were further stained with antibodies against Sca-1, c-Kit, CD45, CD44, CD24 (BD Pharmingen, San Diego, CA), GD2, and the appropriate isotype controls (BD Pharmingen). For apoptosis studies, we used the CaspaTag Pan-Caspase In Situ Assay kit (Chemicon, Temecula, CA) according to the manufacturer's protocol. Hoechst 33342 was added during incubation with the FLICA reagent, and fluorescence-activated cell sorting (FACS) data were analyzed using FlowJo software (Tree Star, Ashland, OR).
Reverse transcription–PCR analysis
Total RNA from 3 independently sorted 4T1 and 2 independently sorted NXS2 SP and non-SP cell samples were isolated using RNAeasy (Qiagen, Valencia, CA), and 4T1 RNA was amplified with the Ambion MessageAmp II-Biotin Enhanced Single Round aRNA Amplification Kit (Ambion, Austin, TX) according to the manufacturer's recommendations. NXS2 RNA was transcribed in cDNA using SuperScript First-Strand Synthesis System (Invitrogen, Carlsbad, CA). Reverse transcription–polymerase chain reaction (RT-PCR) was performed using SuperScript One-Step (Invitrogen). The primers used are as follows: ABCG2 (sense, 5′-AGCAGCAAGGAAAGATCCAA-3′; antisense, 5′-GGAATACCGAG GCTGATGAA-3′), Sca1 (sense, 5′-TGGACACTTCTCACACTA CAAAGTC-3′; antisense, 5′-CAGAGCAAGGTCTGCAGGAG-3′, Wnt-1 (sense, 5′-ACCTGTTGACGGATTCCAAG-3′; antisense, 5′-GCCTCGTT GTTGTGAAGGTT-3′), Tgfb2 (sense, 5′-GCAGGAGTACTACGC CAAGG-3′; antisense, 5′-CCTCGAGCTCTTCGCTTTTA-3′), GAPDH (sense, 5′-CATTGACCTCAACTACATGG-3′; antisense, 5′-CACACCCAT CACAAACATGG-3′). Ten nanograms RNA/sample was amplified using 35 cycles (ABCG2, Wnt-1) and 40 cycles (Sca-1, TGF-β2) in a Mastercycler Gradient (Eppendorf, Westbury, NY).
In vitro and in vivo repopulation
For the in vitro repopulation study, Hoechst 33342/PI–stained cells were sorted into PI–/live, SP, and non-SP groups (3 × 10⁵ cells/group), and 1 × 10⁵ cells were cultured in triplicate. Seven days later, adherent cells were harvested with trypsin (Gibco BRL), restained with Hoechst 33342 dye, and analyzed by FACS as described under “Flow cytometry analysis and cell sorting.” For the in vivo repopulation study, 29-day-old primary tumors were excised, minced with scissors, and digested with 125 U/mL collagenase I (Gibco BRL) for 45 minutes at 37°C. The cell suspension was passed through a cell strainer, washed, stained with Hoechst 33342 dye, and analyzed by FACS as above under “Flow cytometry analysis and cell sorting.” The percentage of repopulation was defined as [(the percentage of cells within a given compartment/percentage of cells within the same compartment in the culture or tumor derived from the PI–/live cells) × 100]. For in vivo selections, BALB/c mice (n = 2) were challenged orthotopically with 4T1 tumor cells, and doxorubicin (10 mg/kg)/mock was administered intravenously on days 7, 14, and 21. Single-cell suspensions of tumor harvested on day 24 were prepared as described under “Flow cytometry analysis and cell sorting,” and cells were stained with Hoechst 33342 with or without verapamil hydrochloride.
MTT assay
Cells stained with Hoechst 33342 dye were sorted into SP and non-SP groups and plated in 96-well plates at a concentration of 4000 cells/well in the presence of DMSO, doxorubicin (1.5 μg/mL), or cisplatin (4 μg/mL). The MTT assay was performed 48 hours later according to the manufacturer's protocol (Molecular Probes, Eugene, OR). The percentage of live cells was defined as [(the number of cells within doxorubicin- or cisplatin-treated wells/the number of cells within DMSO-treated wells) × 100].
Tumor induction
Hoechst 33342/PI–stained cells were sorted into PI–/live, SP, and non-SP groups, and 8 × 10³ 4T1 cells were injected orthotopically into the mammary fat pad of female BALB/c mice. Sorted PI–/live NXS2 SP and non-SP cells were injected intravenously into the tail vein of A/J mice.
Statistical analysis
The statistical significance of different findings between experimental groups was determined by the Student t test. Results were considered significant if 2 tailed P values were less than .05.
Results
4T1 and NXS2 tumor cell lines contain SPs specified by Hoechst 33342 dye exclusion
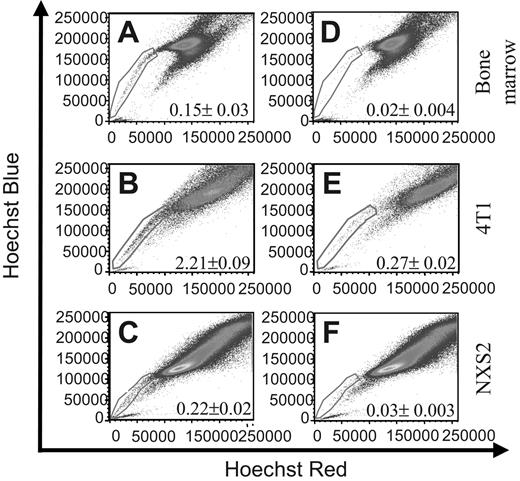
To identify murine tumor cell lines that contain SCLCCs, we used the Hoechst 33342 dye exclusion technique, which has been used by other investigators to identify such populations in different cell types.22,23 To this end, we used the Hoechst 33342 dye to stain murine 4T1 breast carcinoma and NXS2 neuroblastoma cells as well as bone marrow as a positive control. FACS analysis of the samples clearly defined an SP that constituted 0.15% ± 0.03% within the bone marrow sample (Figure 1A), 2.21% ± 0.09% within the 4T1 cell line (Figure 1B) and 0.22% ± 0.2% within the NXS2 cell line (Figure 1C). To verify the SP phenomenon, cells were coincubated with the Ca++-channel blocker verapamil hydrochloride and analyzed by FACS. Incubation with verapamil significantly reduced the number of cells found within the SP to 0.02% ± 0.004% in the bone marrow sample (Figure 1D), to 0.27% ± 0.02% in the 4T1 sample (Figure 1E), and to 0.03% ± 0.003% in the NXS2 sample (Figure 1F). These results suggest that both the 4T1 and NXS2 cell lines contain an SP of cells similar to that found within bone marrow.
Bone marrow, 4T1 breast carcinoma, and NXS2 neuroblastoma cells contain a side population (SP). (A-C) The cell types indicated were stained with Hoechst 33342 dye to determine the presence of a Hoechst effluxing SP. (D-F) Cells were stained with Hoechst dye in the presence of the Ca++-channel blocker verapamil hydrochloride to verify the specificity of the SP population. Each figure represents 1 of 2 experiments.
Bone marrow, 4T1 breast carcinoma, and NXS2 neuroblastoma cells contain a side population (SP). (A-C) The cell types indicated were stained with Hoechst 33342 dye to determine the presence of a Hoechst effluxing SP. (D-F) Cells were stained with Hoechst dye in the presence of the Ca++-channel blocker verapamil hydrochloride to verify the specificity of the SP population. Each figure represents 1 of 2 experiments.
4T1 and NXS2 cells express markers associated with HSCs, progenitor cells, and SCLCCs
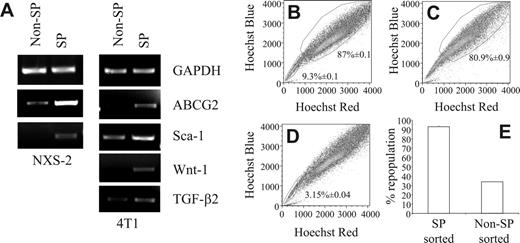
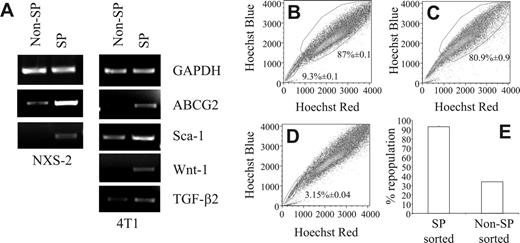
To further characterize the SP cells in these 2 murine tumor cell lines, we examined them for the expression of markers that have been associated with stem cells or progenitor cells or SCLCCs. In this regard, it has been shown that HSCs express Sca-1 and c-Kit.33 Recently, a small population of tumorigenic human breast cancer cells was identified which exhibited a CD44+CD24low/–Lin– expression pattern.7 Furthermore, progenitor cells of the nervous system, as well as neuroblastoma cells, were reported to express the disialoganglioside GD2.22 Consequently, we examined the surface marker profiles of 4T1 and NXS2 SP cells by staining Hoechst 33342-labeled cells with antibodies against the surface markers indicated as well as their corresponding isotype controls. FACS analysis of 4T1 cells revealed that compared with non-SP cells, the 4T1 SP profile was Sca-1highc-Kitlow/–CD45low/–. In addition, 4T1 SP and non-SP cells also expressed similar levels of CD44 and CD24 (Table 1). Similar to the 4T1 SP phenotype, the expression pattern of the NXS2 SP cells was also Sca-1highc-Kitlow/– compared to NXS2 non-SP cells. However, these SP cells also expressed higher levels of CD45, CD44, CD24, and disialoganglioside GD2 compared with non-SP cells (Table 1). Furthermore, CD133 was not detected on either of the NXS2 subpopulations (data not shown). To further examine the expression of markers associated with stem cells and SCLCCs, total RNA isolated from sorted SP and non-SP 4T1 and NXS2 cells was subjected to RT-PCR, which showed an up-regulation of ABCG2, Sca-1, Wnt-1, and TGF-β2 (Figure 2A).
4T1 SP cells repopulate an entire cell population in vitro
Another key stem cell characteristic is their ability to repopulate an entire cell compartment. To determine whether the SP has the ability to repopulate an entire tumor cell population in vitro, we stained 4T1 cells with the Hoechst 33342 dye; performed FACS to sort these cells into PI–/live, SP, and non-SP population; and cultured each cell sample for 7 days. Following the restaining of each sample with the Hoechst 33342 dye, FACS analysis revealed that the cultures derived from the PI–/live-sorted samples contained an SP compartment that encompassed 9.32% ± 0.1% of the sample, whereas the non-SP compartment comprised 87% ± 0.1% of the sample (Figure 2B). Similarly, in the cultures derived from SP-sorted cells, the non-SP compartment comprised 80.93% ± 0.93% of the entire population (Figure 2C). In contrast, in cultures derived from non-SP–sorted cells, the SP compartment encompassed only 3.15% ± 0.04% of the entire cell population (Figure 2D). These figures translated into a 92.91% ± 1.07% repopulation of the non-SP compartment in SP-derived cultures, and a 33.76% ± 0.44% repopulation of the SP compartment in non-SP derived cultures (Figure 2E). These results could not be attributed to differences in proliferative capacity because CFSE staining of sorted SP and non-SP cells showed similar staining patterns (data not shown).
RT-PCR shows up-regulation of stem cell markers and only the SP fully repopulates the tumor cell population in vitro. (A) RNA from SP- and non-SP–sorted NXS2 or 4T1 cells were amplified with primers targeting the indicated genes. (B-E) Hoechst 33342 dye–stained 4T1 cells were sorted into 3 separate groups; (B) PI–/live, (C) SP, and (D) non-SP cells. Following sorting, each group of cells was cultured for 7 days, restained with the Hoechst 33342 dye, and analyzed by FACS to determine the percentage of cells found within each compartment. Each figure represents 1 of 3 experiments. (E) The percentage of repopulation of the non-SP compartment in SP-derived cultures and the percentage of repopulation of the SP compartment in non-SP–derived cultures. Data represent the mean and SEM of the percentage of repopulation.
RT-PCR shows up-regulation of stem cell markers and only the SP fully repopulates the tumor cell population in vitro. (A) RNA from SP- and non-SP–sorted NXS2 or 4T1 cells were amplified with primers targeting the indicated genes. (B-E) Hoechst 33342 dye–stained 4T1 cells were sorted into 3 separate groups; (B) PI–/live, (C) SP, and (D) non-SP cells. Following sorting, each group of cells was cultured for 7 days, restained with the Hoechst 33342 dye, and analyzed by FACS to determine the percentage of cells found within each compartment. Each figure represents 1 of 3 experiments. (E) The percentage of repopulation of the non-SP compartment in SP-derived cultures and the percentage of repopulation of the SP compartment in non-SP–derived cultures. Data represent the mean and SEM of the percentage of repopulation.
4T1 and NXS2 SP cells are more resistant to chemotherapy
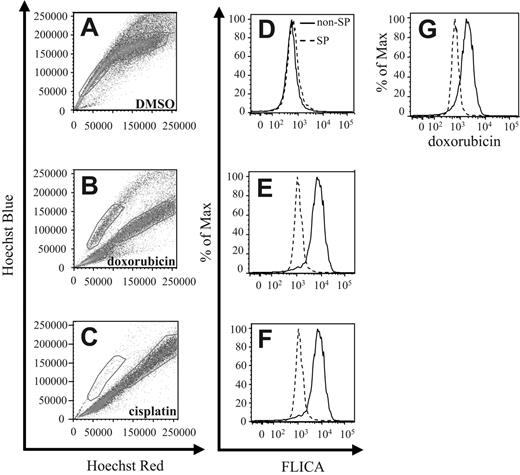
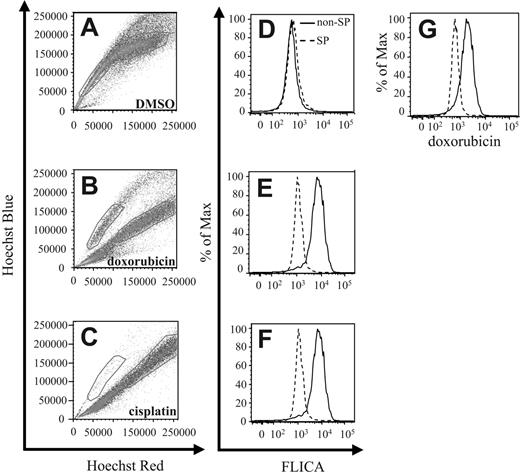
Stem cells have been found to be more resistant toward radiotherapy and chemotherapy. Therefore, to test the relative resistance of 4T1 SP cells to chemotherapy, we cultured such cells either in the presence of DMSO (Figure 3A,D), doxorubicin (Dox) (Figure 3B,E,G), or cisplatin (CDDP) (Figure 3C,F). Following staining of the cells with the Hoechst 33342 dye 24 hours later, FACS analysis revealed a significant red shift in the Hoechst 33342 staining profile in the non-SP population cultured with Dox compared with DMSO control cultures (Figure 3A-B). This shift has been previously associated with apoptotic cells in Hoechst 33342–stained samples.34 In contrast to treatment with Dox, the majority of cells within both the SP and non-SP compartments revealed a red shift with CDDP-compared with DMSO-treated samples, with only a small percentage remaining in the SP compartment (Figure 3A,C).
4T1 SP cells are more chemoresistant than non-SP cells. (A-C) 4T1 cells were cultured in the presence of DMSO, Dox, or CDDP for 24 hours, followed by staining with Hoechst 33342 dye, and analyzed by FACS. Gates represent the SP and non-SP in each figure. (D-F) In addition to Hoechst 33342 dye, cells were also stained with the CaspaTag pan-caspase inhibitor FLICA to determine the extent of apoptosis occurring in each compartment by FACS. (G) Doxorubicin-treated cells were analyzed by FACS to quantitate the level of intracellular doxorubicin within each compartment. Each figure represents 1 of 3 experiments.
4T1 SP cells are more chemoresistant than non-SP cells. (A-C) 4T1 cells were cultured in the presence of DMSO, Dox, or CDDP for 24 hours, followed by staining with Hoechst 33342 dye, and analyzed by FACS. Gates represent the SP and non-SP in each figure. (D-F) In addition to Hoechst 33342 dye, cells were also stained with the CaspaTag pan-caspase inhibitor FLICA to determine the extent of apoptosis occurring in each compartment by FACS. (G) Doxorubicin-treated cells were analyzed by FACS to quantitate the level of intracellular doxorubicin within each compartment. Each figure represents 1 of 3 experiments.
To verify that cells within the SP compartment were undergoing less apoptosis than cells found within the shifted population, we costained the Hoechst 33342–labeled cells with FLICA, a fluorescence-labeled pan-caspase inhibitor that binds activated caspases. Following FLICA costaining, FACS analysis revealed that cells within the shifted compartment displayed increased FLICA staining compared with cells found within the SP compartments (Figure 3D-F).
To investigate possible reasons for the increased resistance to chemotherapy-induced apoptosis, we used FACS analysis to quantify intracellular Dox levels by measuring Dox fluorescence within each cell compartment. In correlation with the Hoechst 33342 dye shift and the FLICA-staining profile, cells within the shifted compartment also expressed greater levels of intracellular Dox than cells within the SP compartment (Figure 3G).
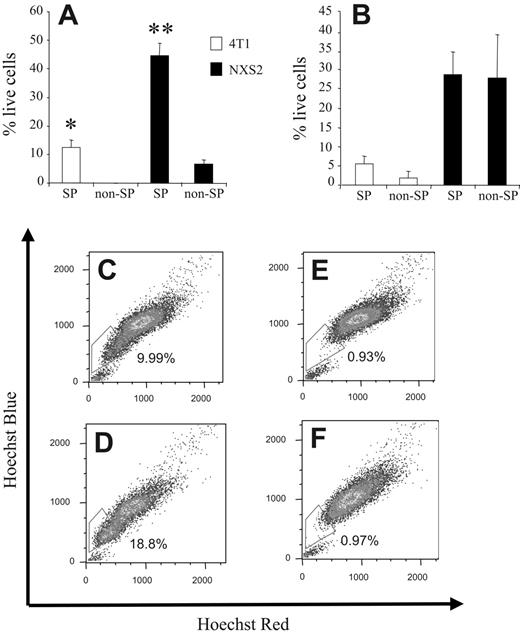
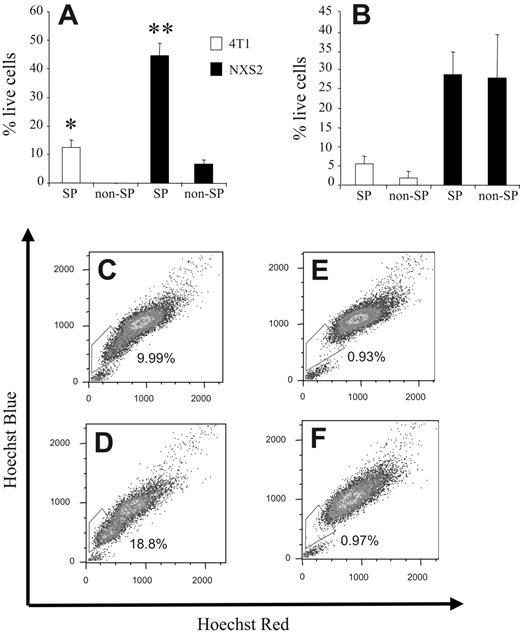
To further substantiate these apoptosis results we stained 4T1 and NXS2 cells with the Hoechst 33342 dye; sorted the cells into SP and non-SP samples; and treated them either with DMSO, Dox, or CDDP. After 24 hours, the number of live cells was determined by the MTT assay. 4T1 and NXS2 SP cells treated with Dox showed a significantly greater survival, 12.27% ± 1.16% and 44.69% ± 2.96%, respectively, than non-SP cells (ie, 0% and 6.54% ± 1.27%, respectively; Figure 4A). Furthermore, after CDDP treatment, 4T1 SP cells showed a trend toward greater survival compared with non-SP cells, 5.35% ± 1.2% versus 2.75% ± 0.75%, respectively. However, NXS2 SP cells showed no increase in survival compared with non-SP cells when treated with CDDP (ie, 28.77% ± 4.18% and 27.85% ± 7.94%, respectively; Figure 4B).
Doxorubicin selects for SP cells in vivo
To investigate whether the increased chemoresistance and increased efflux of Dox in 4T1 SP cells correlates with an actual increase in 4T1 SP cells within a tumor in vivo, BALB/c mice were injected orthotopically with 7 × 10³ 4T1 cells. Seven, 14, and 21 days after tumor cell challenge, half of the group of mice was also administered Dox intravenously. Twenty-three days after tumor cell challenge, single-cell suspensions derived from the primary tumors of each mouse were stained with the Hoechst 33342 dye. FACS analysis of each tumor sample revealed that the number of cells within the SP compartment was significantly enhanced in tumors isolated from Dox-treated mice compared with animals that did not receive this drug (ie, 18.8% and 9.99%, respectively; Figure 4D and C). Costaining of each tumor sample with verapamil confirmed the specificity of the SP compartment because addition of this Ca++-channel blocker significantly reduced the number of cells within the SP compartment to 0.93% and 0.97%, respectively (Figure 4E-F).
4T1 SP cells are more tumorigenic and repopulate an entire tumor in vivo
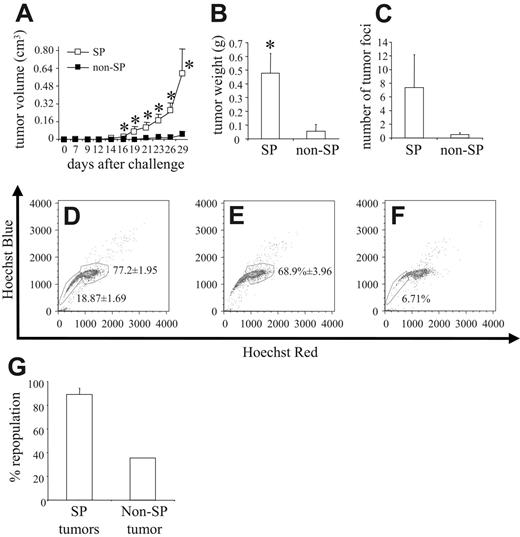
The most significant characteristic of a stem cell is its ability to repopulate an entire cell population in vivo. To this end, we stained 4T1 cells with the Hoechst 33342 dye; sorted them into PI–/live, SP, and non-SP cells; and then injected 8 × 10³ cells from each group orthotopically into the mammary fat pad of syngeneic BALB/c mice. Compared with non-SP cells, SP cells were significantly more potent in inducing tumor formation in vivo. Even as late as 29 days after tumor cell challenge, only 2 of 8 mice injected with non-SP cells had developed tumors, with 1 of the 2 tumors being barely palpable, and reaching mean tumor volumes of only 0.037 ± 0.036 cm3. In contrast, 7 of 8 mice injected with SP cells developed tumors that reached a mean tumor volume of 0.591 ± 0.225 cm3 (Figure 5A). In correlation with this increased tumor volume, the weight of primary tumors of mice challenged with SP cells was significantly greater than that of mice challenged with non-SP cells (ie, 0.476 ± 0.145 g and 0.054 ± 0.051 g, respectively; Figure 5B). The extent of spontaneous pulmonary metastasis also differed because SP-derived tumors metastasized to a greater extent than did non-SP–derived tumors, exhibiting 7.37 ± 4.79 tumor foci versus only 0.5 ± 0.27 tumor foci, respectively (Figure 5C). NXS2 cells were also sorted for PI–/SP and PI–/non-SP cells, and 5 × 10⁴ of such cells were injected intravenously into A/J mice (n = 4). Thirty-eight days after tumor cell challenge, mice were killed and evaluated for lung and liver metastasis. Whereas no animal in the non-SP group showed any metastases, 50% of animals injected with SP cells displayed either lung or liver metastases (data not shown).
SP cells are more chemoresistant in vitro and Dox treatment selects for cells from the SP compartment in vivo. (A) Hoechst 33342 dye–stained 4T1 and NXS2 cells were sorted into 4 separate groups, SP (4T1 and NXS2) and non-SP (4T1 and NXS2), and each was cultured in the presence of DMSO or Dox for 24 hours. The number of live cells remaining in each culture was then determined by MTT assay using the DMSO-treated cells as a baseline value. (B) The same procedure was used as in panel A except that cells were cultured in the presence of CDDP instead of Dox. Data represent the mean and SEM of the percentage of live cells remaining in each culture following chemotherapy. (C-F) BALB/c mice (n = 2) were challenged orthotopically with 8 × 10³ 4T1 tumor cells and (D,F) Dox (10 mg/kg) or (C,E) mock was administered intravenously on days 7, 14, and 21. Single-cell suspensions of tumors were harvested on day 23 and stained with the Hoechst 33342 dye. Cells in panels E-F were coincubated with verapamil. Data are presented as mean and SEM of the percentage of live cells. Each figure represents 1 of 2 experiments. *P < .05. **P < .01.
SP cells are more chemoresistant in vitro and Dox treatment selects for cells from the SP compartment in vivo. (A) Hoechst 33342 dye–stained 4T1 and NXS2 cells were sorted into 4 separate groups, SP (4T1 and NXS2) and non-SP (4T1 and NXS2), and each was cultured in the presence of DMSO or Dox for 24 hours. The number of live cells remaining in each culture was then determined by MTT assay using the DMSO-treated cells as a baseline value. (B) The same procedure was used as in panel A except that cells were cultured in the presence of CDDP instead of Dox. Data represent the mean and SEM of the percentage of live cells remaining in each culture following chemotherapy. (C-F) BALB/c mice (n = 2) were challenged orthotopically with 8 × 10³ 4T1 tumor cells and (D,F) Dox (10 mg/kg) or (C,E) mock was administered intravenously on days 7, 14, and 21. Single-cell suspensions of tumors were harvested on day 23 and stained with the Hoechst 33342 dye. Cells in panels E-F were coincubated with verapamil. Data are presented as mean and SEM of the percentage of live cells. Each figure represents 1 of 2 experiments. *P < .05. **P < .01.
4T1 SP cells are more tumorigenic than 4T1 non-SP cells. 4T1 cells stained with Hoechst 33342 dye were sorted into PI–/live, SP, and non-SP groups, and 8 × 10³ cells from each group were injected orthotopically into the mammary fat pad of syngeneic BALB/c mice (n = 8). (A) Tumor volume was measured after tumor cell challenge, and (B) primary tumors were harvested and weighed 29 days after tumor cell challenge. (C) The lungs of each mouse were also harvested, and the number of tumor foci was quantified. The data represent the mean and SEM of tumor volume, tumor weight, and number of tumor foci, respectively. Data represent 1 of 2 experiments. Single-cell suspensions were created from (D) 3 PI–/live-derived tumors, (E) 3 SP-derived tumors, and (F) 1 non-SP–derived tumor, stained with Hoechst 33342 dye and analyzed by FACS to determine the repopulation potential of each group in vivo. (G) Percentage of repopulation of the non-SP compartment in SP-derived tumors and the percentage of repopulation of the SP compartment in non-SP–derived tumors. Data represent the mean and SEM of the percentage of repopulation. *P < .05.
4T1 SP cells are more tumorigenic than 4T1 non-SP cells. 4T1 cells stained with Hoechst 33342 dye were sorted into PI–/live, SP, and non-SP groups, and 8 × 10³ cells from each group were injected orthotopically into the mammary fat pad of syngeneic BALB/c mice (n = 8). (A) Tumor volume was measured after tumor cell challenge, and (B) primary tumors were harvested and weighed 29 days after tumor cell challenge. (C) The lungs of each mouse were also harvested, and the number of tumor foci was quantified. The data represent the mean and SEM of tumor volume, tumor weight, and number of tumor foci, respectively. Data represent 1 of 2 experiments. Single-cell suspensions were created from (D) 3 PI–/live-derived tumors, (E) 3 SP-derived tumors, and (F) 1 non-SP–derived tumor, stained with Hoechst 33342 dye and analyzed by FACS to determine the repopulation potential of each group in vivo. (G) Percentage of repopulation of the non-SP compartment in SP-derived tumors and the percentage of repopulation of the SP compartment in non-SP–derived tumors. Data represent the mean and SEM of the percentage of repopulation. *P < .05.
Figure 2 shows that the SP was the only cell compartment capable of repopulating the entire tumor cell population in vitro. To show the repopulation potential of SP cells in vivo, we harvested primary tumors from 3 PI–/live-challenged mice (ie, from 3 SP-challenged mice and from the 1 non-SP mouse that grew a tumor of any significant size). FACS analysis of single-tumor cell suspensions, which were prepared from the primary tumors stained with the Hoechst 33342 dye, revealed that the tumors derived from the PI–/live-sorted samples contained an SP compartment encompassing 18.87% ± 1.69% of the tumor, whereas the non-SP compartment comprised 77.2% ± 1.95% (Figure 5D). In comparison, among the tumors derived from SP-sorted cells, the non-SP compartment comprised 68.9% ± 3.96% (Figure 5E), whereas in tumors derived from non-SP–sorted cells, the SP compartment encompassed 6.71% of the tumor (Figure 5F). These figures translated into an 89.25% ± 5.13% repopulation of the non-SP compartment in SP-derived tumors and a 35.57% repopulation of the SP compartment in non-SP–derived tumors (Figure 5G).
Discussion
Our results show that we successfully applied relevant models for the in-depth characterization of SCLCCs in the immune-competent tumor microenvironment of syngeneic mice. Using the Hoechst 33342 dye efflux method, we were able to detect a Hoechstlow SP in 2 of our murine tumor cell lines. The percentages of 4T1 and NXS2 SPs, 2% and 0.2%, respectively, corresponded to the SPs of HSCs, tissue stem cells, or progenitor cells, ranging from 0.01% to 5%.17,23,35,36 Although we observed some variation in the percentages of SP depending on the cell preparation, this phenomenon also was described by other investigators who used this method for the identification and isolation of stem cells.37 Interestingly, the 10-fold difference in SP cells between 4T1 and NXS2 tumor cell lines could be the reason for only 7 × 10³ 4T1 cells being required to induce orthotopic breast tumors in BALB/c mice, whereas 106 NXS2 cells are required to induce subcutaneous neuroblastoma tumors in A/J mice.
Stem cells and SCLCCs have been identified phenotypically through specific expression marker profiles. We showed by both FACS analysis and RT-PCR that the SP cells found within the 4T1 and NXS2 tumor cell lines also expressed markers associated with stem cells, including Sca-1, Wnt-1, CD24, and ABCG2. Additionally, as reported recently for human neuroblastoma SP cells,22 we found a marked up-regulation of the neural stem cell marker disialoganglioside GD2 in the SP population. Although all these markers are associated with both HSCs and tissue stem cells, their importance in defining tumorigenic cells has come into question. ABCG2, for example, was shown to confer functional properties in maintaining the stem cell phenotype14,38 and has been found to be one of the main determinants responsible for the SP phenomenon.14 However, not all SP cells express ABCG2,39 and challenge with ABCG2+ or ABCG2– tumor cells induced similar incidences and kinetics of tumor formation,24 which suggests that ABCG2 alone may not be the key determinant of tumorigenesis for all cancer cell lines.24 In addition, it was recently reported that CD24–/low human breast carcinoma cells are associated with SCLCCs.7,26 However, in the murine system, repopulation potential has been shown to segregate with both CD24low and CD24high cell populations.13,40,41 Therefore, the finding that murine 4T1 and NXS2 SP cells express CD24, whereas human breast SCLCCs do not, is likely either because these are murine rather than human cells or because CD24 is not an ideal marker for the identification of SCLCCs in all types of carcinomas. These results also suggest that function, rather than phenotype, is the best way of defining SCLCC populations.
One such distinctive function associated with stem cells and SCLCCs is the ability to repopulate an entire cell population in vitro. To this end, we found that compared with non-SP cells, SP cells showed a significantly higher repopulation potential when cultured in vitro. We excluded the possibility that this difference in repopulation potential between SP and non-SP cells is a consequence of cell damage, induced by the Hoechst 33342 dye being retained longer in the non-SP compartment, because CFSE staining of sorted SP and non-SP cells revealed similar frequencies of cell divisions in vitro. Even though there are examples of dedifferentiation,42 stem cells are believed to differentiate asymmetrically in an unidirectional fashion. If SP and non-SP cells are truly SCLCCs and non-SCLCCs, respectively, the repopulation results could indicate de-differentiation from non-SP to SP cells. Cross-contamination during the sorting process appears unlikely because less than 1% of sorted non-SP cells were found in the SP compartment. One critical variable in this respect seems to be how the non-SP compartment is defined. Some investigators have gated the non-SP in the more Hoechst-positive S/G2/M partition,14 whereas we chose to gate on the G0/G1 partition, because this population comprises the majority of cells within the non-SP. However, cells in the G0/G1 partition were reported to be more heterogeneous with respect to their ability to repopulate the SP compartment than the cell population in the S/G2/M partition,43 suggesting that SCLCCs are not only found in the SP but also in the S/G0 compartment.44
Another attribute associated with stem cells is their resistance to chemotherapy. Regarding this, we found that SP cells of both the 4T1 and NXS2 tumor cell lines were more resistant to Dox, and 4T1 SP cells contained less intracellular Dox than did 4T1 non-SP cells. These results could be explained by the higher expression of the drug transporter ABCG2, which has been shown to transport not only the Hoechst 33342 dye but also Dox.45 In addition to Dox resistance, we also observed a trend toward CDDP resistance in 4T1 SP-sorted cells compared with 4T1 non-SP cells. It has been shown that CDDP can bind to the ABCG2 transporter as well46 ; however CDDP has been reported to not be a substrate of the ABCG2 transporter.45,47 Other drug transporters such as ABCC1, C2, C6, and B1b showed similar expression profiles (data not shown). Furthermore, treatment of mice bearing 4T1 breast tumors with Dox resulted in a significant increase in SP cells. This finding agrees well with our in vitro data and underlines an important fact that, although standard chemotherapy regimens reduce overall bulk tumor mass, the more tumorigenic SCLCCs remain and possibly result in disease relapse.
Just as repopulation of an entire cell population in vivo is a vital characteristic of stem cells, tumorigenicity is a hallmark of the SCLCCs. In support of this contention, sorted SP cells of human and rat tumors were reported to be more tumorigenic than non-SP cells in immune-compromised mice.23,24 In our studies, sorted murine tumor SP cells were also more tumorigenic in syngeneic mouse models than were non-SP cells. In fact, 88% of animals challenged with SP cells developed tumors compared with only 25% of mice challenged with non-SP cells. We also observed a trend toward increased metastases in mice challenged with SP cells compared with non-SP cells. In this regard, intravenous injection of NXS2 SP cells resulted in metastases in 2 of 4 mice, whereas 0 of 4 mice challenged with non-SP cells showed metastases. These findings are in agreement with the concept that SCLCCs can acquire a migratory phenotype, as was proposed to explain the various changes occurring during tumor progression.4 Furthermore, in our experiments, Hoechst 33342 dye labeling of single-cell suspensions from excised tumors also revealed a higher repopulation potential of SP cells than of non-SP cells in vivo, because SP cells nearly completely repopulated the non-SP compartment within tumors. Taken together, these results substantiate our contention that the SP cells found within each of the 2 murine tumor cell lines studied play a crucial role during tumor induction, growth, and development in vivo.
The microenvironment was reported to play a crucial role during tumorigenesis30 and also proposed to be decisive in the initiation and fate of malignant cells.48 The fact that we did not observe any differences in vitro in the proliferative capacity of SP and non-SP cells, yet found increased proliferation (or less cell death) of tumor cells in the SP-injected mice, suggests that SP and non-SP cells differ in their abilities to react to or influence the tumor microenvironment. For example, it has been shown that growth factors, such as bFGF and PDGF, can regulate transcription of the Bcrp1 gene which encodes ABCG2 and may therefore determine the fate of SCLCCs.8,23 Together, these findings illustrate one of the key advantages of using a model which incorporates a syngeneic tumor-microenvironment interface.
In summary, our results show that 2 murine tumor cell lines contain SP cells that express markers associated with stem cells. In contrast to non-SP cells, SP cells are also more chemoresistant, have a higher repopulation potential, and are more tumorigenic in immune-competent mice. Therefore, our experimental approach provides a relevant setting for further in-depth studies of SCLCCs in the tumor microenvironment of immune-competent, syngeneic mice.
Authorship
J.A.K. and C.D.K. designed and performed the research and wrote the paper; D.M. performed the research; Y.L., H.Z., R.X., and R.A.R. assisted in analyzing the data and writing the paper.
The authors declare no competing financial interests.
J.A.K. and C.D.K. contributed equally to this study.
Prepublished online as Blood First Edition Paper, August 15, 2006; DOI 10.1182/blood-2006-05-024687.
The publication costs of this article were defrayed in part by page charge payment. Therefore, and solely to indicate this fact, this article is hereby marked “advertisement” in accordance with 18 USC section 1734.
We thank Dr Suzanne Ostrand-Rosenberg (University of Maryland, Baltimore) for the 4T1 breast tumor cell line, the FACS facility for assistance in cell sorting, and Kathy Cairns for assistance with formatting the manuscript.
This work was supported by a grant from the EMD Lexigen Research Center, Billerica, MA (SFP 1645) (R.A.R.).

