Abstract
The optimum chemotherapy schedule for reinduction of patients with high-risk acute myeloid leukemia (relapsed, resistant/refractory, or adverse genetic disease) is uncertain. The MRC AML (Medical Research Council Acute Myeloid Leukemia) Working Group designed a trial comparing fludarabine and high-dose cytosine (FLA) with standard chemotherapy comprising cytosine arabinoside, daunorubicin, and etoposide (ADE). Patients were also randomly assigned to receive filgrastim (G-CSF) from day 0 until neutrophil count was greater than 0.5 × 10⁹/L (or for a maximum of 28 days) and all-trans retinoic acid (ATRA) for 90 days. Between 1998 and 2003, 405 patients were entered: 250 were randomly assigned between FLA and ADE; 356 to G-CSF versus no G-CSF; 362 to ATRA versus no ATRA. The complete remission rate was 61% with 4-year disease-free survival of 29%. There were no significant differences in the CR rate, deaths in CR, relapse rate, or DFS between ADE and FLA, although survival at 4 years was worse with FLA (16% versus 27%, P = .05). Neither the addition of ATRA nor G-CSF demonstrated any differences in the CR rate, relapse rate, DFS, or overall survival between the groups. In conclusion these findings indicate that FLA may be inferior to standard chemotherapy in high-risk AML and that the outcome is not improved with the addition of either G-CSF or ATRA.
Introduction
The outlook for many patients with acute myeloid leukemia (AML) remains poor. In younger patients, more than 80% will achieve a complete remission (CR); however, only about 40% will be cured1,2 The results are considerably inferior for patients aged older than 60 years, although despite remission rates of 50% to 60%, only about 15% are alive 3 years later, and the risk of relapse following remission is 80%.3,4 The optimum strategy at the time of relapse or for patients with resistant disease remains uncertain. Although allogeneic transplantation can be curative if used in early relapse5 or in younger patients with resistant disease,6 this option is unavailable for the majority of patients, and additional chemotherapy is usually delivered in the hope of achieving a remission. The outlook for patients with AML who have relapsed is closely related to the patient's age, the duration of the initial remission, and cytogenetics at diagnosis. Patients who have had a remission of 6 months or less fare very poorly and have a second complete response rate of 10% compared with those whose first remission has exceeded 18 months, whereby the CR rate is better than 50%.7-9 The other important factor in determining outcome after relapse is the karyotype.10 The majority of patients who had a favorable karyotype at diagnosis will achieve a second CR, whereas only about one third of patients with an adverse karyotype will achieve this.10,11 When considering what treatment options to offer patients with relapsed disease, it is important to consider these factors to guide advice.12 Our previous trials have clearly indicated that patients who fail to respond to the first course of induction treatment, those who fail to reduce the bone marrow blast percentage to less than 15%, or who have poor risk cytogenetics, defined as –5, –7, del(5q), abnormal 3q, or complex karyotype, either will fail to enter CR with a second course or will rapidly relapse even if remission is achieved.
Leopold and Willemze13 have reviewed the results over the past 20 years of 31 trials of treatment for relapsed or resistant AML and concluded that no single regimen was superior. They confirmed that the outcome was predicted mainly by the age of the patient and previous duration of remission. Combination treatments were associated with increased CR rates but with greater toxicity, and no treatments resulted in durable remissions in all but a minority of patients. Despite no clear guide as to which regimen may be better in the setting of resistant disease or reinduction, there has been considerable enthusiasm for combinations of fludarabine and high-dose cytarabine, usually supported with granulocyte colony-stimulating factor and occasionally combined with idarubicin (FLAG or FLAG-Ida). The use of increased doses of cytarabine is logical because it has been appreciated for some time that high-dose cytarabine in consolidation is associated with an improved outcome, particularly in younger patients with AML.14,15 The addition of the purine analog fludarabine results in increased AML blast intracellular levels of the active cytosine metabolite cytosine triphosphate16 and improved cell kill.17 A number of phase 2 studies have now been published on the combination of FLAG ± idarubicin to treat relapsed or refractory AML, high-risk myelodysplasia, and acute lymphoblastic leukemia in relapse.17-26 Remission rates vary from 50% to 60% and the median duration of remission from 4 to 12 months. It is impossible to ascertain whether the addition of an anthracycline is advantageous. All of the studies have relatively short follow-up, and none was randomized, so it is not possible to conclude whether this combination was superior to a standard approach. Although granulocyte colony-stimulating factor has been used, it is unclear whether this is a key component. Despite the uncertainty as to whether FLAG with or without an anthracycline was a more useful combination than conventional treatment with standard reinduction regimens, by the late 1990s in the United Kingdom the adoption of these treatments was widespread for the treatment of relapsed or resistant AML.
Because the outcomes of this patient group remain poor whatever treatment strategy is used, additional therapies which might influence the outcome were considered. All-trans retinoic acid (ATRA) has a dramatic benefit in combination with chemotherapy in acute promyelocytic leukemia (APL).27 Although its principal activity is in the treatment of APL, there is in vitro data to provide a rationale to use it in combination with chemotherapy. The priming of AML blasts with ATRA in vitro increased the sensitivity to cytarabine probably because of the shortening of the half-life of Bcl-2 protein.28,29 Because overexpression of Bcl-2 has been shown to confer chemoresistance in AML30,31 presumably by impeding the apoptotic consequences of chemotherapy, there was some rationale for testing the possibility of enhancing the efficacy of cytarabine by a second mechanism. Preliminary clinical results suggested that this would be beneficial,17 although longer follow-up of the first study showed no benefit.32
In our previous study for relapsed disease,33 we demonstrated that standard ADE (cytarabine, daunorubicin, etoposide) was superior to “sequential” ADE, so we adopted standard ADE as the control arm for the present study. In this trial the principal question posed was (1) is FLA better than ADE? Subsidiary questions were (2) does the addition of G-CSF (filgrastim) improve results, and (3) does coadministration of ATRA for 60 days have any benefit?
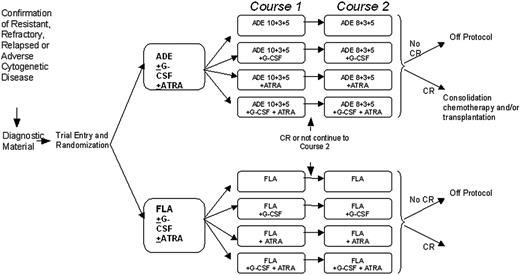
Trial schema and treatment schedules. ADE 10 + 3 + 5 treatment was cytarabine 100 mg/m2 every 12 hours by intravenous push on days 1 to 10 inclusive (20 doses); daunorubicin 50 mg/m2 daily by slow intravenous push on days 1, 3, and 5 (3 doses); etoposide 100 mg/m2 daily by 1-hour intravenous infusion on days 1 to 5 inclusive (5 doses). ADE 8 + 3 + 5 treatment was cytarabine 100 mg/m2 every 12 hours by intravenous push on days 1 to 8 inclusive (16 doses); daunorubicin 50 mg/m2 daily by slow intravenous push on days 1, 3, and 5 (3 doses); etoposide 100 mg/m2 daily by 1-hour intravenous infusion on days 1 to 5 inclusive (5 doses). FLA treatment was fludarabine 30 mg/m2 daily by 30-minute intravenous infusion on days 1 to 5 inclusive (5 doses); cytarabine 2 g/m2 daily by intravenous infusion over 4 hours on days 1 to 5 inclusive (5 doses, total 10 g/m2). For patients aged 60 years or older the cytarabine infusion was reduced to 1 g/m2 daily (total 5 g/m2). G-CSF treatment was 0.5 MU (5 μg)/kg per day subcutaneously or intravenously, starting on the first day of each course of induction chemotherapy (courses 1 and 2). G-CSF should be administered daily until the neutrophil count is greater than 0.5 × 10⁹/L for 2 consecutive days, up to a maximum of 28 days. ATRA treatment was 45 mg/m2 per day orally, starting on the first day of chemotherapy course 1 and continuing daily during and after courses 1 and 2, to a maximum of 90 days (or until the patient comes off protocol if this occurs before 90 days).
Trial schema and treatment schedules. ADE 10 + 3 + 5 treatment was cytarabine 100 mg/m2 every 12 hours by intravenous push on days 1 to 10 inclusive (20 doses); daunorubicin 50 mg/m2 daily by slow intravenous push on days 1, 3, and 5 (3 doses); etoposide 100 mg/m2 daily by 1-hour intravenous infusion on days 1 to 5 inclusive (5 doses). ADE 8 + 3 + 5 treatment was cytarabine 100 mg/m2 every 12 hours by intravenous push on days 1 to 8 inclusive (16 doses); daunorubicin 50 mg/m2 daily by slow intravenous push on days 1, 3, and 5 (3 doses); etoposide 100 mg/m2 daily by 1-hour intravenous infusion on days 1 to 5 inclusive (5 doses). FLA treatment was fludarabine 30 mg/m2 daily by 30-minute intravenous infusion on days 1 to 5 inclusive (5 doses); cytarabine 2 g/m2 daily by intravenous infusion over 4 hours on days 1 to 5 inclusive (5 doses, total 10 g/m2). For patients aged 60 years or older the cytarabine infusion was reduced to 1 g/m2 daily (total 5 g/m2). G-CSF treatment was 0.5 MU (5 μg)/kg per day subcutaneously or intravenously, starting on the first day of each course of induction chemotherapy (courses 1 and 2). G-CSF should be administered daily until the neutrophil count is greater than 0.5 × 10⁹/L for 2 consecutive days, up to a maximum of 28 days. ATRA treatment was 45 mg/m2 per day orally, starting on the first day of chemotherapy course 1 and continuing daily during and after courses 1 and 2, to a maximum of 90 days (or until the patient comes off protocol if this occurs before 90 days).
Patients, materials, and methods
Patient eligibility
Patients were eligible if they had de novo or secondary AML, excluding APL, and (1) had relapsed from first CR; (2) had received one course of chemotherapy and were found to have poor risk cytogenetics at initial diagnosis (–5, –7, del 5q, abnormal 3q, or complex karyotype defined as > 4 abnormalities) whether they had achieved CR with course 1; (3) had resistant disease defined as greater than 15% marrow blasts after recovery from course 1; (4) had refractory disease defined as failure to achieve CR after 2 induction courses. The trial was approved by a UK National Multicenter Research Ethics Committee and by each participating institution's local ethics committee. All patients gave written informed consent.
Treatments
The trial involved a 2 × 2 × 2 factorial design in which patients could be randomly assigned to (1) FLA versus ADE, (2) G-CSF versus no G-CSF, or (3) ATRA versus no ATRA. There was flexibility in the design, and patients could undergo all 3 randomizations, any combination of 2, or just one. The treatment regimens are shown in Figure 1. Bone marrow responses were assessed 21 to 28 days after completion of each course until CR was confirmed. Following completion of the induction schedule, patients could proceed to stem-cell transplantation, further consolidation with high-dose cytarabine, or other therapy at the discretion of the patient's clinician.
Definition of end points
A normocellular bone marrow aspirate containing less than 5% leukemic blast cells and showing evidence of normal maturation of other marrow elements was the criterion for the achievement of CR. The persistence of myelodysplastic features did not exclude the diagnosis of CR. Remission failures were classified by the investigating clinician as because of either induction death (ID; ie, related to treatment and/or hypoplasia) or resistant disease (RD; ie, related to the failure of therapy to eliminate the disease, including partial remissions with 5%-15% blasts). When the clinician's evaluation was not available, deaths within 30 days of entry were classified as ID and deaths at more than 30 days as RD. Some patients with adverse genetics at diagnosis were already in CR at entry, so these patients do not contribute to the evaluation of CR and reasons for failure.
The following definitions are also used: overall survival (OS) is the time from random assignment to death; for remitters, disease-free survival (DFS) is the time from CR to first event (either relapse or death in CR), except for patients with adverse genetics who were in CR at the time of entry for whom it is the time from random assignment to first event; and, for remitters, the relapse risk is the cumulative probability of relapse ignoring (ie, censoring at) death in first CR, and death in first CR is the cumulative probability of dying in CR ignoring relapse.
Statistical methods
The trial sample size was calculated on the basis that to detect a 10% improvement in 2-year survival from 10% to 20%, at a 2-tailed P value of .05 with 90% power would require 400 patients for each comparison (ie, 200 per treatment arm) in the absence of interactions among the 3 comparisons.
Randomization was performed by telephone call to the central trial office. Allocation was computer generated using minimization to ensure balance overall and within stratification parameters: type of disease (resistant, refractory, relapsed, adverse genetic), age (15-29, 30-49, 50-59, 60-69, 70+ years), World Health Organization (WHO) performance status, type of AML at initial diagnosis (de novo, secondary), whether prior transplantation (for relapsed patients), and previous MRC/LRF trial.
For time-to-event end points, Kaplan-Meier life tables were constructed and were compared by means of the log-rank test. Surviving patients were censored at 1 May 2005 when follow-up was up to date for 96% of patients (the small number of patients lost to follow-up are censored at the date they were last known to be alive). All point estimates quoted are at 4 years.
Categorical end points (eg, CR rates) were compared among arms by Fisher exact tests. Continuous variables (eg, nonhematologic toxicity and supportive care requirements) were analyzed by parametric (t test) or nonparametric (Wilcoxon) tests as appropriate. Time to hematologic recovery and days in hospital were analyzed using the log-rank test.
Interactions between the randomized comparisons were investigated by stratified analyses, that is, with each comparison adjusted for the others, using tests for heterogeneity over strata.
In addition to the overall analyses of the randomized comparisons, subgroup analyses were performed by the predefined stratification parameters, although because of small numbers, some groups were combined to give larger numbers and greater statistical reliability (eg, the small number of patients entered with refractory disease are combined with those with resistant disease). Tests for heterogeneity of or trend in treatment effect among subgroups were performed. Because of the well-known dangers of subgroup analysis, all such analyses were interpreted cautiously.
Odds ratios (ORs) or hazard ratios (HRs), with the 95% confidence intervals, are quoted for all main end points (CR, DFS, OS). An OR/HR less than 1.0 indicates benefit for the investigational therapy (ie, FLA, G-CSF, or ATRA). All P values are 2 tailed. All analyses are performed on the “intention to treat” principle with all patients analyzed in their allocated arms, irrespective of whether they actually received their allocated treatment.
Results
Patient characteristics
Between December 1998 and December 2003, 405 patients were entered into the AML-HR trial by 171 clinicians at 94 hospitals in the United Kingdom, Republic of Ireland, and New Zealand. Two hundred fifty patients were randomly assigned between FLA and ADE, 356 to G-CSF versus no G-CSF, and 362 to ATRA versus no ATRA. Of the 155 patients not randomly assigned between FLA versus ADE, 145 elected FLA and 10 elected ADE. Of the 49 patients not randomly assigned between G-CSF versus not, 16 elected G-CSF and 33 did not. All 43 patients not randomly assigned for ATRA elected no ATRA as required by the protocol.
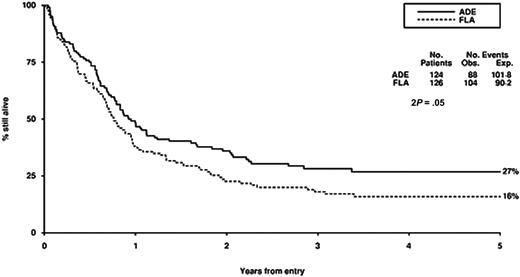
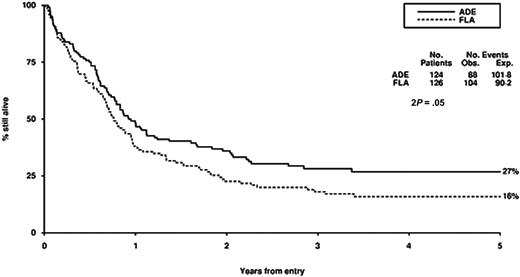
Survival from entry: FLA versus ADE treatment. There were 124 patients treated with ADE, with 88 events observed and 101 to 108 events expected. There were 126 patients treated with FLA, with 104 events observed and 90 to 92 events expected.
Survival from entry: FLA versus ADE treatment. There were 124 patients treated with ADE, with 88 events observed and 101 to 108 events expected. There were 126 patients treated with FLA, with 104 events observed and 90 to 92 events expected.
Baseline characteristics of the population are shown in Table 1. Of the 61 patients entered with adverse cytogenetics, 33 (54%) were already in CR at the time of random assignment. The majority of patients had previously been entered into the AML12 trial (n = 228), with 1 from AML10, 6 from AML11, 70 from AML14, 21 from AML15, and 79 not previously in an MRC/LRF trial. Thus, the majority of patients (those from AML10, AML12, and AML15, plus most of those not in a previous trial) had received intensive induction and consolidation suitable for younger patients; therapy was less intensive but still involved standard daunorubicin/cytarabine-based induction for the older patients in AML11 and AML14 (because the randomization was stratified by previous trial to ensure balance, stratification of the analyses does not affect the results). Only 7 patients had received a transplantation prior to entry into AML-HR.
Compliance and treatment received
Compliance with allocated treatment was good, with greater than 90% of patients starting their allocated induction chemotherapy. Of patients allocated to the ADE treatment arm, 3 did not receive any therapy and 10 received FLA. Of patients allocated to the FLA treatment arm, 2 did not receive any therapy and 3 received FLA. In the G-CSF treatment arm, 96% of patients allocated to G-CSF received it, whereas 20% of patients allocated no G-CSF actually received G-CSF based on the participating investigator's judgment that it was required to curtail posttherapy neutropenia. In these cases G-CSF was started a few days after completion of therapy and discontinued on neutrophil recovery. In the ATRA treatment arm, 94% of patients allocated to ATRA received it, whereas 2% of patients allocated no ATRA actually received ATRA.
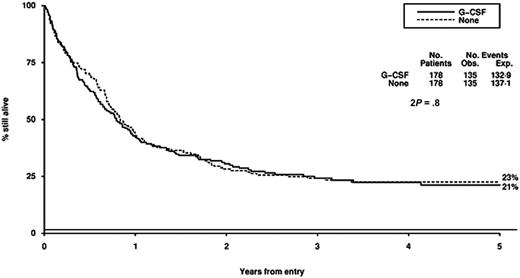
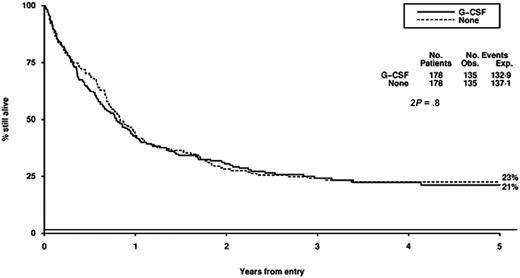
Survival from entry: G-CSF versus no G-CSF treatment. There were 178 patients treated with G-CSF, with 135 events observed and 132 to 139 events expected. There were 178 patients not treated with G-CSF, with 135 events observed and 137 to 141 events expected.
Survival from entry: G-CSF versus no G-CSF treatment. There were 178 patients treated with G-CSF, with 135 events observed and 132 to 139 events expected. There were 178 patients not treated with G-CSF, with 135 events observed and 137 to 141 events expected.
Among patients achieving CR, the following consolidation therapy is known to have been given: high-dose cytarabine (n = 70), other chemotherapy (n = 42), matched sibling allogeneic stem cell transplantation (SCT; n = 52), unrelated donor SCT (n = 41), and autologous SCT (n = 33). There were no substantial differences among arms with respect to the additional therapy given. For the FLA versus ADE randomization, transplantations were undertaken as follows: 16 versus 9 sibling allogeneic, 7 versus 13 unrelated donor allogeneic, 8 versus 9 autologous.
Overall results
The CR rate for the entire population was 61%, with 8% failing because of induction death and 31% because of resistant disease. The death rate in CR was 29% and the relapse rate was 59%, leading to 4-year DFS of 29%. Overall survival was 22% at 4 years.
FLA versus ADE randomization
There were no significant differences in CR rate, reasons for failure to achieve CR, death in CR, relapse rate, disease-free survival between FLA and ADE, although overall survival was worse (P = .05) with FLA (Table 2; Figure 2). Censoring the overall survival analysis at transplantation did not alter the treatment effect in any meaningful way (HR, 1.37; 95% CI, 1.00-1.89; P = .05).
G-GCF versus no G-CSF randomization
ATRA versus no ATRA randomization
Toxicity
There were few large differences in hematologic toxicity or nonhematologic toxicity among the 3 treatment arms (Table 5). Significant differences were as follows: greater diarrhea with ADE compared with FLA after both course 1 (P < .001) and course 2 (P = .002), more nausea and vomiting with ADE in course 1 (P = .04), longer hospitalization with ADE after course 1 (P = .002), faster neutrophil recovery with G-CSF after both course 1 (P = .002) and course 2 (P = .05), more blood support with G-CSF after course 1 (P = .04), more platelet support after course 2 (P = .01), and worse cardiac function after course 2 with G-CSF (P = .009). Considering just grade 3 to 4 toxicities, the differences in diarrhea between FLA versus ADE were not significant (P = .3 for course 1; P = .8 for course 2).
Resource usage
There were no major differences in supportive care requirements and other resource usage within the 3 treatment arms (Table 6). Patients in the G-CSF treatment arm did require more blood transfusions after both course 1 (P = .01) and course 2 (P = .04) and also more platelets after course 2 (P = .01), whereas patients in the ATRA treatment arm received more units of blood after course 1(P = .03).
Treatment interactions
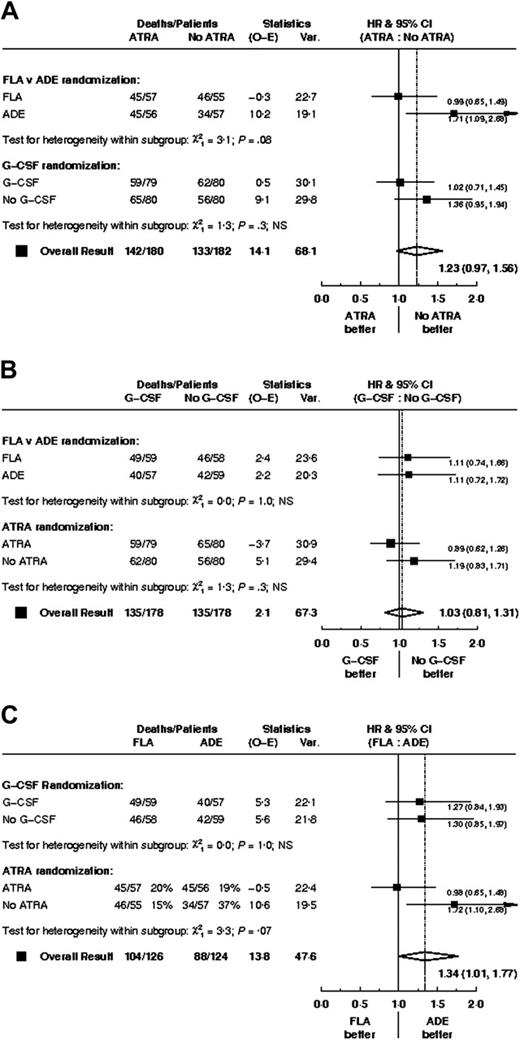
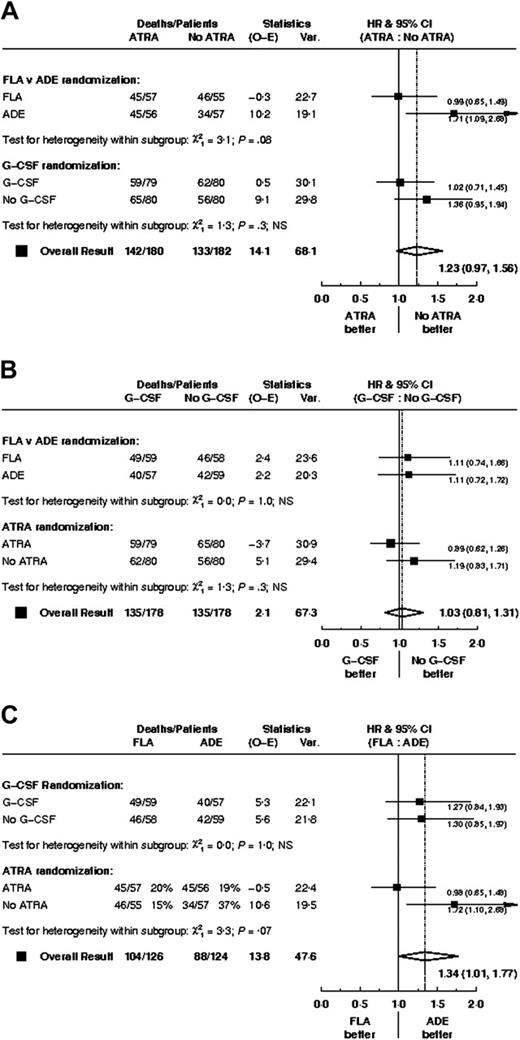
There was no clear evidence of any interactions among the 3 treatment comparisons; data are shown for overall survival (Figure 5).
Subgroup analysis
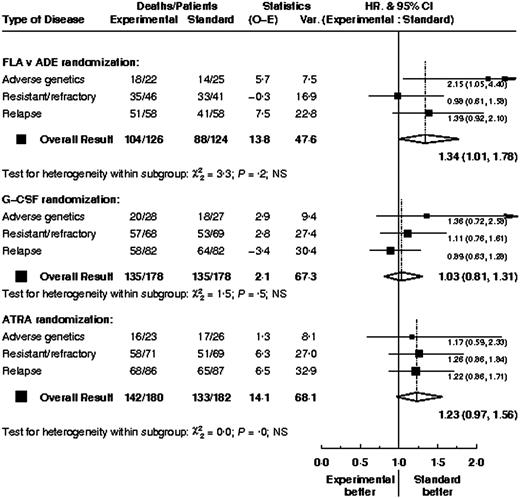
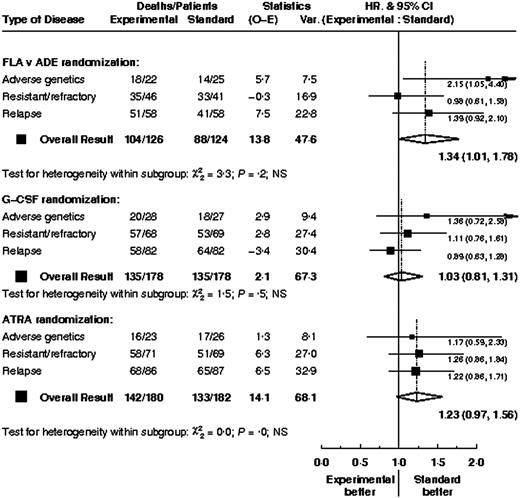
Overall outcome (CR rates and overall survival) by various baseline parameters is shown in Table 7. There was no evidence that the treatment effects within any of the 3 comparisons differed between types of patient; data are shown for overall survival by type of high-risk disease (Figure 6). For patients with adverse genetics, there was no evidence that survival within the FLA versus ADE treatment arms differed depending on whether the patients were in CR (HR, 2.17; 95% CI, 0.94-5.00) or not (HR, 1.62; 95% CI, 0.35-7.48) at the time of entry (test for interaction P = .7). Similarly, duration of first CR did not significantly alter the FLA versus ADE treatment effect; for patients with a CR duration of less than 1 year the hazard ratio was 1.24 (95% CI, 0.68-2.24) and for those with longer CRs the hazard ratio was 1.45 (95% CI, 0.82-2.57; test for interaction, P = .7)
Discussion
A number of nonrandomized studies have indicated that FLA with or without G-CSF and an anthracycline may be a better treatment for patients with relapsed or refractory AML.17-26 This has led to widespread adoption of such schedules. Our study does not support this course of action because this large randomized trial indicates that, if anything, FLA was inferior to standard ADE in this difficult group of patients. Because the original induction treatment of some of these patients was ADE (an option in AML12), it is not surprising that only 250 of the 405 patients who entered the trial were randomly assigned to ADE versus FLA. Despite this, there was no evidence that FLA was a better treatment in any of the subgroups analyzed (refractory disease, resistant disease, relapsed disease, or adverse karyotype). Although the addition of fludarabine to cytarabine treatment is attractive by potentially increasing intracellular levels of ara-CTP, a recent study from the HOVON group was unable to show any clinical advantage in a phase 3 trial in patients newly diagnosed with high-risk AML or myelodysplastic syndrome (MDS), despite confirming the increase in ara-CTP.34 We are currently prospectively evaluating the FLAG-Ida schedule as first-line treatment in younger patients.
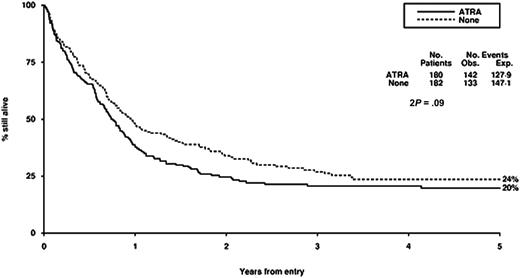
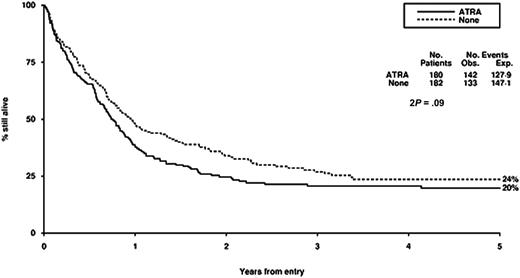
Survival from entry: ATRA versus no ATRA treatment. There were 180 patients treated with ATRA, with 142 events observed and 127 to 129 events expected. There were 182 patients not treated with ATRA, with 133 events observed and 147 to 151 events expected.
Survival from entry: ATRA versus no ATRA treatment. There were 180 patients treated with ATRA, with 142 events observed and 127 to 129 events expected. There were 182 patients not treated with ATRA, with 133 events observed and 147 to 151 events expected.
Our failure to demonstrate any detectable benefit of the addition of ATRA to chemotherapy in this context is consistent with the experience of others. This is another example of plausible preclinical rationale not being translated into clinical reality. We have evaluated the addition of ATRA in induction therapy in 1095 randomly assigned patients younger than 60 years and in addition to low-dose cytarabine in 207 randomly assigned older patients, but without detectable benefits in either case.35
The role of G-CSF in the management of AML has been extensively tested and remains contentious.36-44 These trials all show a modest reduction in the duration but not the depth of the neutropenia and provide no evidence that these myeloid growth factors induce the growth of myeloid leukemia cells. The effects of growth factors on outcome, incidence of severe infection, antibiotic usage, duration of hospitalization, and complete remission rate are variable, and guidelines from the American Society of Clinical Oncology and the British Committee for Standards in Haematology conclude that there is no evidence to support the routine use of growth factors after remission induction chemotherapy for AML.45,46 There is some experimental evidence to suggest that growth factors given prior to or with chemotherapy may enhance the cytotoxicity of chemotherapy. Data on this remain uncertain, and it has been difficult to separate a possible “priming” effect from the effect on granulocyte recovery.39,47,48 A recent European trial of G-CSF in AML49 has suggested a survival gain for patients with standard risk AML which appears to be due to a reduction in relapse risk, although the validity of this subgroup analysis is questionable and the result has not been supported by other studies of the priming concept. The results of our trial do not suggest that G-CSF, which was given from the first day of chemotherapy for a maximum of 28 days in each cycle, had any influence on remission rate, DFS, overall survival, or toxicity. The time to achieve greater than 1.0 × 10⁹/L neutrophils was reduced, but this did not result in a reduced length of hospital admission.
Hazard ratio plots of survival for each treatment arm stratified by the others.
Hazard ratio plots of survival for each treatment arm stratified by the others.
Once patients fail first-line treatment, the prognosis is poor. The outcome substantially depends on relatively straightforward prognostic factors such as age, duration of CR1, and cytogenetics at diagnosis. Once again we have demonstrated that in this trial. Our failure to demonstrate differences in any of the comparisons does not necessarily mean that they will be ineffective as first-line treatment. Our other studies with ATRA in non-APL cases, however, suggest that this will be unlikely for ATRA therapy. In several growth factor trials, results have not changed the disease outcome. We are currently evaluating the FLAG-Ida schedule as first-line treatment (MRC AML15 trial).
In conclusion, we found no evidence that fludarabine with high-dose cytosine was a better treatment than the standard MRC schedule of ADE for patients with high-risk AML. Additionally, we established no support for the use of either G-CSF or ATRA with these regimens. Relapsed disease is a difficult stage of the disease at which to evaluate new treatments because the outcomes are so strongly determined by prognostic factors. This study underlines the importance of randomized controlled trials to guide new treatments in AML. Unless the effect of prognostic factors, which have a greater influence on outcome than treatment, is taken into account and controlled for by randomization, misleading conclusions could be reached.
Hazard ratio plots of survival for each treatment arm stratified by type of high-risk AML.
Hazard ratio plots of survival for each treatment arm stratified by type of high-risk AML.
Appendix
The following centers entered patients into AML-HR: Birmingham Heartlands Hospital, Oxford Radcliffe Hospitals, Addenbrooke's NHS Trust, University Hospital of Wales, Leeds General Infirmary, Western Infirmary, Royal Devon and Exeter Hospital, Aberdeen Royal Infirmary, Singleton Hospital, Leicester Royal Infirmary, York District Hospital, The Great Western Hospital, Bradford Royal Infirmary, Western General Hospital, Victoria Hospital (Fife), University College Hospital London, UCL Medical School, Russells Hall Hospital, Belfast City Hospital, Wycombe General Hospital, Cheltenham General Hospital, Victoria Infirmary (Glasgow), St Georg's Hospital, Hull Royal Infirmary, Rotherham District General, Norfolk & Norwich University Hospital, Dundee Teaching Hospitals NHS Trust, University Hospital Aintree, St James's University Hospital, St Helier Hospital, Salisbury District Hospital, Raigmore Hospital, Queen Mary's Sidcup NHS Trust, North Staffs Hospital Centre, Medway Maritime Hospital, Ealing Hospital, Crosshouse Hospital, Whiston Hospital, Whipps Cross Hospital, Sandwell General Hospital, Royal Victoria Infirmary, Royal United Hospital NHS Trust, Royal Liverpool University Hospital, Poole Hospital NHS Trust, Northampton General Hospital, James Paget Hospital, Hemel Hempstead General Hospital, Glan Clwyd Hospital, Derriford Hospital, Christchurch Hospital, Adelaide/Meath Hospitals, St Richard's Hospital, Southern General Hospital, Royal Surrey County Hospital, Queen Elizabeth Hospital, Northwick Park Hospital, Mount Vernon Hospital, James Cook University Hospital, Guy's Hospital, Good Hope Hospital NHS Trust, Borders General Hospital, Beaumont Hospital, Barnet General Hospital, Arrowe Park Hospital, Airedale General Hospital, William Harvey Hospital, Wexham Park Hospital, West Middlesex Hospital, Wellington Hospital, Walton Hospital, Victoria Hospital (Lancs), University College Hospital Eire, United Bristol Healthcare Trust, The North Hampshire Hospital, Royal Free Hospital, Royal Cornwall Hospital, Queen Alexandra Hospital, Pilgrim Hospital, Peterborough District Hospital, Perth Royal Infirmary, North Middlesex Hospital, Monklands District General, Mayday Hospital, Manor Hospital, Manchester Royal Infirmary, Lincoln County Hospital, Ipswich Hospital, Huddersfield Royal Infirmary, Glasgow Royal Infirmary, Falkirk District Royal Infirmary, Eastbourne District General, Derbyshire Royal Infirmary, Conquest Hospital, Central Middlesex Hospital, Canterbury Health Laboratories, and Ysbyty Gwynedd.
Prepublished online as Blood First Edition Paper, February 16, 2006; DOI 10.1182/blood-2005-10-4202.
A complete list of the members of the National Cancer Research Institute (NCRI) Haematological Oncology Clinical Studies Group appears in the “Appendix.”
D.W.M., K.W., and A.K.B. conceived of the study; D.W.M. wrote the manuscript with contributions from K.W. and A.K.B.; K.W. performed the statistical analysis; T.L. and J.I.O.C. were significant clinical contributors to the trial and have reviewed the manuscript.
An Inside Blood analysis of this article appears at the front of this issue.
The publication costs of this article were defrayed in part by page charge payment. Therefore, and solely to indicate this fact, this article is hereby marked “advertisement” in accordance with 18 U.S.C. section 1734.
We would like to thank the trial teams at the Clinical Trial Service Unit, Oxford, and Birmingham Clinical Trials Unit for data management, and Cassey Brookes for performing some of the analyses.

