Key Points
In patients intended for third-line CAR T-cell therapy, patients with DR-LBCL have an inferior OS compared to the NDR-LBCL counterparts.
CAR T-cell eligible patients with DR-LBCL have a lower likelihood of proceeding with CAR T-cell infusion compared to those with NDR-LBCL.
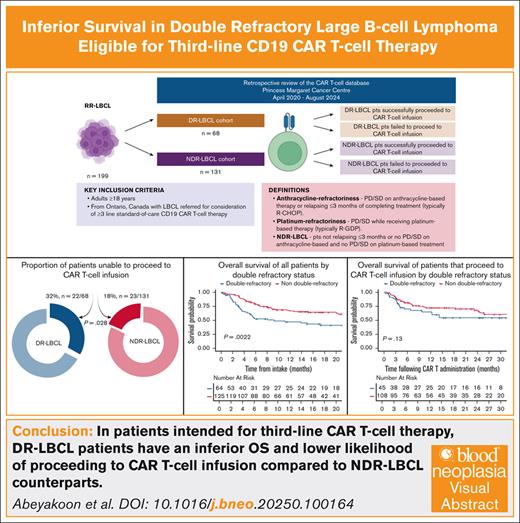
Visual Abstract
Outcomes following CD19 chimeric antigen receptor (CAR) T-cell therapy in third-line treatment and beyond for patients with large B-cell lymphoma (LBCL) refractory to both an anthracycline during initial and platinum-based salvage therapy, referred to as double refractory (DR), are not well-described. It is also unclear if these patients may be less likely to proceed to CAR T-cell infusion. Our objectives were to assess third-line CAR T-cell survival outcomes in DR- and non-DR (NDR)-LBCL cohorts including the failure rates to proceed to cell infusion. Review of 199 patients with LBCL referred for CAR T-cell treatment at our center, demonstrates that the DR-LBCL patients (n = 68) have an inferior 12-month (overall survival [OS], 47.1% vs 66.7%, respectively;) when compared to the patients with NDR-LBCL (n = 131). This OS difference is driven by a higher failure rate to proceed to CAR T-cell infusion (32% vs 18%). For patients unable to proceed to CAR T-cell infusion median OS was 2.56 months; DR-LBCL 1.94 months vs NDR-LBCL 3.42 months. The 12-month OS (65% vs 72.3%) and 6-month progression-free survival (46.5% vs 57.2%) of patients with DR- and NDR-LBCL proceeding to CAR T-cell infusion, appears similar. Our study highlights a high-risk subgroup characterized by inferior OS with challenges in getting to CAR T-cell infusion and could benefit from different management approaches such as novel bridging or “off-the-shelf” strategies.
Introduction
Chimeric antigen receptor T-cell (CAR T-cell) therapy directed at CD19 has transformed the management of large B-cell lymphoma (LBCL), which include de novo diffuse LBCL (DLBCL), transformed DLBCL (tDLBCL) from indolent B-cell lymphomas and primary mediastinal B-cell lymphoma as disease subtypes shown to potentially benefit from this therapy. The pivotal ZUMA-1 trial demonstrated an overall response rate of 82%, a median progression-free survival (PFS) of 5.8 months (95% confidence interval [CI], 3.3 to not reached [NR]) with a 6-month PFS of 49% (95% CI, 39-58) and a 5-year overall survival (OS) of 42.6% (95% CI, 32.8-51.9) with the anti-CD19 CAR T-cell axicabtagene ciloleucel as third-line treatment and beyond.1,2 The observed survival rates compared favorably to the historical benchmark established by the SCHOLAR-1 study where median OS was only 6.3 months in refractory LBCL, defined as those patients having progressive disease (PD) or stable disease (SD) as best response at any point during therapy or relapsing ≤12 months from an autologous stem cell transplantation (ASCT).3 Similarly, tisagenlecleucel (JULIET trial) and lisocabtagene maraleucel (TRANSCEND NHL 001 trial), 2 additional anti-CD19 CAR T-cell products have demonstrated favorable efficacy obtaining regulatory approval in multiple countries, paving the way to accept CAR T-cell therapy as the standard-of-care third-line treatment where accessible.1,4,5 Data from several large-scale registries and cohorts have demonstrated comparable efficacy and safety to that seen in clinical trials when CAR T-cell therapy is applied in clinical practice, confirming applicability of this therapy as third-line treatment to a broader non–trial-eligible patient population.6-13
Since the introduction of the CD20 monoclonal antibody rituximab in the late 1990s, anthracycline-based regimens such as R-CHOP (rituximab, cyclophosphamide, doxorubicin, vincristine, prednisolone) or variations thereof have been the standard frontline regimen for LBCL.14 Second-line salvage approach for ASCT eligible younger and fitter patients has typically been platinum-based regimens (eg, GDP [gemcitabine, dexamethasone, cisplatin], DHAP [dexamethasone, high-dose cytarabine, cisplatin], ICE [ifosfamide, carboplatin, etoposide], ESHAP [etoposide, methylprednisolone, high-dose cytarabine, cisplatin]) with the aim to consolidate responses with ASCT.15-17 Despite the clinical awareness of poor outcomes in patients refractory to both an anthracycline and second-line salvage regimens, where proceeding to an ASCT is futile due to lack of response, there is a paucity of published data that characterize the outcomes of such patients receiving third-line CAR T-cell therapy in the modern era.18 Approximately 10% to 15% of patients in the ZUMA-1 and TRANSCEND pivotal phase 2 trials were unable to proceed with CAR T-cell infusion after apheresis with similar proportions reported in most registries, except one report from the United Kingdom where a 26% rate of noninfusion was noted.5,8,10-12 Furthermore, the pivotal phase 2 clinical trials and registry data lack reporting of outcomes in patients that do not proceed to CAR T-cell infusion.
We hypothesize that patients with lymphoma refractory to an anthracycline and platinum chemotherapy would have inferior outcomes in an intent-to-treat analysis of third-line CAR T-cell therapy. Anticipated inferior survival could be due to poor outcomes after CAR T-cell therapy or the inability to proceed to CAR T-cell infusion due to PD and poor performance status. Understanding these outcomes will inform patient discussions regarding realistic expectations from CAR T-cell therapy and direct further research. Consequently, we sought to assess clinical outcomes of patients with double refractory LBCL (DR-LBCL) compared to a control cohort of non-DR LBCL (NDR-LBCL) intended for CAR T-cell therapy after 2 or more lines of therapy.
Methods
Study design and population
This was a retrospective, intention-to-treat analysis of data extracted from the CAR T-cell database at the Princess Margaret Cancer Centre, Toronto, Canada between April 2020 to August 2024. The aim of the study was to assess outcomes of patients with DR-LBCL treated with standard-of-care CD19 CAR T-cell therapy. DR disease was defined as lymphoma refractory to both an anthracycline and platinum agent. Anthracycline-refractoriness was defined as PD or SD on therapy or relapsing ≤3 months of completing frontline treatment containing an anthracycline agent.19,20 Platinum-refractoriness was defined as PD or SD while receiving platinum-based salvage therapy, usually given before planned ASCT. NDR disease was defined as lymphoma relapsing >3 months after anthracycline-based therapy and having a response better than PD or SD while on platinum-based treatment.
Eligible patients were adults aged ≥18 years with LBCL referred for consideration of stand-of-care CD19 CAR T-cell therapy after 2 or more lines of therapy. De novo DLBCL, tDLBCL from indolent histologies (follicular lymphoma, marginal-zone lymphoma, or lymphoplasmacytic lymphoma) and primary mediastinal B-cell lymphoma were included as LBCL histologies. Patients were excluded if they were referred from outside the province of Ontario due to potential challenges in capturing accurate follow-up data.
Institutional research ethics board approval was granted by the Princess Margaret Cancer Centre Research Ethics Board for the conduct of this study.
Outcomes
There were 4 outcomes investigated in our study: (1) OS of patients with DR- and NDR-LBCL, (2) proportion of patients unable to proceed to CAR T-cell infusion overall and in each patient cohorts with DR- and NDR-LBCL, (3) PFS and OS of patients with DR- and NDR-LBCL that proceeded to CAR T-cell infusion, and (4) OS of patients with DR- and NDR-LBCL that were unable to proceed with CAR T-cell infusion.
Statistical analysis
This patient cohort was characterized using descriptive statistics such as means, medians, counts, and proportions. Rates of failure to proceed with CAR T-cell infusion were compared using Pearson chi-squared test.
When analyzing OS in the entire cohort (all patients who did and did not receive CAR T-cell infusion), OS time began at date of intake (defined as the date of initial patient consultation for consideration for CAR T-cell therapy). Among patients who proceeded to CAR T-cell infusion, OS was defined from date of CAR T-cell infusion to death. PFS was defined as time from CAR T-cell infusion to PD (as evident on imaging or biopsy whichever occurred earlier) or death from any cause, whichever occurred earlier. Patients who remained alive and without disease progression at cutoff date were censored at the date of last follow-up.
Median follow-up time was computed using the reverse Kaplan-Meier estimator, treating patients whose date of death was not observed as having an event at their date of last follow-up. The Kaplan-Meier estimator and log rank test were used to compare OS between groups. Progression status was assessed at regular intervals post–CAR T-cell infusion; to account for interval censoring, survival probabilities for PFS were generated using the Turnbull estimator with P values from generalized log rank tests.21-23 Univariate and multivariate analysis of OS was performed using Cox regression.
Results
Patient characteristics
A total of 199 patients were identified that met inclusion criteria: 68 patients with DR-LBCL (34%) and 131 patients with NDR-LBCL (66%). Baseline characteristics with regards to median age, sex, Eastern Cooperative Oncology Group performance status (ECOG PS), disease stage and bulk, the presence of MYC and BCL2 and/or BCL6 rearrangement, and extranodal involvement including central nervous system (CNS) disease were not significantly different between the 2 cohorts as shown in Table 1. In the entire study population, the median age was 61 years (range, 20-83); 36% were female and 28% had an ECOG PS of ≥2. The median prior lines of systemic therapy for LBCL were 2 (range, 1-3). A minority of patients received CAR T-cell treatment as second-line therapy for the LBCL component as they had received prior anthracycline-based therapy for the indolent B-cell lymphoma component (n = 28). Histological diagnoses included de novo DLBCL (60%), transformed DLBCL (35%), and primary mediastinal B-cell lymphoma (5%). Indolent histologies that led to large-cell transformation included follicular lymphoma (n = 68) and marginal-zone lymphoma (n = 1). MYC and BCL2 and/or BCL6 translocations were detected in 41 of the 114 patients tested (35.9%). Most patients had stage IV disease (54%). Extranodal involvement of disease was present in 59% of patients, a history of CNS involvement in 7% of patients, and bulky disease (defined as >7 cm) in 42% of patients.24
Patient demographics and baseline clinical characteristics
| Patient characteristics . | Entire cohort N = 199 (%) . | DR cohort N = 68 (%) . | NDR cohort n = 131 (%) . | P value . |
|---|---|---|---|---|
| Groups | .029 | |||
| Proceeded to CAR T-cell infusion | 154 (77) | 46 (68) | 108 (82) | |
| Did not proceed to CAR T-cell infusion | 45 (23) | 22 (32) | 23 (18) | |
| Median age | 61 (20-83) | 60.5 (20-76) | 61 (24-83) | .16 |
| Sex | .58 | |||
| Female | 71 (36) | 22 (32) | 49 (37) | |
| Male | 128 (64) | 46 (68) | 83 (63) | |
| ECOG PS at time of intake | .25 | |||
| 0-1 | 131 (72) | 41 (64) | 90 (76) | |
| 2+ | 51 (28) | 22 (35) | 29 (24) | |
| Missing | 17 | 5 | 12 | |
| Histological subtypes | .20 | |||
| De novo DLCBL | 121 (60) | 48 (70) | 74 (56) | |
| Transformed DLBCL | 69 (35) | 17 (25) | 52 (40) | |
| PMBCL | 9 (5) | 3 (5) | 5 (4) | |
| Stage at initial diagnosis | .08 | |||
| 1-2 | 30 (21) | 8 (17) | 22 (22) | |
| 3 | 37 (25) | 8 (17) | 29 (30) | |
| 4 | 79 (54) | 32 (67) | 47 (48) | |
| Missing | 53 | 20 | 33 | |
| Disease bulk | .23 | |||
| ≤7cm | 111 (58) | 33 (52) | 78 (62) | |
| >7cm | 79 (42) | 31 (48) | 48 (38) | |
| Missing | 9 | 4 | 5 | |
| Presence of extranodal disease | ||||
| Yes | 113 (59) | 36 (56) | 77 (61) | .63 |
| No | 77 (41) | 28 (44) | 49 (39) | |
| Missing | 9 | 4 | 5 | |
| History of CNS involvement | .78 | |||
| Yes | 14 (7) | 4 (6) | 10 (8) | |
| No | 177 (93) | 60 (94) | 117 (92) | |
| Missing | 8 | 4 | 4 | |
| Relapsed and refractory status | ||||
| Primary refractory | 121 (62) | 68 (100) | 53 (44) | <.001 |
| Relapsed | 72 (38) | 0 (0) | 72 (56) | |
| Missing | 6 | 6 | ||
| Median number of lines of prior therapy for LBCL | 2 (1-3) | 2 (2-3) | 2 (1-3) | 1.00 |
| Prior ASCT | <.001 | |||
| Yes | 54 (27) | 0 (0) | 54 (41) | |
| No | 147 (73) | 68 (100) | 77 (59) | |
| Bridging therapy | ||||
| None | 57 (29) | 15 (22) | 42 (33) | .09 |
| Chemotherapy only | 43 (22) | 13 (19) | 30 (23) | |
| Radiotherapy only | 42 (21) | 20 (29) | 22 (17) | |
| Steroids only | 18 (9) | 4 (6) | 14 (11) | |
| Chemotherapy & radiotherapy | 8 (4) | 5 (7) | 3 (2) | |
| Chemotherapy & steroids | 7 (4) | 1 (1) | 6 (5) | |
| Radiotherapy & steroids | 16 (8) | 8 (12) | 8 (6) | |
| Chemotherapy, radiotherapy & steroids | 5 (3) | 2 (3) | 3 (2) | |
| Missing | 3 | 0 | 3 |
PMBCL, primary mediastinal B-cell lymphoma.
The most commonly used frontline anthracycline–based treatment was R-CHOP. All patients that received salvage therapy with intent to ASCT, received GDP (with or without rituximab). No patients in the DR-LBCL cohort had undergone ASCT whereas 41% of the patients with NDR-LBCL were post-ASCT. Bridging therapy was administered in 71% (n = 139) of patients. Modalities of bridging therapy included chemotherapy only (22%, n = 43), radiotherapy only (21%, n = 42), steroids only (9%, n = 18), radiotherapy and steroids (8%, n = 16), chemotherapy and radiotherapy (4%, n = 8), chemotherapy and steroids (4%, n = 7), and chemotherapy, radiotherapy, and steroids (3%, n = 5). There was no statistical difference in the type of bridging therapy used between the 2 cohorts (P = .098), however, the use of radiotherapy (29%, n = 20 vs 17%, n = 22) and radiotherapy in combination with steroids (12%, n = 8 vs 6%, n = 8) were numerically higher in the DR-LBCL cohort. With regards to the CAR T-cell product, axicabtagene ciloleucel was administered in 77% and tisagenlecleucel administered in 23%.
Survival outcomes for the entire study cohort
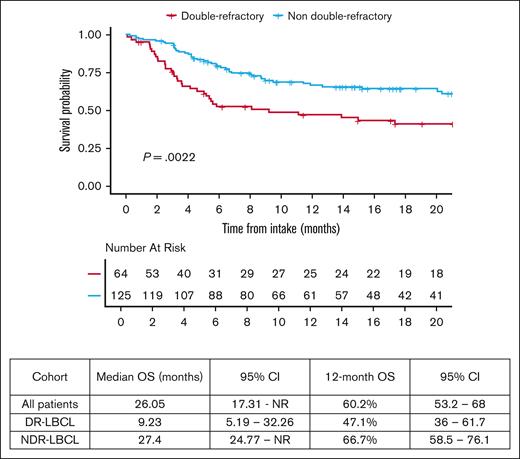
The median follow-up of all patients in the study was 23.6 months from date of hospital intake (95% CI, 17.7-30.6). The 12-month OS from date of intake of the entire study population was 60.2% (95% CI, 53.2-68). OS was significantly lower in patients with DR-LBCL with a 12-month OS of 47.1% (95% CI, 36-61.7) vs 66.7% (95% CI, 58.5-76.1) in the NDR-LBCL cohort, (log rank P = .0022) as shown in Figure 1.
Failure rate to proceed with CAR T-cell infusion
Of the entire study population of 199 patients, 45 (22.6%) were unable to proceed with the intended CAR T-cell infusion. A significantly higher percentage of patients were unable to proceed to CAR T-cell infusion in the DR-LBCL cohort compared to the NDR-LBCL cohort: 32% (n = 22/68) vs 18% (n = 23/131), P = .028.
Out of the total 45 patients that did not proceed to CAR T-cell infusion, 28 patients (62%) underwent apheresis and CAR T-cell manufacturing was attempted in 14 patients (14/45, 31%) of which 4 patients had failure of CAR T-cell manufacture. More patients in the DR-LBCL cohort did not proceed to CAR T-cell infusion despite being apheresed compared to the NDR-LBCL cohort; 82% (n = 18/22) vs 43% (n = 10/23), respectively; P = .013. Among the patients that did not proceed to CAR T-cell infusion, the CAR T-cell manufacturing rates between the 2 cohorts were not significantly different (DR-LBCL 36% [n = 8/22] vs NDR-LBCL 26% [n = 6/23]; P = .27).
The reasons for failure to proceed to CAR T-cell infusion in the DR-LBCL and NDR-LBCL cohorts as shown in Table 2 were rapid disease progression (33%, n = 7 vs 25%, n = 5), disease progression with CNS disease (19%, n = 4 vs 10%, n = 2), poor ECOG PS of ≥3 (14%, n = 3 vs 20%, n = 4), manufacturing failure (10%, n = 2 vs 10%, n = 2), decline due to patient preference (5%, n = 1 vs 20%, n = 4) or death (19%, n = 4 vs 15%, n = 3) (missing details in 4 patients).
Reasons for failure to proceed to CAR T-cell infusion
| Reasons . | Entire cohort (N = 45), n (%) . | DR-LBCL cohort (n = 22), n (%) . | NDR-LBCL cohort (n = 23), n (%) . |
|---|---|---|---|
| Rapid disease progression | 12 (29) | 7 (33) | 5 (25) |
| Disease progression with CNS disease | 6 (15) | 4 (19) | 2 (10) |
| Poor ECOG PS ≥3 | 7 (17) | 3 (14) | 4 (20) |
| Manufacturing failure | 4 (10) | 2 (10) | 2 (10) |
| Decline due to patient preference | 5 (12) | 1 (5) | 4 (20) |
| Death | 7 (17) (n = 1 sepsis, n = 6 PD) | 4 (19) (n = 1 sepsis, n = 3 PD) | 3 (15) (n = 3 PD) |
| Missing | 4 | 1 | 3 |
Survival outcomes for patient subgroups proceeding to and those unable to proceed with CAR T-cell infusion
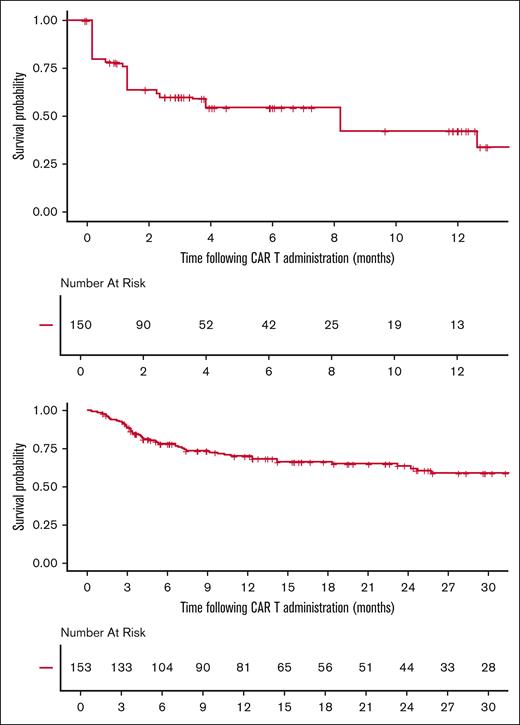
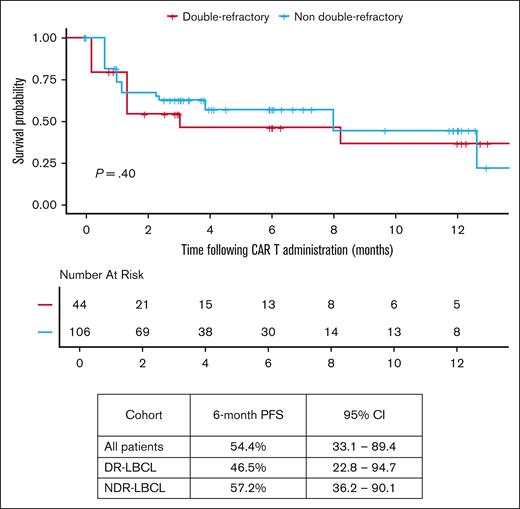
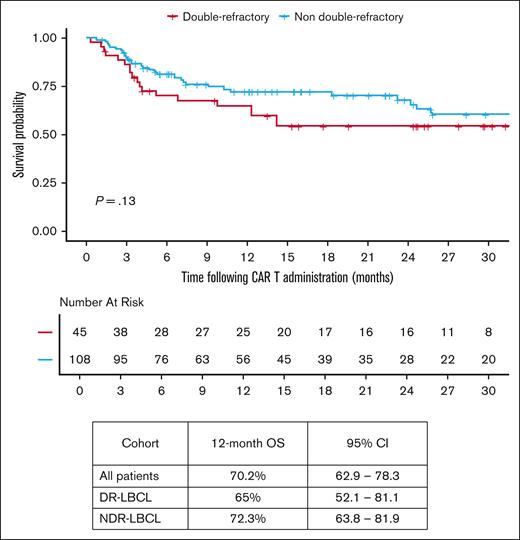
Median follow-up from date of infusion was 22.3 months (95% CI, 16-25.5) among all patients receiving CAR T-cell therapy. The median vein-to-vein time for the DR-LBCL and NDR-LBCL cohorts were 34 days (range, 27-70) and 36 days (range, 27-120), respectively (P = .38). In all patients that proceeded to CAR T-cell infusion, 6-month PFS was 54.4% (95% CI, 33.1-89.4), and 12-month OS was 70.2% (95% CI, 62.9-78.3) as shown in Figure 2. There was no significant difference in PFS and OS between the 2 cohorts when focusing only on those patients that were able to proceed to CAR T-cell infusion as shown in Figures 3 and 4. The 6-month PFS for those that proceeded to CAR T-cell infusion in the DR-LBCL cohort and NDR-LBCL cohorts were 46.5% (95% CI, 22.8-94.7) vs 57.2% (95% CI, 36.2-90.1), respectively (generalized log rank P = .40). The 12-month OS for those that proceeded to CAR T-cell infusion in the DR-LBCL cohort and NDR-LBCL cohorts were 65% (95% CI, 52.1-81.1) vs 72.3% (95% CI, 63.8-81.9), respectively (log rank P = .13).
With regard to toxicity related to CAR T-cell infusion, more patients in the DR-LBCL cohort compared to the NDR-LBCL cohort experienced cytokine release syndrome (n = 40 [95%] vs n = 85 [81%], P = .38) although this was not statistically significant. There was no difference in cytokine release syndrome grade ≥3 events (P = .31). Similarly, there was no difference in immune effector cell–associated neurotoxicity syndrome events between the 2 cohorts (P = .63), including immune effector cell–associated neurotoxicity syndrome grade ≥3 events (P = .28). Requirements for post–CAR T-cell infusion tocilizumab use (P = .11), steroid use (P = .33), intensive care unit admission (P = .22), length of intensive care unit stay (P = .74), and 1-year nonrelapse mortality (P = .68) were similar between the 2 cohorts.
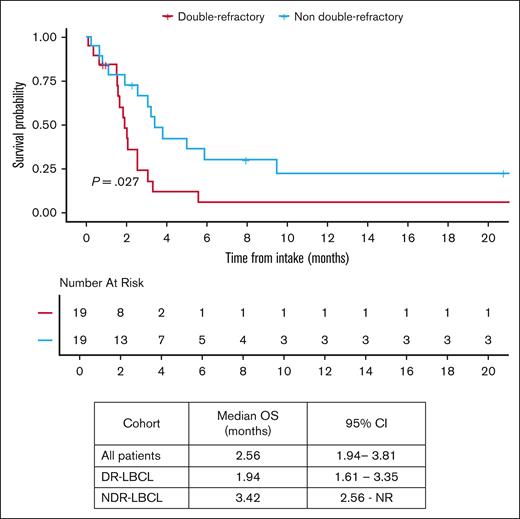
In patients that did not proceed to CAR T-cell infusion, the median OS from intake was 2.56 months (95% CI, 1.94-3.81). OS in patients that did not proceed to CAR T-cell infusion was inferior in the DR-LBCL cohort compared with NDR-LBCL cohort with a median OS of 1.94 months (95% CI, 1.61-3.35) vs 3.42 months (95% CI, 2.56 to NR), respectively (log rank P = .027), as shown in Figure 5. Of the 45 patients that did not proceed to CAR T-cell infusion, 4 patients received chemotherapy, 3 patients received radiation, and 2 patients received a combination of chemoradiation as their next line of therapy. The remainder of patients (n = 36) did not receive alternative treatment and succumbed to their disease. Of note, no patients received bispecific antibody–based treatment.
OS by DR status in patients who did not proceed to CAR T-cell therapy.
Univariate and multivariate analysis as a predictor of OS
Univariable and multivariate analysis found DR status to be associated with inferior OS from date of intake when adjusted for measurable confounders such as age, the presence of MYC and BCL2, and/or BCL6 rearrangement, transformed disease, and disease bulk as shown in Table 3 (adjusted hazard ratio, 1.64; 95% CI, 1.02-2.63; P = .035).
Univariable and multivariate analyses as a predictor of OS
| Variables . | Unadjusted HR (95% CI) . | P value . | Adjusted HR (95% CI) . | P (adj) . |
|---|---|---|---|---|
| DR status | .003 | .035 | ||
| NDR | Reference | Reference | ||
| DR | 1.91 (1.26-2.92) | 1.64 (1.02-2.63) | ||
| Age per 10 years | 1.09 (0.92-1.28) | .33 | 1.16 (0.96-1.41) | .13 |
| Double/triple hit | .14 | .57 | ||
| None | Reference | Reference | ||
| Double/triple hit | 1.61 (1.00-2.60) | .049 | 1.27 (0.76-2.15) | .43 |
| Unknown | 0.96 (0.49-1.89) | .91 | 1.29 (0.63-2.61) | .39 |
| Bulky disease | .12 | .11 | ||
| ≤7 cm | Reference | Reference | ||
| >7 cm | 1.41 (0.91-2.17) | 1.45 (0.91-2.30) | ||
| Transformed disease | 1.00 | .70 | ||
| No | Reference | Reference | ||
| Yes | 1.00 (0.65-1.55) | 1.12 (0.70-1.77) | ||
| Bridging therapy | .39 | .64 | ||
| No bridging | Reference | Reference |
Double/triple hit denotes the presence of MYC and BCL2/BCL6 rearrangement.
adj, adjusted; HR, hazard ratio.
Discussion
DR status in the management of LBCL is not routinely discussed in the literature, but clinicians are frequently faced with this scenario in practice. Primary refractory disease or relapse within 3 months of an anthracycline-based frontline treatment comprises ∼15% of all patients treated with LBCL.25 Approximately 55% of all relapsed refractory LBCL are expected to not achieve a response (complete remission [CR] or partial remission [PR]) to salvage treatment in the second-line setting with platinum-based regimens.15,16 Thus, 10% to 15% of all DLBCL patients will ultimately have DR disease to anthracycline and platinum-based regimens. Retrospective analyses exploring outcomes in primary refractory DLBCL with platinum-based salvage therapy have demonstrated response rate (CR/PR) to first salvage of only ∼25%.20,25 It is understood that these patients are underrepresented in clinical trials given the refractoriness of disease leading to rapid progression or organ dysfunction, which makes both referral to trial centers and enrollment challenging due to the need for typical trial-screening procedures. Similar challenges are encountered in the standard-of-care setting for CAR T-cell therapy given standard workup and referral pathways. Of all the patients with LBCL treated with intent for standard-of-care CAR T-cell therapy as third line and beyond at our institution, 34% had DR disease. Our study population comprised a sizable proportion of patients with well recognized high-risk disease defined by clinical factors including, advanced stage, presence of extra nodal involvement, bulky disease, and the presence of MYC and BCL2, and/or BCL6 rearrangement in 35.9% of those tested. These risk factors were well balanced between the 2 cohorts.
The 6-month PFS and 12-month OS of 54.4% (95% CI, 33.1-89.4) and 60.2% (95% CI, 53.2-68) of the entire study population matches the outcomes of ZUMA-1.8 However, 12-month OS in patients with DR-LBCL is significantly inferior compared to those with NDR-LBCL; 47.1% (95% CI, 36-61.7) vs 66.7% (95% CI, 58.5-76.1), respectively (log rank P = .0022). Univariable and multivariate analysis found only DR status to be a predictor of inferior OS when adjusted for measurable confounders (adjusted hazard ratio, 1.64; 95% CI, 1.02-2.63; P = .035). OS may be driven by the higher percentage of patients unable to proceed to CAR T-cell infusion within the DR-LBCL cohort. If able to proceed to CAR T-cell infusion, our analysis confirms no statistically significant difference in 6-month PFS and 12-month OS between the DR and NDR-LBCL cohorts with a 12-month OS of 65% (95% CI, 52.1-81.1) vs 72.3% (95% CI, 63.8-81.9), respectively (log rank P = .13). Although this may suggest that CAR T-cell therapy has the ability to overcome the adverse prognostic effects of DR status, it is possible that this analysis was statistically underpowered to detect smaller yet clinically meaningful differences in survival; more research is needed to determine whether a difference in OS and PFS is present.
The failure rate to proceed to CAR T-cell infusion in the entire study population was 22.6%, similar to the 20% to 30% rate reported in the JULIET trial and registry data from the United Kingdom when an intent-to-treat cohort was considered.4,12 However, our analysis provides evidence that a significantly higher percentage of patients with DR-LBCL are unable to proceed to the intended CAR T-cell infusion when compared to patients with NDR-LBCL, (32% vs 18%, P = .028). It is well established in RR-DLBCL that failure to get to ASCT is driven by lack of chemosensitive disease. In the setting of CAR T-cell treatment, the failure rate is closely linked with performance status and kinetics of disease progression, which may limit the ability to proceed to apheresis and CAR T-cell infusion. Our analysis also shows that a higher proportion of DR-LBCL patients are unable to be infused with CAR T cells despite having undergone apheresis, predominantly due to disease progression with or without CNS disease highlighting an unmet need in current bridging strategies in this high-risk patient population.
The survival outcomes of patients unable to proceed to CAR T-cell infusion were very poor with a median OS of only 2.56 months (95% CI, 1.94-3.81). This value was more pronounced and significantly worse in the DR-LBCL cohort compared with the NDR-LBCL cohort; median OS of 1.94 months (95% CI, 1.61-3.35) vs 3.42 months (95% CI, 2.56 to NR), respectively (log rank P = .027). There were no patients alive at 6-months in either cohort. Such inferior outcomes clearly highlight a population of unmet need. Early identification of these patients with baseline predictors are necessary and perhaps novel bridging treatments, alternative “off-the-shelf” treatment strategies or even early palliative-care involvement maybe more appropriate in this patient population.
Limitations of our study include the retrospective single-center nature of the analysis in addition to relatively small patient numbers. Additionally, although we report the inferior outcomes in DR-LBCL patients treated with intent for third-line treatment following chemotherapy-based approaches, CAR T-cell therapy in the second-line setting has since been approved and funded in some countries for patients with primary refractory disease or early disease relapse where varying bridging strategies are utilized including platinum-based regimens.26,27 A proportion of these patients will not respond to second-line “bridging” and it would be important to assess if CAR T-cell therapy outcomes in these patients are similar to what we describe in the third-line setting. The key challenge in this high-risk group will be how clinicians will interpret the data from institutional practices and real-world experiences as large prospective or randomized trials have not been conducted in this setting. Additionally, the realization that a group of these patients will ultimately be palliated highlights the potential to over-treat and potentially do harm in certain settings.
Our study highlights a clinically relevant high-risk subgroup of patients with inferior survival in the context of third-line CAR T-cell therapy due to challenges in getting such patients to the CAR T-cell infusion, where the “intent-to-treat” population can be reliably captured. It would be extremely helpful for future studies to capture the “intent to CAR T-cell” population and assess which patients do not benefit from a CAR T-cell approach or require novel bridging strategies. We suspect that there would be a “refractory population” after frontline therapy that will continue to have poor outcomes. More recently, bispecific antibodies in combination with gemcitabine and oxaliplatin or polatuzumab have shown promise in the relapsed refractory setting.28-30 Given the chemorefractory nature of this population, it is possible that similar regimens incorporating bispecific antibodies as bridging therapy may provide better disease control to enable eventual CAR T-cell delivery. Alternatively, it is this high-risk cohort that may most benefit from off-the-shelf allogeneic CAR T cells and needs further investigation. Whether shifting frontline treatment with polatuzumab, bispecific antibodies, CAR T-cell therapy, or measurable residual disease–driven approaches will change outcomes in this high-risk patient subgroup is yet to be determined.
Authorship
Contribution: C.A. and J.K. conceptualized the study; C.A., S.B., R.A., and C.W. were involved in data acquisition; K.H. performed the data analysis; all authors contributed to writing of the manuscript; and J.K. supervised the study.
Conflict-of-interest disclosure: S.B. holds an honorarium and consultancy with Kite/Gilead, Bristol Myers Squibb, and Janssen. A.P. holds an honorarium with Kite/Gilead, AstraZeneca, and AbbVie. R.K. has received research funding to the institution from AbbVie, Acerta, AstraZeneca, Bristol Myers Squibb, and Roche. C.C. holds an honorarium for advisory boards and speaker engagements with Janssen, Gilead, and Novartis. D.R. holds consultancy and stock with Needs Inc. M.C. has received research funding to the institution from Roche and Epizyme and has also received consultation fees from Kite/Gilead. J.K. has received honoraria from AbbVie, Bristol Myers Squibb, Amgen, AstraZeneca, Gilead, Incyte, Janssen, Karyopharm, Merck, Novartis, Pfizer, Roche; has a consultancy or advisory role with AbbVie, Bristol Myers Squibb, Gilead/Kite, Merck, Roche, Seattle Genetics, OmniaBio; and is a member of the data safety monitoring board of Karyopharm. The remaining authors declare no competing financial interests.
Correspondence: John Kuruvilla, Division of Medical Oncology and Hematology, Princess Margaret Cancer Centre, 6-424, 700 University Ave, Toronto M5G 1Z5, Canada; email: john.kuruvilla@uhn.ca.
References
Author notes
Original data are available on request from the corresponding author, John Kuruvilla (john.kuruvilla@uhn.ca).

