Key Points
Live CIC is driven by BTK but not BCL2 inhibitors, and it represents a novel mechanism underlying MRD persistence.
The CXCL12-CXCR4 axis plays a key mechanistic role in live CIC, and targeting CXCR4 may offer a new therapeutic approach to minimize MRD.
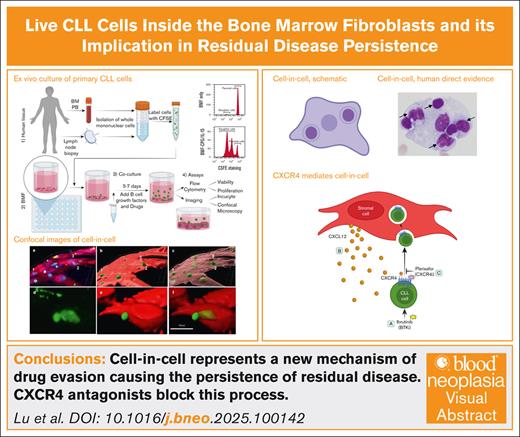
Visual Abstract
Bruton tyrosine kinase inhibitors (BTKis) have been successful in treating B-cell malignancies including chronic lymphocytic leukemia (CLL). However, a deep response to BTK inhibition is uncommon. It is unknown what mechanism results in minimal residual disease (MRD) persistence. Cell-in-cell (CIC) describes the microscopic observations of embodiment of an intact cell by another whole cell. CIC has been sporadically described by pathologists in human fixed tissues for over a century. However, its biological, pathological, and clinical significance remains obscure. In this study, we investigated human primary CLL samples using a clinically faithful ex vivo model system that accurately recapitulates the lymphoma tumor microenvironment. We observed that CLL cells were actively internalized by Bone marrow fibroblasts (BMF) and remained alive and mobile for days. We hypothesized that live CIC may represent a new mechanism for tumor cells to evade therapies and survive as residual disease. Indeed, CIC events were identified directly in the bone marrow of patients being treated with BTKis. Using confocal microscopy, we demonstrated that the ex vivo exposure to BTKi drove CLL cells into BMF. We further showed that CIC inside the BMF were indeed protected from drug-induced apoptosis compared to cells that stayed outside. Mechanistically, we identified that CXCR4 receptor was required for CIC because CXCR4 antagonists and CRISPR-mediated genetic depletion completely abrogated CIC. Altogether, human direct evidence and ex vivo data implicate CIC in disease persistence. Targeting tumor-stroma interaction via CXCR4 inhibition could constitute a new therapeutic approach to minimize MRD and future relapses.
Introduction
Molecular targeted therapies, such as Bruton tyrosine kinase (BTK) and BCL2 apoptosis regulator (BCL2)-directed therapies, have generated remarkable clinical responses in patients with chronic lymphocytic leukemia (CLL) and other mature B-cell malignancies.1-4 BTK inhibitor (BTKi) treatment has been established as a standard-of-care option for CLL in both the frontline and relapsed settings.
With these new advances, the goal of treating CLL has shifted toward reducing residual disease levels, increasing minimal residual disease (MRD) negativity, prolonging remission, and ultimately improving overall survival. MRD negativity has emerged as a new end point for evaluating efficacy of clinical trials of various therapeutic combinations.5,6
Unfortunately, BTKi therapies, such as ibrutinib (ibr), typically generate partial responses, with complete response rates as low as 8% to 11%,7 leaving many patients with detectable residual disease.8 Although resistance mechanisms to ibr have been revealed,9,10 little attention has been paid to disease persistence that precedes the development of resistance.
Cell-in-cell (CIC) is defined by the microscopic observation of an intact cell residing within another whole cell. CIC has been observed in various human cancers, including hepatocellular, breast, non–small cell lung, oral squamous cell, gastrointestinal, and pancreatic carcinomas.11-16 In most types of solid tumors, CIC is associated with tumor aggressiveness, including lymph node metastasis, tumor size and stage, early disease progression, or poor prognosis.
However, little is known about the biological and pathological function of CIC, especially within the hematopoietic system. This knowledge gap is reflected by a recent 2022 case report, which remains descriptive.17
One of the reasons for this gap is the lack of suitable disease models to study slow growing diseases such as CLL. Notably, claimed CLL cell lines, such as MEC1 and MEC2, do not even express CD5, the diagnostic hallmark of CLL, making them unsuitable in vitro models. Moreover, existing animal models only mimic aggressive CLL, failing to represent the vast majority of diseases that are in indolent forms.18 Consequently, most CLL studies rely on primary CLL cells isolated from patients’ peripheral blood (PB). However, these isolated CLL cells do not survive long ex vivo, lack proliferation capability, and undergo spontaneous apoptosis within a few days.19,20
Recognizing this deficiency, we have developed a novel and simple ex vivo model that incorporates the tumor microenvironment (TME).21,22 In this system, primary tumor cells from individual patients are cocultured with a patient-derived bone marrow fibroblasts (BMF) cell line with TME stimuli.21-23 Importantly, when using clinical responses as the gold standard, modeled drug responses align well with individual patient’s clinical responses to ibr: cells from sensitive patients behaved as sensitive in the system, and cells from resistant patients behaved as resistant.21 Thus, the TME system serves as a unique tool that mimics the lymph node TME and faithfully reproduces clinical response.
With this clinically relevant system, we have discovered that live CLL cells are internalized by BMF. Through 3-dimensional imaging and quantitative analysis, we explored the functional significance of CIC phenomenon in >80 patient-derived samples. This is, to our knowledge, the first study to implicate CIC in residual disease persistence.
Methods
Patient samples
A total of 87 CLL samples were used in the study, consisting of 74 ibr-sensitive samples and 13 ibr-resistant CLL samples, as well as 9 follicular lymphoma (FL) samples. Retrospective review of the patients’ body fluids and bone marrow (BM) aspirates was also conducted. Normal B-cell samples were isolated from buffy coats purchased from the American Red Cross National Headquarters. Varying sample identities and numbers were used in different experiments due to sample exhaustion. The research was conducted in accordance with the ethical principles outlined in the Declaration of Helsinki and according to protocols approved by the institutional review boards of Fox Chase Cancer Center and Northwestern University.
See supplemental Materials for more information.
Results
CIC are observed in fixed human lymphoma specimens
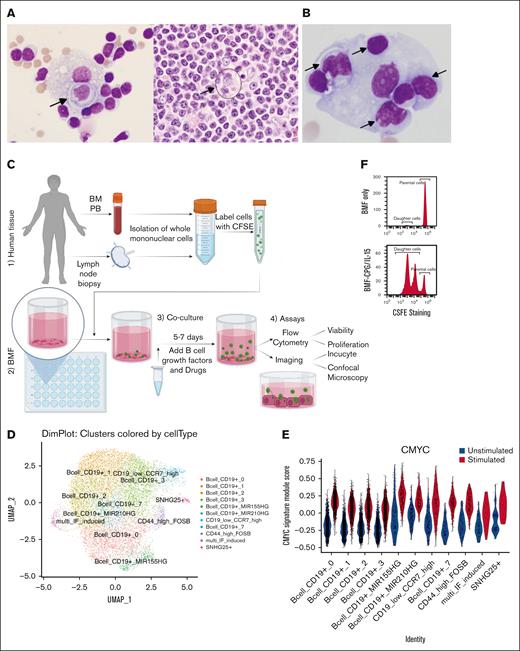
CIC has been sporadically reported in human hematopoietic cancers as case reports, over the last century till very recently,17 and thus, CIC events appear to be “rare.” The actual frequency of CIC occurrence in human specimens remains unknown, let alone its relationship with patient diagnosis, treatment history, and refractoriness to therapies. One reason may arise from the difficulty of recognizing CIC structures in histology sections that are densely packed with cells. Thus, the incidence of CIC may be underappreciated. We circumvented this problem by conducting a systematic review of cytology specimens of malignant body fluids, in which cells are more spaced apart, making CICs easier to identify. We examined 102 specimens of various types of lymphomas, of which 5 showed clear evidence of CIC. Figure 1A shows specimens from a 55-year man with lymphoplasmacytic lymphoma. We initially identified CIC in the pleural effusion fluid (Figure 1A, left panel). With this knowledge, CIC structure was subsequently found in the same patient’s lymph node biopsy (Figure 1A, circle in right panel). Another case involved the pleural effusion from a 57-year-old man with CLL without a nodal biopsy (Figure 1B). It is evident that several lymphocytes are localized within the body of a large histiocyte. In total, the frequency of CIC in our series was ∼5%. Still, the real frequency may be higher because the sampling could have missed the sites where CIC occurs.
CIC in archived human lymphoma samples and TME models. (A) Pleural fluid (left) and lymph node biopsy (right) from a patient with lymphoplasmacytic lymphoma. Note the membrane of the outer cell in the LN biopsy (hard to see but discernable). Arrows highlight the CIC. (B) Pleural fluid from a patient with CLL. (C) Major steps in setting up TME models: (1-2) place collected human tissues with preseeded BMF; (3) add B-cell growth factors such as CpG/IL15 and drugs, coculture for 5 to 7 days or longer; and (4) perform assays with microscopy or flow cytometry. (D) UMAP of single cell genomics showing 11 cell clusters. (E) CLL cells under TME stimuli (CpG/IL-15) display increased MYC signature. (F) Cells divide into daughter cells; BMF only (Top); BMF+CpG/IL-15 (bottom). CFSE, Carboxyfluorescein Succinimidyl Ester; PB, peripheral blood; BM, bone marrow; UMAP, Uniform Manifold Approximation and Projection.
CIC in archived human lymphoma samples and TME models. (A) Pleural fluid (left) and lymph node biopsy (right) from a patient with lymphoplasmacytic lymphoma. Note the membrane of the outer cell in the LN biopsy (hard to see but discernable). Arrows highlight the CIC. (B) Pleural fluid from a patient with CLL. (C) Major steps in setting up TME models: (1-2) place collected human tissues with preseeded BMF; (3) add B-cell growth factors such as CpG/IL15 and drugs, coculture for 5 to 7 days or longer; and (4) perform assays with microscopy or flow cytometry. (D) UMAP of single cell genomics showing 11 cell clusters. (E) CLL cells under TME stimuli (CpG/IL-15) display increased MYC signature. (F) Cells divide into daughter cells; BMF only (Top); BMF+CpG/IL-15 (bottom). CFSE, Carboxyfluorescein Succinimidyl Ester; PB, peripheral blood; BM, bone marrow; UMAP, Uniform Manifold Approximation and Projection.
Live CLL cells are internalized by BMF cells
Moving beyond fixed specimens, we next explored whether CIC can be observed live. As mentioned, our laboratory recently developed a clinically relevant TME model that mimics the lymph node (LN) microenvironment of CLL.21,22 The procedures for establishing the model are outlined in Figure 1C, and each model represents a unique individual tumor. In this system, primary CLL cells form clusters, survive for weeks, and undergo cell division to produce daughter cells.21 Additionally, the CLL cells exhibit characteristics typical of lymph node–resident CLL cells, including larger cell size and reduced surface CXCR4 expression.21 Single-cell RNA sequencing analyses showed increased MYC and E2F gene signatures and decreased CXCR4 expression (Figure 1D-E; supplemental Figure 1A-D for gene signatures and gene expression profiles). Importantly, tumor cells divide and proliferate (Figure 1F), which recapitulates one of the salient features of CLL cells residing in the histologically defined “proliferation centers” in LNs.
Under light microscopy, we observed “pseudoemperiopolesis,” described previously as a phenomenon in which CLL cells migrate underneath the stromal cells in coculture.24,25 To characterize the phenomenon in 3-dimension, we used high-resolution confocal microscopy, which revealed an intriguing cellular behavior: live CLL cells penetrating the bodies of BMF. Under 40× oil lens, when BMF layers were viewed alone, many vacuole-like “holes” were observed in the BMF cytoplasm, which the tumor cells occupied (Figure 2A, left vs right panels, color-paired arrows). At a closer look, it is evident that the CLL cells (green) were completely or partially embedded within the BMF (red), giving a “nutty chocolate” appearance (Figure 2Ba,b). When comparing “solid red” BMF surface with “transparent pink” BMF surface images (Figure 2Bb,c), it is apparent that some cells reside outside the BMF (cell 1; Figure 2Bb,c), whereas others are halfway in (cell 2), and the rest are completely embedded (cell 3; Figure 2Ba-c). Figure 2Bd-f captured 1 CLL cell that was halfway in the process.
Fixed confocal images of CIC structures. Images are acquired with Leica TCS SP8 FSU laser scanning confocal microscope using a 40× oil lens. CLL cells cytoplasm are labeled in green and the BMF cytoplasm in red. (A) Vacuole-like holes are present in the cytoplasm of BMF (a), where they are occupied by CLL cells (b). Comparison white to white and yellow to yellow arrows in panel Aa-b. Bar = 30 um. (B) Two-dimensional (2D) images with green tumor cells, red BMF, and the nuclei of BMF and CLL are in blue (a); 3D images reconstructed using Imaris v10.0.; BMF cells are visualized as the red surfaces and CLL cells as the green surfaces (b); red surfaces are transformed to a transparent state (c); the entry process (d-f). (C) Time-lapsed microscopy showing CLL cells are internalized, remain viable, and move within the BMF. BMF are visualized as either red or transparent pink and CLL cells as the green surfaces (scale bar, 20 μm); track cell 1, 2, and 3 through (a-c); and compare solid images (a-c) with the corresponding transparent images (d-f).
Fixed confocal images of CIC structures. Images are acquired with Leica TCS SP8 FSU laser scanning confocal microscope using a 40× oil lens. CLL cells cytoplasm are labeled in green and the BMF cytoplasm in red. (A) Vacuole-like holes are present in the cytoplasm of BMF (a), where they are occupied by CLL cells (b). Comparison white to white and yellow to yellow arrows in panel Aa-b. Bar = 30 um. (B) Two-dimensional (2D) images with green tumor cells, red BMF, and the nuclei of BMF and CLL are in blue (a); 3D images reconstructed using Imaris v10.0.; BMF cells are visualized as the red surfaces and CLL cells as the green surfaces (b); red surfaces are transformed to a transparent state (c); the entry process (d-f). (C) Time-lapsed microscopy showing CLL cells are internalized, remain viable, and move within the BMF. BMF are visualized as either red or transparent pink and CLL cells as the green surfaces (scale bar, 20 μm); track cell 1, 2, and 3 through (a-c); and compare solid images (a-c) with the corresponding transparent images (d-f).
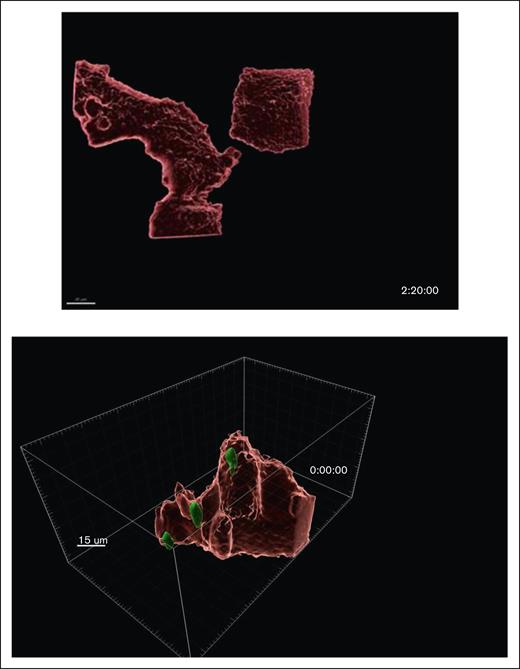
To determine whether the internalized CLL cells were viable and mobile within the BMF, we performed time-lapsed confocal microscopy. Figure 2C provides snapshots from a movie, with CLL and BMF shown as either solid red (top panels) or transparent pink surfaces (bottom). It became apparent that “cell 1” moved into the BMF body between 7 hours 50 minutes and 8 hours 2 minutes (also compare top to bottom images). “Cell 2” remained inside during this time, whereas “cell 3” moved out of the capture area. Real-time movies showed that CLL cells were actively taken in by BMF, and internalized cells were moving inside the BMF, independent of the movement of BMF throughout the 17-hour recording (Figure 3). An additional washout experiment that removed CLL cells outside the BMF bodies showed that internalized CLL cells could re-emerge outside the BMF even after 48 hours (supplemental Figure 2). Furthermore, we validated live CIC in NKTert, a BM stromal cell line of a different origin (supplemental Figure 3), suggesting that the phenomenon is not restricted to any specific human BM stromal cells.
CLL cells were internalized by BMF and displayed active within-BMF movements. Time-lapsed microscopy showing the live dynamic process of CIC. Time-lapse live cell imaging was acquired on Leica SP8 TCS laser scanning confocal microscope equipped with an incubator for temperature, humidity and CO2 control. Two fields were captured with z-stack of 0.5 μm/slice and a total of 10 slices at original magnification ×20 magnification and 2 minutes interval for 17 hours. Two movies are included. Suggestion is to play movies slowly: click play then pause, then click along the progression bar, and follow 1 cell at a time through different movie frames.
CLL cells were internalized by BMF and displayed active within-BMF movements. Time-lapsed microscopy showing the live dynamic process of CIC. Time-lapse live cell imaging was acquired on Leica SP8 TCS laser scanning confocal microscope equipped with an incubator for temperature, humidity and CO2 control. Two fields were captured with z-stack of 0.5 μm/slice and a total of 10 slices at original magnification ×20 magnification and 2 minutes interval for 17 hours. Two movies are included. Suggestion is to play movies slowly: click play then pause, then click along the progression bar, and follow 1 cell at a time through different movie frames.
Altogether, we not only demonstrated the existence of CIC in unmanipulated fixed patient samples but also established a TME model system to view the live dynamic process in which CLL cells actively enter, move within, stay alive, and exit BMF cells intact (Figure 3). The observed process is distinct from phagocytosis in which cells are typically destroyed within a short time window of 10 to 60 minutes.26,27
Increased CIC is associated with prior therapies
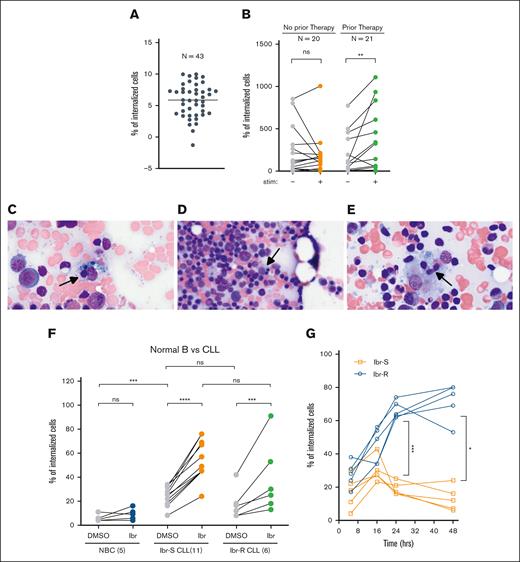
To decipher what this phenomenon means, we started by investigating clinical or pathological associations. We first quantified CIC instances in a cohort of 43 CLL samples using Imaris software. Internalization was observed in all 43 samples, although the CIC numbers varied from case to case (Figure 4A). No correlation was noted between CIC and established CLL prognostic indicators, such as IGHV mutation status, or cytogenetic abnormalities, including del(17p) (supplemental Figure 4). Nonetheless, under the stimulated TME condition (BMF+CpG/IL15), samples from treated patients showed a more pronounced increase in CIC than untreated patients (Figure 4B). The finding, although of an association nature, provides, to our knowledge, the first hint that CIC may be promoted by drug therapy.
CIC is associated with prior therapies, increases with in vivo BTKi therapy and ex vivo ibr exposure. (A) Number of internalized cells were quantified for 43 CLL cases. Four to 6 fields were examined per sample. Each dot represents the average number of CIC per field per sample of 4 to 6 fields. Data are plotted on a log2 scale to accommodate the large variations from case to case. In one case, CIC was found in 1 of 6 fields examined, the average value is <1 and the log value is <0. (B) The number of internalized CLL cells in the presence or absence of TME stimuli, IL-15/CpG, and CD40L; 20 cases of untreated CLL (left); ns (P = .322); 21 cases of treated CLL (right); ∗∗P = .011 (analyzed by the Wilcoxson test). (C-E) CIC identified in the BM aspirates from patients on BTKi therapy (n = 3). (F) Upon ibr exposure, CIC is not changed in NBCs (n = 5), increased in sensitive CLL (Ibr-S; n = 11) and increased in resistant CLL (Ibr-R; n = 6). Cells were treated ex vivo with 0.4-μM ibr for 5 hours. Also see images in supplemental Figure 5. (G) Time course of CIC in both Ibr-S (orange; n = 5) and Ibr-R cells (blue; n = 5). Also see images in supplemental Figure 7. ∗P = .02; ∗∗∗P = .001. Ibr-R, ibr-resistant cases; Ibr-S, ibr-sensitive cases; ns, not significant.
CIC is associated with prior therapies, increases with in vivo BTKi therapy and ex vivo ibr exposure. (A) Number of internalized cells were quantified for 43 CLL cases. Four to 6 fields were examined per sample. Each dot represents the average number of CIC per field per sample of 4 to 6 fields. Data are plotted on a log2 scale to accommodate the large variations from case to case. In one case, CIC was found in 1 of 6 fields examined, the average value is <1 and the log value is <0. (B) The number of internalized CLL cells in the presence or absence of TME stimuli, IL-15/CpG, and CD40L; 20 cases of untreated CLL (left); ns (P = .322); 21 cases of treated CLL (right); ∗∗P = .011 (analyzed by the Wilcoxson test). (C-E) CIC identified in the BM aspirates from patients on BTKi therapy (n = 3). (F) Upon ibr exposure, CIC is not changed in NBCs (n = 5), increased in sensitive CLL (Ibr-S; n = 11) and increased in resistant CLL (Ibr-R; n = 6). Cells were treated ex vivo with 0.4-μM ibr for 5 hours. Also see images in supplemental Figure 5. (G) Time course of CIC in both Ibr-S (orange; n = 5) and Ibr-R cells (blue; n = 5). Also see images in supplemental Figure 7. ∗P = .02; ∗∗∗P = .001. Ibr-R, ibr-resistant cases; Ibr-S, ibr-sensitive cases; ns, not significant.
Increased CIC frequencies are found in patients treated with BTKi
To investigate whether drug treatment triggers CIC, we chose to concentrate on patients treated with BTKi (patient information in supplemental Table 1), who have a high rate of residual disease in the form of partial response (∼90%).7 We suspected that CIC phenomena might underlie continued disease persistence. We collected 11 BM aspirates from patients receiving BTKis (including ibr, acalabrutinib, and pirtobrutinib [pirto]). Among these, 6 (55%) exhibited evidence of CIC (Figure 4C-E), compared to a 5% frequency of CIC observed in our retrospective study of unselected patients (Figure 1A-B). These findings support the hypothesis that CIC underlies the problem of residual disease with BTKi therapies: CLL cells “hide” inside BMF to evade drug attacks.
CIC increases with ex vivo ibr exposure in CLL
After obtaining direct human evidence showing CIC is relevant for both lymphoma and CLL, we further studied CIC using the TME system, in which live cells can be examined. To determine whether drug exposure promotes CIC, we treated CLL cells with either dimethyl sulfoxide (DMSO) or the BTKi ibr at a clinically achievable concentration of 0.4 μM.28Figure 4F shows that normal B cells (NBCs) treated with DMSO also got internalized by the BMF but at a significantly lower level than CLL cells (compared gray dots to gray dots). Notably, when NBCs were treated with ibr, CIC events did not change compared to vehicle control (blue dots). In contrast, when CLL cells were treated with ibr, a significantly greater number of cells got internalized by BMF (Ibr-S CLL, orange dots, confocal images in supplemental Figure 5). Notably, ibr did not alter BMF viability within the 0- to 2-μM range (supplemental Figure 6).
We also studied whether the CIC behavior is related to the clinical ibr-resistance status. Approximately 15% to 20% ibr-treated patients relapse within 18 to 36 months, and most of these (∼80%) acquire BTK and/or PLCG2 mutations.3,29 Six mutant samples were evaluated (samples herein are ibr sensitive unless specified as ibr resistant; see supplemental Table 2 for patient information). No statistical differences in CIC occurrences were detected at early time points between the resistant and sensitive groups (Figure 4F, green to orange dots). We next performed a time course that revealed that over a longer period, a significantly higher number of resistant cells (N = 5) are found within BMF than sensitive cells (N = 5; Figure 4G, blue vs orange; P = .001, at 24 hours; see images in supplemental Figure 7). The results suggest that the resistant cells have an increased capacity to persist. Collectively, both human direct evidence and ex vivo data demonstrated CIC is promoted by ibr, and ibr-resistant cells stay longer within BMF. Additionally, these experiments suggest persistence and resistance are related but separate processes.
CIC increases with ex vivo ibr exposure in FL
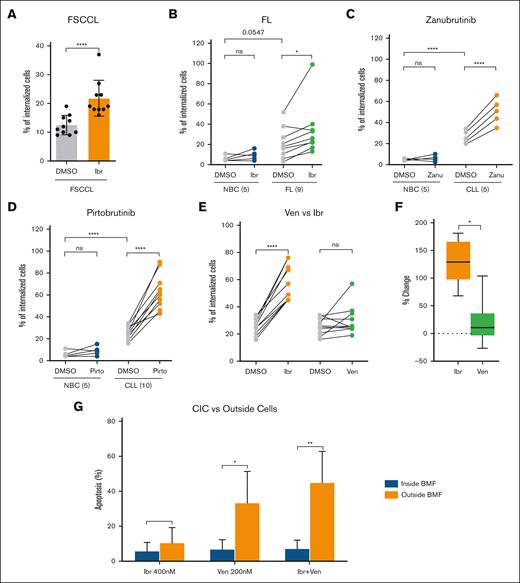
Because little is known about CIC, one of the foremost questions is whether live CIC can be found in other B-cell lymphomas. We investigated FL, another indolent lymphoma. In the FL cell line WSU-FSCCL, CIC events also increased in response to ibr (Figure 5A, all cell line data presented as bar graphs). Furthermore, in primary FL, CIC also occurred and further increased when cells were exposed to ibr (Figure 5B, green dots; n = 9; also see supplemental Figure 8). Thus, the CIC phenomenon is not confined to CLL and may represent a common cellular mechanism for lymphoma cells to escape and endure therapy.
CIC in FL and CIC responses to BTKis and ven. (A) CIC in FSCCL cell line. Each dot represents 1 experiment. Ten repeat experiments are shown. (B) CIC increased with ex vivo ibr exposure in FL primary samples (n = 9). Cells were treated ex vivo with 0.4 μM for 5 hours. Each dot represents a case. Data were analyzed with paired, parametric, 2-tailed t test. (C) CIC increased upon exposure to the covalent BTKi zanu in CLL (n = 5). (D) CIC increased upon exposure to the noncovalent BTKi pirto in CLL (n = 10). (E) CIC in ven- vs ibr-treated cells (n = 10). Cells were treated for 5 hours. (F) Percentage of changes based on data in panel C: percent change = (drug – DMSO)/DMSO × 100%. Data were analyzed with paired, parametric, 2-tailed t test. (G) Apoptosis rate of CLL cells inside vs outside of BMF. Cells were treated with ibr (0.4 μM), Acala (0.5 μM), ven (0.2 μM), or ibr+ven for 8 hours. FLICA-positive cells were counted using confocal imaging, and 5 fields per condition per experiment were analyzed. Apoptosis rates were calculated as follows: apoptotic CIC/total CIC × 100% or apoptotic outside cells/total outside cells × 100%. Error bars represent the standard deviation of 3 independent experiments.
CIC in FL and CIC responses to BTKis and ven. (A) CIC in FSCCL cell line. Each dot represents 1 experiment. Ten repeat experiments are shown. (B) CIC increased with ex vivo ibr exposure in FL primary samples (n = 9). Cells were treated ex vivo with 0.4 μM for 5 hours. Each dot represents a case. Data were analyzed with paired, parametric, 2-tailed t test. (C) CIC increased upon exposure to the covalent BTKi zanu in CLL (n = 5). (D) CIC increased upon exposure to the noncovalent BTKi pirto in CLL (n = 10). (E) CIC in ven- vs ibr-treated cells (n = 10). Cells were treated for 5 hours. (F) Percentage of changes based on data in panel C: percent change = (drug – DMSO)/DMSO × 100%. Data were analyzed with paired, parametric, 2-tailed t test. (G) Apoptosis rate of CLL cells inside vs outside of BMF. Cells were treated with ibr (0.4 μM), Acala (0.5 μM), ven (0.2 μM), or ibr+ven for 8 hours. FLICA-positive cells were counted using confocal imaging, and 5 fields per condition per experiment were analyzed. Apoptosis rates were calculated as follows: apoptotic CIC/total CIC × 100% or apoptotic outside cells/total outside cells × 100%. Error bars represent the standard deviation of 3 independent experiments.
CIC is driven by BTKi but not BCL2i
Next, we asked whether lymphoma drugs of different classes or subclasses would similarly augment CIC. After ibr, the first-in-class covalent BTKi, several new BTKis have been developed, including the covalent zanubrutinib (zanu) and the noncovalent pirto. As a class, BTKis have poor capability to clear tumor cells, and most responses are partial with the majority of patients living with residual disease.7 In addition to BTKis, another effective small-molecule drug is venetoclax (ven), a BCL2 inhibitor (BCL2i) that specifically targets BCL2, causing direct apoptotic death of tumor cells and deeper clinical response, with higher rate of MRD negativity.
Because primary samples have finite cell numbers, we took precautions to test only concentrations that represent the average plasma concentrations determined by pharmacokinetic studies under standard dosing, such as 0.4 μM for ibr, 0.2 μM for zanu, and 15 μM for pirto.28,30,31 Similar to ibr, CIC events increased in cells treated with either zanu or pirto compared to DMSO (Figure 5C-D), demonstrating a class effect regardless of the covalency nature.
We next tested the BCL2i ven at a clinical achievable concentration of 0.2 μM (no effect on the viability of the BMF; supplemental Figure 9). In contrast to ibr, ven did not significantly increase CIC, with some variability among individuals (Figure 5E, green vs gray; not significant). The average increase of ibr-driven CIC was 134.5% (range, 68%-181%), whereas the average CIC increase in ven-treated cells was significantly lower at 38% (range, −26% to 104%; Figure 5F). These findings reveal a class difference between the BCL2i and BTKi. Notably, these laboratory findings align well with the clinical observations that MRD positivity is much more common with BTKi than BCL2i.5,32
CIC inside BMF are protected from drug-induced cell death
We next asked whether CIC are protected from the drug-induced tumor cell killing. We compared the apoptosis rate of CLL cells inside vs outside of BMF. Cocultures were subject to treatment of single ibr, single ven, or ibr plus ven combination. The apoptosis was assayed using Fluorochrome-Labeled Inhibitors of CAspases assay (FLICA) caspase detection method, because FLICA is plasma membrane permeable, allowing for apoptotic CLL cells inside BMF to be readily identified via confocal imaging. Regarding outside cells, the results (Figure 5G, orange bars) show that ven single treatment delivered more potent apoptosis induction than ibr alone, and combination was the most effective. These findings are entirely consistent with our previous drug response data of cell bulks (without differentiating inside vs outside cells),21 validating the FLICA approach. More importantly, apoptosis of inside CIC stayed low while that of outside cells was significantly higher (Figure 5G, blue vs orange bars). Mean value of apoptosis rate was 5.8% vs 10.6% for ibr, 6.9% vs 33.6% for ven, and 7.3% vs 45.0% for the combination, respectively. Moreover, of all apoptotic cells across all treatments, they are more likely to be distributed outside of BMF than inside of BMF (supplemental Figure 10). Taken together, these data demonstrated that CIC inside BMF were protected from drug-induced cell death.
Molecular determinants of CIC in the TME system
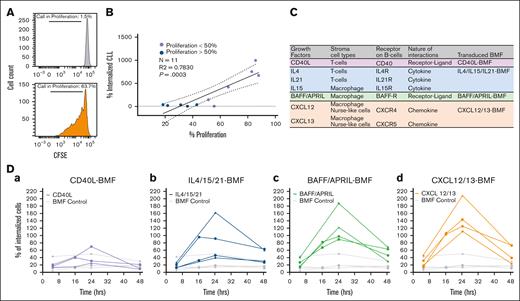
Our next objective was to identify the mechanism by which BTKis drive CIC. The occurrence of CIC depends on the microenvironment, which provides tumor cells with signals for survival and proliferation.33 We first examined whether cell internalization depends on tumor cell proliferation within the TME system. Proliferation by carboxyfluorescein succinimidyl ester staining (Carboxyfluorescein Succinimidyl Ester, Figure 6A) revealed a strong positive correlation between tumor cell internalization and cell proliferation (n = 11; Figure 6B; R2 = 0.78; P = .0003).
Molecular determinants of CIC in the TME system. (A) Cell proliferation determined by the CFSE assay; cells cultured with BMF only (left); cells cultured with BMF and TME stimuli CpG+IL-15 (right). The percentage of cell in proliferation are calculated as follows: percent proliferation = daughter/(daughter + parental) × 100%. (B) The correlation between CLL cell proliferation (as quantitated by CSFE) and cell internalization. R2 and P value for simple linear regression are indicated. Blue circles represent samples with proliferation <50%; purple circles represent samples with proliferation >50%. Solid line is best fit line, and dotted lines are the 95% confidence intervals. (C) Table listing known ligand-receptor interactions and/or soluble factors in the TME. The last column indicates the types of transduced BMF created with lentiviral transduction. (D) Effects of CM from transduced BMF on CIC over time. Each line with different symbols represents a different patient sample.
Molecular determinants of CIC in the TME system. (A) Cell proliferation determined by the CFSE assay; cells cultured with BMF only (left); cells cultured with BMF and TME stimuli CpG+IL-15 (right). The percentage of cell in proliferation are calculated as follows: percent proliferation = daughter/(daughter + parental) × 100%. (B) The correlation between CLL cell proliferation (as quantitated by CSFE) and cell internalization. R2 and P value for simple linear regression are indicated. Blue circles represent samples with proliferation <50%; purple circles represent samples with proliferation >50%. Solid line is best fit line, and dotted lines are the 95% confidence intervals. (C) Table listing known ligand-receptor interactions and/or soluble factors in the TME. The last column indicates the types of transduced BMF created with lentiviral transduction. (D) Effects of CM from transduced BMF on CIC over time. Each line with different symbols represents a different patient sample.
Various ligand-receptor interactions and/or soluble factors in the TME are known to promote tumor proliferation (listed in Figure 6C). Stromal cells that help promote cell proliferation may be involved in the CIC process. To mimic different cell types, such as T cells and macrophages, we engineered BMF cells to express CD40L, cytokines (interleukin-4 [IL4], IL-21, and IL-15), BAFF/APRIL, and chemokines (CXCL12-CXCL13) using lentiviral transduction (Figure 6C, last column). We then explored the impact of conditioned media (CM) from each of these BMFs on the CIC instances. Figure 6D shows that CM from CD40L-transduced BMF (CD40L-BMF) had little effect on CIC compared with the untransduced BMF (Figure 6Da, purple vs gray). CM from IL-4/15/21 BMF promoted CIC in 2 of 4 cases (Figure 6Db, blue vs gray), whereas CM from BAFF/APRIL BMF and CXCL12/13 BMF promoted CIC in all 4 cases (Figure 6Dc,d).
CXCR4 surface expression correlates with CIC under baseline and drug treatment conditions
We then prioritized the chemokine axis CXCL12-CXCR4 for further investigation for several reasons. Firstly, CLL cells express higher levels of CXCR4, and the receptor mediates CLL “spontaneous migration beneath mouse BM stromal cells.”24,34,35 We suspect this 1999 low-resolution light microscopy observation may correspond to the CIC phenomenon we now see using high-resolution confocal microscopy. Secondly, CXCL12 is crucial because it is secreted by several different cell types in the TME including BM stromal cells36 (Figure 6C). Finally, highly specific CXCR4 antagonists, plerixafor (pleri) and motixafortide (motix), are already clinically available for stem cell mobilization,37 which may be repurposed.
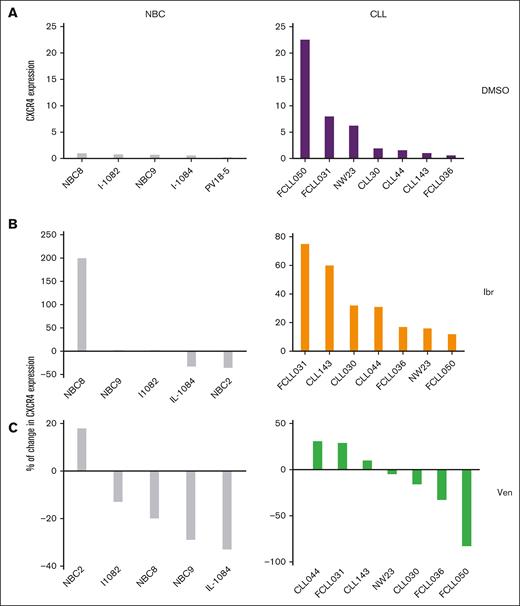
In Figure 4F, we noted that under untreated condition (DMSO), CLL displayed higher levels of CIC than NBCs (Figure 4F left, gray dots to gray dots). We questioned whether this difference between CLL and NBCs can be explained by the levels of their CXCR4 expression. Indeed, flow cytometry analysis revealed that CXCR4 expression on CLL was higher than NBCs (Figure 7A, left vs right). We then determined the effect of ibr or ven treatment on CXCR4 expression. It is apparent that ibr treatment uniformly increased CXCR4 in all cases of CLL, whereas changes were random in NBC cases (Figure 7B, left vs right). Notably, CLL CXCR4 response to ven was also random (Figure 7C, right; see CXCR4 percentage changes by individual in supplemental Figure 11) and correlates with their random CIC response to the drug (Figure 5E).
Cell surface expression of CXCR4 in NBC and CLL. NBC and CLL cells were cocultured with BMF+CpG/IL-15 and treated with DMSO, 0.4-μM ibr, or 0.2-μM ven for 96 hours. Surface CXCR4 expression was determined by flow cytometry. Expression of CXCR4 of each sample was normalized to that of FSCCL cell line, which was included as a standard in each run. Percentage of change is defined as drug-DMSO/DMSO × 100%.
Cell surface expression of CXCR4 in NBC and CLL. NBC and CLL cells were cocultured with BMF+CpG/IL-15 and treated with DMSO, 0.4-μM ibr, or 0.2-μM ven for 96 hours. Surface CXCR4 expression was determined by flow cytometry. Expression of CXCR4 of each sample was normalized to that of FSCCL cell line, which was included as a standard in each run. Percentage of change is defined as drug-DMSO/DMSO × 100%.
We also examined the surface CXCR4 levels of ibr-sensitive and ibr-resistant samples after ibr treatment (supplemental Figure 12). The results, however, are inclusive regarding whether there are any differences between the sensitive and resistant cases, requiring further studies of additional samples.
Altogether, CLL has higher baseline CXCR4 expression than NBCs. Moreover, Ibr treatment consistently increases this expression, whereas ven does not. The directions of the CXCR4 changes correlate well with that of CIC events (Figures 4F and 5E), supporting the notion that CXCR4 may play a role in mediating CIC.
CXCR4 inhibition and CRISPR depletion block ibr-driven CIC
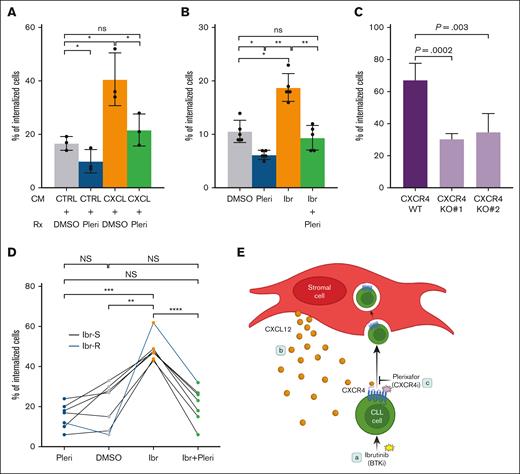
We then ask whether CXCR4 inhibition or depletion blocks CIC. We first tested whether chemokine CXCL12-induced CIC can be prevented by the CXCR4 antagonist pleri. Renewable FSCCL cells were incubated with CM from either control BMF or CXCL12/13 BMF. The coculture was then treated with DMSO or pleri at a clinically achievable concentration of 1 μM38 (Figure 8). CM from CXCL12/13 BMF significantly increased the number of CIC compared to control CM (orange vs gray columns). Notably, pleri reduced this stimulation back to the control level (green vs orange vs gray). Pleri also decreased the baseline CIC in the coculture receiving control CM (blue vs gray).
Pleri antagonizes chemokine-induced and ibr-driven cell internalization. (A) Labeled FSCCL cells were treated with CM and pleri or DMSO as indicated for 24 hours; CXCL, CM from CXCL12/13-BMF; Ctrl, CM from untransduced BMF. Pleri was added at 1 μM, and CIC counting was conducted at 24 hours after the CM/drug addition. Each of 3 experiments was represented by 1 dot. Data were analyzed with paired, parametric, 2-tailed t test. (B) FSCCL cells were treated as indicated in the absence of CM. Ibr was added at 0.4 μM and Pleri at 1 μM. CIC counting was conducted 24 hours after the drug addition. Each of 5 experiments was represented by 1 dot. (C) CXCR4 in FSCCL cells were knocked out using gRNA1 (KO1) and gRNA2 (KO2). CIC counting conducted was conducted at 5 hour after coculture. (D) Primary CLL cells (n = 7) were treated similarly to the cell line. Each dot represents a sample; black lines represent ibr-sentive sample; blueline, ibr-resistant sample. Data were analyzed with paired, parametric, 2-tailed t test. (E) Cartoon that summarized our key findings; (a) shows ibr driving CLL cells into BM fibroblasts (CIC); (b), the chemokine CXCR4-CXCL12 axis mediates this process; (c), the CXCR4 antagonist pleri blocks ibr-driven CIC. Ctrl, control.
Pleri antagonizes chemokine-induced and ibr-driven cell internalization. (A) Labeled FSCCL cells were treated with CM and pleri or DMSO as indicated for 24 hours; CXCL, CM from CXCL12/13-BMF; Ctrl, CM from untransduced BMF. Pleri was added at 1 μM, and CIC counting was conducted at 24 hours after the CM/drug addition. Each of 3 experiments was represented by 1 dot. Data were analyzed with paired, parametric, 2-tailed t test. (B) FSCCL cells were treated as indicated in the absence of CM. Ibr was added at 0.4 μM and Pleri at 1 μM. CIC counting was conducted 24 hours after the drug addition. Each of 5 experiments was represented by 1 dot. (C) CXCR4 in FSCCL cells were knocked out using gRNA1 (KO1) and gRNA2 (KO2). CIC counting conducted was conducted at 5 hour after coculture. (D) Primary CLL cells (n = 7) were treated similarly to the cell line. Each dot represents a sample; black lines represent ibr-sentive sample; blueline, ibr-resistant sample. Data were analyzed with paired, parametric, 2-tailed t test. (E) Cartoon that summarized our key findings; (a) shows ibr driving CLL cells into BM fibroblasts (CIC); (b), the chemokine CXCR4-CXCL12 axis mediates this process; (c), the CXCR4 antagonist pleri blocks ibr-driven CIC. Ctrl, control.
We then questioned whether pleri treatment blocks ibr-driven CIC besides chemokine-induced CIC. In FSCCL cells, ibr exposure caused an increase in CIC events (Figure 8B, orange vs gray). Pleri, by itself, reduced the CIC counts (blue vs gray). Importantly, addition of pleri to ibr completely abrogated ibr-driven CIC (green vs orange vs gray). Of note, pleri, on its own, did not alter BMF viability (supplemental Figure 13). Importantly, the effect of CIC blockade was further corroborated with a second CXCR4 antagonist, motix (supplemental Figure 14).
To provide genetic evidence, we then knocked out CXCR4 in FSCCL cells via CRISPR-Cas9 approach. In cells depleted with 2 different guiding RNAs (knock-out 1 [KO1] and KO2), CIC events were significantly reduced (Figure 8C; supplemental Figure 15) compared to cells that received mock guide RNA (gRNA) (wild type), providing definitive evidence that the CXCL12-CXCR4 axis plays a pivotal role in mediating CIC.
Lastly, we examined the ability of pleri to block CIC in primary CLL specimens, including 6 ibr-sensitive and 1 ibr-resistant sample. Figure 8D shows that exposure to ibr increased CIC (orange vs gray dots), whereas pleri alone did not significantly affect CIC (blue vs gray dots). The addition of pleri completely abolished ibr-induced cell internalization (green vs orange vs gray dots). Notably, the resistant sample responded in a similar way to the sensitive samples (blue line), although ibr-induced CIC seemed to be higher in this sample.
Altogether, these findings underscore the essential role CXCL12-CXCR4 in mediating CIC and demonstrate that experimental blockade of this signaling axis can prevent ibr-induced CIC in both cell line and primary tumors.
Discussion
Frequency of MRD negativity with BTKis is low. What accounts for rarity of deep response and disease persistence is not well understood. Using our CLL-TME ex vivo model, we uncovered the role of CIC in disease persistence. With 102 cytology specimens, the frequency of CIC is ∼5%. The numbers of CIC were generally higher in patients who received prior therapies. Importantly, with 11 BM aspirates from BTKi-treated patients, 55% showed microscopic evidence of CIC. The CIC process remains dynamic over an extended period distinguishing it from phagocytosis. Ibr exposure drove both ibr-sensitive and ibr-resistant CLL cells but not NBCs into the BMF. FL cells are internalized as well as CLL. CIC is specific to the class of BTKi, but BCL2i does not affect CIC. Importantly, cells hiding inside are protected from drug-induced death. Mechanistically, CXCR4 plays an important role in mediating CIC. (8) Both antagonism and depletion of CXCR4 abrogated ibr-driven CIC. These findings are summarized in Figure 8E.
Clinical significance of CIC has been explored, and CIC has been linked to prognosis in solid tumors.11-16 However, the pathological functions of CIC remain largely obscure due to lack of suitable models. Recently, Gutwillig et al described the observation of homotypic CIC in melanoma mouse models and human melanoma samples.39 They showed that the host outer tumor cells provide a physical barrier to protect the inner tumor cells from immunotherapies. The study demonstrated that tumor cells are capable of using the CIC mechanism to protect each other.
Despite this investigation, CIC remains understudied, especially in hematopoietic malignancies. With >100 unselected specimens, we defined the frequency of CIC to be ∼5%. We suspect the “real” frequency may be higher due to “sampling miss” in an individual patient. Regardless, this human histological review represents, to our knowledge, the largest cohort of hematopoietic tumors studied to date.
It is very challenging to demonstrate CIC in vivo. On the animal side, there is a lack of good models for CLL. Existing animal models resemble aggressive CLL but are not representative of the vast majority of indolent forms (reviewed in Herman and Wiestner18). On the human side, remarkably, we have identified CIC in the BM of BTKi-treated patients with CLL. However, it has become increasingly difficult to expand such a study, because BM examination has been deemed unnecessary for the routine diagnosis of CLL. The awareness of CIC may prompt future in vivo investigations when suitable models become available.
Regarding lymphoma types, we focused on primary CLL and scanned FL tumor cells. It remains unclear whether lymphomas of other histological types are capable of hiding inside the stromal cells. CIC could also play roles beyond disease persistence under different conditions.
Our findings help explain some of the clinical observations and experience.32 BTKis and BCL2is are both effective, but their response depths differ, leading to different rate of MRD negativity as well as different clinical management strategies. BTK-targeted therapies, partially because of their low CR rate, are recommended for indefinite use until disease progression, whereas ven may be used for a fixed duration.32,40,41 Our finding that BTKis but not ven drive CIC offers a biological explanation for this clinical difference. The potential of residual disease reduction may become increasingly important in future drug development endeavors.
Mechanistically, we have identified the CXCL12-CXCR4 axis as a critical control mechanism for live CIC phenomena. The chemokine axis plays a key role in lymphocyte migration and homing.42 Higher CXCR4 in CLL was reported in a previous study but it was compared with that of patients’ autologous T cells.24 Our results clearly showed that CLL cells in general have higher surface CXCR4 than NBC, and this correlate with higher number of CIC in CLL under the untreated condition. Under ibr treatment, increased CXCR4 parallels with CIC changes as well (Figures 7B and 4F). These studies implicate that this well-known ligand-receptor pair has a new functional role.
Most interestingly, pleri and motix completely blocked CXCL-induced and ibr-driven CIC (Figure 8; supplemental Figure 13). These drugs are clinically approved for stem cell mobilization, and other CXCR4 antagonists are under clinical trials for Waldenstrom macroglobulinemia.43-45 Altogether, the availability of these agents could greatly facilitate future clinical translation for CIC targeting.
This study has limitations, particularly in comparing the CIC behavior between ibr-sensitive and ibr-resistant cases. Although some differences are obvious, such as the duration of CIC (Figure 4G), others are not, including CXCR4 expression (supplemental Figure 11) and response to the CXCR4 antagonist (Figure 8D). The inconclusive data mainly resulted from the small number of ibr-resistant samples available to us. CIC may or may not be a BTKi-resistant mechanism. This work demonstrated CIC as a mechanism for residual disease persistence (that happens in ∼90% of BTKi-treated patients) but also as a mechanism for drug resistance (that happens in 10%-15% of patients). We believe these 2 processes, although highly related, are distinct from each other, and disease persistence precedes therapy resistance. Further studies are warranted to explore this relationship.
In conclusion, our findings suggest that live CIC may represent an important mechanism used by tumor cells to survive drug insults, persist, and later mutate to cause clinical relapses. Our study raises the awareness of CIC in cancer and opens new avenues of research.
Acknowledgments
The authors appreciate technical assistance from Priyal Patel and Katherine Carroll.
This work was supported by National Cancer Institute R21CA263415 (Y.L.W.). The authors also thank the technical and professional help provided by the Fox Chase Biosample Repository, Biological Imaging, Cell Culture and Cell Sorting facilities that are supported by the center's core grant CA06927 and equipment grant S10ODO23666.
Authorship
Contribution: Y.L.W., C.A.F., and P.L. formed the hypothesis, developed the ideas, and designed many experiments; P.L., A.V., C.A.F., A.E., S.A.S., S.R., and S.W. developed assays, designed and performed experiments, solved technical problems, analyzed data, and contributed to graph presentation; J.G. performed pathological examination and interpretation of all images of human materials; J.G., S.M., M.M., and S.N. contributed useful patient materials and patient pathological and treatment information; all authors contributed to useful discussions of the project and participated in the manuscript writing; and Y.L.W. directed, supervised, and coordinated the project, designed experiments, analyzed data, and compiled and wrote the manuscript draft.
Conflict-of-interest disclosure: The authors declare no competing financial interests.
Correspondence: Y. Lynn Wang, Cancer Signalling and Microenvironment Program, Department of Pathology, Fox Chase Cancer Center, 333 Cottman Ave, W364, Philadelphia, PA 19111; email: yuelynn.wang@fccc.edu.
References
Author notes
P.L. and C.A.F. contributed equally to this work.
Data are available upon request from the corresponding author, Y. Lynn Wang (yuelynn.wang@fccc.edu).
The full-text version of this article contains a data supplement.

