Key Points
Genome-wide CRISPR/Cas9 screens identify the mTORC1 pathway as crucial for B-ALL cell sensitivity to dexamethasone.
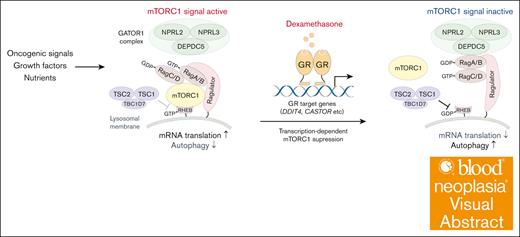
Dexamethasone transcriptionally regulates factors upstream of mTORC1 signaling, inducing cell death.
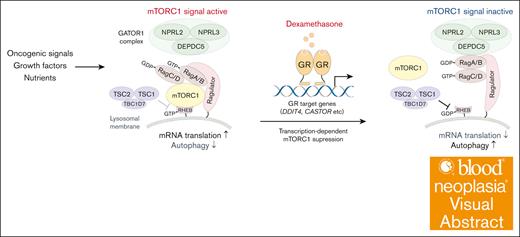
Visual Abstract
Glucocorticoids (GCs), such as dexamethasone and prednisone, are crucial components of B-cell precursor acute lymphoblastic leukemia (B-ALL) therapies. However, the molecular basis of GC-induced cell death remains elusive. Here, we show that GC suppresses mechanistic target of rapamycin complex 1 (mTORC1) signaling and that, conversely, oncogenic activation of mTORC1 confers resistance to GCs. Our genome-wide CRISPR/CRISPR-associated protein 9 (CRISPR/Cas9) dropout screens reveal that depletion of components of either the gap activity toward Rags 1 or tuberous sclerosis complexes, both negative regulators of mTORC1 signaling, significantly attenuates B-ALL cell sensitivity to dexamethasone. Dexamethasone primarily induces B-ALL cell death by downregulating mTORC1 activity, thus promoting autophagy and impairing protein synthesis. Dexamethasone treatment failed to suppress mTORC1 activity in B-ALL cells expressing mutant GC receptors lacking DNA-binding capacity, suggesting that dexamethasone transcriptionally represses mTORC1 activity. RNA-sequencing analysis identified multiple dexamethasone target genes that negatively regulate mTORC1 activity. Our findings suggest that GC sensitivity is significantly influenced by oncogenic stimuli and/or growth factors that activate the PI3K-AKT-mTORC1 pathway. This is consistent with the frequent GC resistance found in Ph and Ph-like ALLs.
Introduction
B-cell precursor acute lymphoblastic leukemia (B-ALL) is a malignant disorder characterized by abnormal proliferation of B-cell progenitors. Despite recent advances in treatment regimens leading to improved clinical outcomes, the prognosis for adults with B-ALL or for relapsed cases remains poor.1-4 Glucocorticoids (GCs) are central to B-ALL therapy, and responses to GCs are strong predictors of clinical outcomes.3,5-9 Furthermore, genetic changes leading to GC resistance, such as mutations in NR3C1 (which encodes the GC receptor [GR]), are identified in relapsed disease.10
Accumulating evidence suggests that GCs induce cell death through diverse pathways.11-20 Upon stimulation, GC/GR complexes translocate to the nucleus and bind to genomic GC response elements, in turn regulate transcription of target genes. Consequently, GCs induce apoptosis and/or cell cycle arrest in B-ALL cells. However, molecular mechanisms underlying GC-induced cell death remain unclear.
To identify molecules and pathways relevant to B-ALL cell sensitivity to GCs in an unbiased and comprehensive manner, we performed genome-wide CRISPR–CRISPR-associated protein 9 (CRISP/Cas9) dropout screens with and without dexamethasone using 2 B-ALL lines. This approach identified a series of negative regulators of the mechanistic target of rapamycin complex 1 (mTORC1) pathway and its downstream effectors, particularly those involved in autophagy, as genes associated with dexamethasone resistance. Although activation of mTORC1 signaling confers resistance to dexamethasone, we also demonstrate that transcription-mediated downregulation of mTORC1 signaling is a key mechanism underlying dexamethasone-induced cell death.
Methods
Cell culture
The following cell lines were obtained from Deutsche Sammlung von Mikroorganismen und Zellkulturen (DSMZ): HEK293T (DSMZ, ACC 635), NALM-6 (DSMZ, ACC 128), and MUTZ-5 (DSMZ, ACC 490). HEK293T cells were cultured in Dulbecco modified Eagle medium with high glucose (FUJIFILM Wako Pure Chemical Corporation) supplemented with 10% fetal bovine serum (FBS; Omega Scientific or Sigma-Aldrich) and 100 U/mL penicillin-streptomycin (Life Technologies or Nacalai Tesque Inc) at 37°C with 5% CO2. NALM-6 and MUTZ-5 cells were cultured in RPMI-1640 medium with L-glutamine and phenol red (FUJIFILM Wako Pure Chemical Corporation) supplemented with 10% (NALM-6 cells) or 20% (MUTZ-5 cells) FBS, and 100 U/mL penicillin-streptomycin at 37°C with 5% CO2. Somatic mutations in MUTZ-5 and NALM-6 cells were assessed via an in-house gene panel test. Variants are identified using the Genomon pipeline (https://genomon-project.github.io/GenomonPagesR/).
Cell culture and drug treatments
For cell viability analysis, annexin V assays, and O-propargyl-puromycin (OP-Puro) incorporation assays, NALM-6 cells were seeded at a density of 1.5 × 10⁵ cells and MUTZ-5 cells at 3.0 × 10⁵ cells in 96-well plates. Cells were then treated with either control 0.1% dimethyl sulfoxide (DMSO) (vehicle) or dexamethasone (Sigma-Aldrich), either singly or combined with other drugs of interest, for 72 hours at doses indicated in respective figure legends. For annexin V assays, the proportion of apoptotic cells was assessed 48 hours after DMSO or drug treatment. OP-Puro incorporation analysis to assess protein synthesis levels, was performed 24 hours after drug treatment, using cells treated 6 hours with cycloheximide as a positive control. For quantitative real-time polymerase chain reaction (RT-PCR) assays, RNA sequencing, phosphorylated S6 ribosomal protein (phospho-S6) flow cytometry, and immunoblot analysis, cells were seeded at a density of 1.0 × 10⁶ cells per well in 12-well plates. For quantitative RT-PCR and RNA-seq experiments, cells were treated for 6 hours with either 100 nM dexamethasone or 0.1% DMSO. Phospho-S6 and LysoTracker RED DND-99 flow cytometry experiments were performed 24 hours after drug treatment. Protein samples for western blots were collected 6 or 24 hours after treatment. When assessing phospho-S6 levels using flow cytometry or western blots, cells were incubated with fresh medium for 30 minutes before harvest to minimize potential effects of starvation. RMC-5552 was purchased from MedChemExpress.
Lentivirus production and transduction
A packaging mixture was prepared by mixing 8.6 μg lentiviral expression vectors, 7.0 μg BaEVTR, and 8.6 μg psPAX2 plasmids in 1 mL OptiMem (Life Technologies), as previously described.21 The mixture was then combined with 60 μg linear polyethylenimine (Polysciences) or 40 μL TransIT-LT1 (Mirus), incubated for 30 minutes at room temperature, and applied to HEK293T cells seeded the previous day in a 10-cm dish. When polyethyleneimine was used, the medium was changed at 6 hours after transfection. Lentiviral supernatants were harvested 48 and 72 hours after transfection, filtered through a 0.22-μm or 0.45-μm filter to remove debris, and concentrated either by ultracentrifugation (100 000g for 2 hours at 4°C using a HITACHI CS100FNX S50A-2254 rotor) or by using a Lenti-X Concentrator according to the manufacturer’s protocol (Takara Bio USA, Inc, San Jose, CA). After removing supernatants, pellets were resuspended in 200 μL OptiMem and stored at −80°C until use. For infection, cells were plated in 12-well plates (1 × 10⁶ to 3 × 10⁶ cells per well) and coincubated for 2 hours with the viral concentrate in the presence of 8 μg/mL Polybrene (Santa Cruz Biotechnology, Dallas, TX), followed by 2 hours of spin-infection at 700g and 37°C. Selection began the following day using blasticidin (FUJIFILM Wako Pure Chemical Corporation) at 10 μg/mL for NALM-6 cells, and 2 μg/mL for MUTZ-5 cells. Puromycin (FUJIFILM Wako Pure Chemical Corporation) was used at 2 μg/mL for both lines. Fluorescence-activated cell sorting was performed using either a BD FACS Aria II cell sorter (BD Biosciences) or a Cell Sorter MA900 (Sony Biotechnology Inc).
Cell viability and apoptosis assays
Cell viability was assessed using the CellTiter-Glo 2.0 Cell Viability Assay (Promega), following the manufacturer's protocol. Luminescence was measured using an EnSpire plate reader (PerkinElmer). Apoptosis assays were performed using APC-annexin V (BioLegend) and propidium iodide (BioLegend). Cells were analyzed with an Attune Flow Cytometer (Thermo Fisher Scientific K.K.), and data were analyzed using FlowJo software (BD Biosciences).
Cell growth competition assay
Cells were transduced with lentiviral vectors coexpressing a single-guide (sgRNA) and either the E2-Crimson gene or the blue fluorescent protein gene, achieving a transduction efficiency of 20% to 50%. Seven days later, cells were treated with either dexamethasone (10 nM for NALM-6, and 1 nM for MUTZ-5 cells) or 0.1% DMSO, and cell growth was assessed over the next 7 or 11 days by monitoring changes in the proportion of cells expressing the fluorescent protein. Fluorescence positivity relative to day 0 (2 days after transduction) was calculated using the formula: [fluorescence positivity (%) ÷ fluorescence negativity (%)] ÷ [day 0 fluorescence positivity (%) ÷ day 0 fluorescence negativity (%)].
Flow cytometry analysis of phospho-S6 levels
Cells were fixed for 10 minutes in BD Cytofix Fixation Buffer (BD Biosciences) at 37°C then permeabilized for 30 minutes using Perm Buffer III (BD Biosciences) at 4°C. Cells were then blocked for 1 hour with 5% bovine serum albumin in phosphate-buffered saline (PBS) at room temperature. For primary antibody staining, cells were incubated for 1 hour with a phospho-S6 (Ser235/236) primary antibody (Cell Signaling Technology, catalog no. 2211) in staining medium (Hanks' balanced salt solution with 2% FBS and 4 mM EDTA) at room temperature. After washing with staining medium, cells were stained for 1 hour at room temperature with a phycoerythrin-conjugated secondary antibody (Thermo Fisher Scientific K.K., catalog no. 12-4739-81) and then resuspended in staining medium for flow cytometry analysis.
OP-Puro incorporation assay
OP-Puro incorporation was assessed using the Click-iT Plus OPP Alexa Fluor 488 Protein Synthesis Assay Kit (Thermo Fisher Scientific K.K.), following the manufacturer's protocol. Briefly, cells were treated for 24 hours with either DMSO, cycloheximide, or 100 nM dexamethasone, followed by a 30-minute incubation with 20 μM Click-iT OPP working solution. After washing with PBS, stained samples were analyzed by flow cytometry.
LysoTracker dye incorporation assay
Cells were stained for 1 hour with 100 nM LysoTracker RED DND-99 (Thermo Fisher Scientific K.K.) in cell culture medium at 37°C. After washing with PBS, lysosomal mass was analyzed by flow cytometry.
Immunoblotting
Cells were harvested and washed once with PBS. Whole-cell lysates were prepared by lysing cells in 4× Laemmli sample buffer (Bio-Rad Laboratories, Inc) diluted with water containing 2.5% 2-mercaptoethanol, protease inhibitors, and phosphatase inhibitors, followed by sonication and heat denaturation. Lysates were separated by sodium dodecyl sulfate–polyacrylamide gel electrophoresis and transferred to polyvinylidene difluoride membranes. Membranes were then blocked with 5% nonfat milk in Tris-buffered saline plus 0.5% Tween-20 (Nacalai Tesque Inc), probed with primary antibodies, and analyzed using horseradish peroxidase–conjugated anti-rabbit or anti-mouse secondary antibodies (BioLegend). To analyze multiple proteins blotted onto a single membrane, we divided the membrane into horizontal strips based on target protein molecular weight, and strips were stained separately with appropriate antibodies. To assess total protein levels of AKT, AMPKα, and β-actin, we stripped membranes using WB Stripping Solution (Nacalai Tesque Inc) and reprobed them with antibodies recognizing the protein of interest.
CRISPR/Cas9-based loss-of-function screens
Screens were conducted in duplicate for each condition using the human Brunello library, which includes 77 441 sgRNAs targeting 19 114 genes, with an average of 4 sgRNAs per gene, and 1000 nontargeting control sgRNAs.22 Plasmid pool preparation and sgRNA library transduction were performed as previously described.21,23-25 B-ALL cells stably expressing Cas9 were transduced with the screening library at an efficiency of 30% to 50%, ensuring that most cells received only 1 sgRNA. sgRNA-transduced cells were then selected in 2 μg/mL puromycin for 2 days starting the day after transduction. At least 4 × 10⁷ cells were harvested on the third day after transduction to obtain input DNA, ensuring representation of >500 cells per guide RNA of selected cells. The remaining cells were maintained for 8 to 9 days after transduction and then divided into groups treated with either 0.1% DMSO or dexamethasone. After 9 to 10 more days of incubation, at least 4 × 10⁷ cells were harvested, and genomic DNA was extracted from collected cell pellets using a QIAamp DNA Blood Midi Kit or QIAamp DNA Blood Maxi Kit (Qiagen). Library preparation was conducted as previously described.21,23-25 sgRNA inserts were PCR amplified from genomic DNA using Herculase 2 fusion DNA polymerase (Agilent). Resulting PCR products were purified and sequenced on a NextSeq500 sequencer (Illumina) to assess changes in sgRNA abundance between initial and final cell populations, and between populations treated with or without dexamethasone. Genomic DNA was isolated from cells before and after the culture period and deep sequenced to measure read counts of each sgRNA. Changes in abundance of each sgRNA were assessed using the MAGeCK MLE program.26 We identified nearly 90 enriched genes with dexamethasone treatment in each line at a false discovery rate of 0.1 using the DrugZ software, with significant overlap between the lines.
Statistical analyses
Statistical tests were conducted as indicated in figure legends. Plots were generated, and statistical analyses were carried out using JMP Pro 16 (JMP Inc). Error bars in plots represent standard errors, unless otherwise specified.
Results
Genome-wide CRISPR/Cas9 screens identify the mTORC1 pathway as a critical regulator of GC-induced B-ALL cell death
To identify molecular pathway(s) required for GC-induced cell death in B-ALL cells, we conducted genome-wide CRISPR/Cas9 dropout screens with or without dexamethasone using the human B-ALL lines NALM-6 and MUTZ-5 (Figure 1A). NALM-6 harbors the IGH::DUX4 rearrangement, an ERG microdeletion, and an NRAS A146T mutation, whereas MUTZ-5 possesses the IGH::CRLF2 rearrangement and a JAK2 R683G mutation.21,27 We incubated cells with dexamethasone at dosages at which 50% of the cells remained viable after a 10-day culture period, which was 10 nM for NALM-6, and 1 nM for MUTZ-5 cells. Changes in sgRNA abundance occurring over the culture period were assessed using the MAGeCK MLE program26 (Figure 1B; supplemental Tables 1 and 2). Genes with sgRNA abundance significantly altered by GC treatment were also analyzed using the DrugZ program28 (Figure 1C; supplemental Figure 1 A). As expected, sgRNAs targeting NR3C1, which encodes the GCR, were highly enriched in both lines. Additionally, sgRNAs targeting positive regulators of GC/GCR-mediated signals, such as PTGES3, TBL1XR1, and STIP1,29-31 were also enriched (Figure 1B-C). By contrast, depleting FKBP5 (encoding the FKBP5 protein that negatively regulates the GCR pathway by retaining GR in the cytoplasm32) adversely affected cell growth in the presence of GC. Strikingly, sgRNAs targeting negative regulators of the mTORC1 pathway were significantly enriched in dexamethasone-treated cells. Depletion of NPRL2, NPRL3, or DEPDC5, each encoding a component of the GATOR1 (gap activity toward Rags 1) complex, led to GC resistance in both lines. Similarly, sgRNA targeting TSC2, which encodes a component of the tuberous sclerosis complex (TSC) that negatively regulates mTORC1-mediated signals, was identified. Furthermore, genes downstream of the mTORC1 pathway and functioning in autophagy, such as USP9, ATG10, ATG14, and ATG101, were identified as contributing to GC resistance, a trend more pronounced in MUTZ5 cells (Figure 1B-C; supplemental Figure 1B). These findings were corroborated by Gene Ontology (GO) analysis (supplemental Figure 1C). Overall, 15 common genes were identified whose sgRNAs were enriched by dexamethasone treatment of both cell lines (Figure 1D).
Genome-wide CRISPR/Cas9 screens identify negative regulators of the mTORC1 pathway as key modulators of B-ALL cell sensitivity to dexamethasone. (A) Schematic of the CRISPR screen strategy used to identify regulators of GC-mediated signaling pathways. (B) Dot plots representing β-scores26 of 19 114 genes in the presence or absence of dexamethasone. Genes whose β-scores show statistically significant changes upon drug treatment (false discovery rate [FDR] <0.1) are depicted in red. (C) CRISPR screen data showing gene-level ranking based on differential enrichment of sgRNAs by dexamethasone vs DMSO treatment. Normalized z score values were calculated using the DrugZ program.28 Genes whose sgRNAs were significantly enriched by dexamethasone relative to DMSO treatment are shown in red, and those with sgRNAs significantly depleted are in blue. Genes associated with the GC signal pathway, mTORC1 pathway, Ras pathway, and autophagy are depicted in red, green, blue, and purple, respectively. (D) Venn diagram illustrating genes significantly enriched by dexamethasone relative to DMSO treatment (FDR <0.1) in NALM-6 and MUTZ-5 cells. Dex, dexamethasone.
Genome-wide CRISPR/Cas9 screens identify negative regulators of the mTORC1 pathway as key modulators of B-ALL cell sensitivity to dexamethasone. (A) Schematic of the CRISPR screen strategy used to identify regulators of GC-mediated signaling pathways. (B) Dot plots representing β-scores26 of 19 114 genes in the presence or absence of dexamethasone. Genes whose β-scores show statistically significant changes upon drug treatment (false discovery rate [FDR] <0.1) are depicted in red. (C) CRISPR screen data showing gene-level ranking based on differential enrichment of sgRNAs by dexamethasone vs DMSO treatment. Normalized z score values were calculated using the DrugZ program.28 Genes whose sgRNAs were significantly enriched by dexamethasone relative to DMSO treatment are shown in red, and those with sgRNAs significantly depleted are in blue. Genes associated with the GC signal pathway, mTORC1 pathway, Ras pathway, and autophagy are depicted in red, green, blue, and purple, respectively. (D) Venn diagram illustrating genes significantly enriched by dexamethasone relative to DMSO treatment (FDR <0.1) in NALM-6 and MUTZ-5 cells. Dex, dexamethasone.
Depletion of any component of the GATOR1 complex or TSC promotes dexamethasone resistance
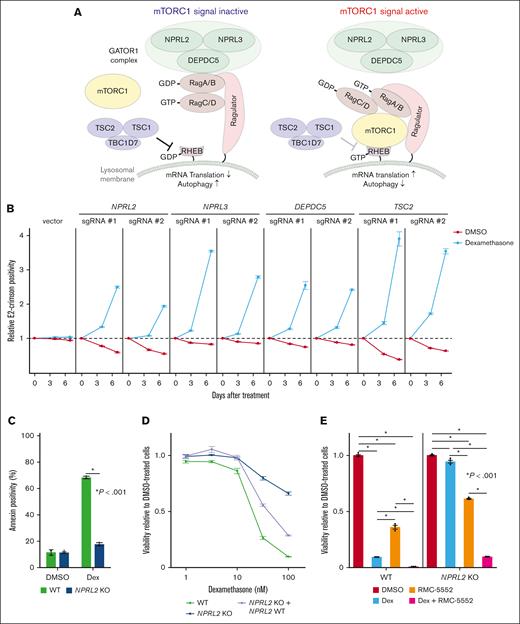
Both the GATOR1 and TSC protein complexes negatively regulate the mTORC1 pathway.33-35 The GATOR1 complex, consisting of DEPDC5, NPRL2, and NPRL3 subunits, negatively regulates mTORC1 by acting as a guanosine triphosphate (GTP) hydrolase (GTPase)-activating protein for the small GTPase Rag (Figure 2A).35 The TSC, comprised of TSC1 and TSC2 subunits, acts as a GTPase-activating protein for the small GTPase Rheb, another key regulator of mTORC133,34 (Figure 2A). In the absence of amino acids and/or growth signals, the mTORC1 remains inactive, decreasing protein synthesis and enhancing autophagy. Conversely, growth factor signaling and/or oncogenic mutations activate mTORC1 (Figure 2A). To validate the screening results, we used lentivirus-based E2-Crimson-tagged sgRNAs to deplete genes encoding each component of the GATOR1 complex or TSC2 alone in Cas9-expressing NALM-6 cells and cultured them with or without dexamethasone. We then assessed the proportions of Crimson-positive sgRNA-expressing cells over a 7-day period. We validated knockout (KO) efficiency by western blots for NPRL2, DEPDC5, and TSC2, and by Sanger sequencing for NPRL3 (supplemental Figure 2A-B). Cells expressing sgRNAs targeting NPRL2, NPRL3, DEPDC5, or TSC2 exhibited a proliferative advantage over nontransduced cells in the presence of dexamethasone (Figure 2B). To further assess effects of GATOR1 depletion on dexamethasone-induced cell death, we established NPRL2 KO NALM-6 clones and, using annexin-V assays, found that NPRL2-deficient cells were resistant to dexamethasone-induced cell death (Figure 2C). Furthermore, reintroducing NPRL2 into NPRL2 KO cells significantly increased dexamethasone sensitivity (Figure 2D; supplemental Figure 2C). Next, we asked whether pharmacological mTORC1 inhibition would synergize with dexamethasone to eradicate leukemia cells. To do so, we treated either wild-type (WT) or NPRL2 KO NALM-6 cells with RMC-5552, a novel mTORC1-specific inhibitor,36,37 and assessed cell viability. RMC-5552 alone induced cell death in NPRL2 WT cells, with less pronounced effects in NPRL2 KO cells. Notably, combining dexamethasone with RMC-5552 treatment resulted in more pronounced cell death than either treatment alone, regardless of NPRL2 status (Figure 2E), suggesting that this combination could enhance antileukemia effects independently of GATOR1 function.
Depletion of GATOR1 complex or TSC components decreases B-ALL cell dexamethasone sensitivity. (A) Schematic representation of the mTORC1-mediated signaling pathway. Both GATOR1 and TSC complexes negatively regulate mTORC1 signals depending on cellular metabolic status, reducing de novo protein synthesis and increasing autophagic activity. (B) Competition assay using NALM-6 cells stably expressing Cas9 (NALM-6-Cas9). Cells were transduced with a lentivirus vector encoding an sgRNA and a Crimson cassette and cultured with or without dexamethasone (10 nM). Crimson-positive cell fractions were assayed by fluorescence-activated cell sorting (FACS) at indicated times, and proportions were normalized to the number of Crimson-positive cells present at day 0 (2 days after transduction). Empty vector served as control. Each condition was assessed in triplicate, and data are represented as means ± standard deviation (SD). (C) NPRL2-WT or -KO NALM-6 cells were treated with either DMSO or dexamethasone, and proportions of apoptotic cells were assessed by annexin V staining 48 hour later. Conditions were assessed in triplicate, and data are represented as means ± SD. P values were calculated by Student t test. (D) NPRL2 WT, NPRL2 KO only, or NPRL2-KO cells overexpressing WT NPRL2 were treated for 96 hours with either dexamethasone at various doses (0.32 nM, 1 nM, 3.2 nM, 10 nM, or 32 nM) or DMSO. Viability of dexamethasone-treated cells was analyzed based on luminescence signal values, and values at each dose were normalized to values seen in DMSO-treated controls. Each condition was assessed in triplicate, and data are represented as means ± SD. (E) NPRL2-WT or -KO NALM-6 cells were treated for 72 hours with either DMSO, dexamethasone, RMC-5552, or a combination of dexamethasone and RMC-5552, and cell viability was assessed as in panel D. P values were calculated by analysis of variance (ANOVA) with Dunnett multiple-comparison test. The data presented are representative of multiple independent experiments.
Depletion of GATOR1 complex or TSC components decreases B-ALL cell dexamethasone sensitivity. (A) Schematic representation of the mTORC1-mediated signaling pathway. Both GATOR1 and TSC complexes negatively regulate mTORC1 signals depending on cellular metabolic status, reducing de novo protein synthesis and increasing autophagic activity. (B) Competition assay using NALM-6 cells stably expressing Cas9 (NALM-6-Cas9). Cells were transduced with a lentivirus vector encoding an sgRNA and a Crimson cassette and cultured with or without dexamethasone (10 nM). Crimson-positive cell fractions were assayed by fluorescence-activated cell sorting (FACS) at indicated times, and proportions were normalized to the number of Crimson-positive cells present at day 0 (2 days after transduction). Empty vector served as control. Each condition was assessed in triplicate, and data are represented as means ± standard deviation (SD). (C) NPRL2-WT or -KO NALM-6 cells were treated with either DMSO or dexamethasone, and proportions of apoptotic cells were assessed by annexin V staining 48 hour later. Conditions were assessed in triplicate, and data are represented as means ± SD. P values were calculated by Student t test. (D) NPRL2 WT, NPRL2 KO only, or NPRL2-KO cells overexpressing WT NPRL2 were treated for 96 hours with either dexamethasone at various doses (0.32 nM, 1 nM, 3.2 nM, 10 nM, or 32 nM) or DMSO. Viability of dexamethasone-treated cells was analyzed based on luminescence signal values, and values at each dose were normalized to values seen in DMSO-treated controls. Each condition was assessed in triplicate, and data are represented as means ± SD. (E) NPRL2-WT or -KO NALM-6 cells were treated for 72 hours with either DMSO, dexamethasone, RMC-5552, or a combination of dexamethasone and RMC-5552, and cell viability was assessed as in panel D. P values were calculated by analysis of variance (ANOVA) with Dunnett multiple-comparison test. The data presented are representative of multiple independent experiments.
Dexamethasone treatment suppresses mTORC1-mediated signals and decreases protein synthesis in B-ALL leukemic cells
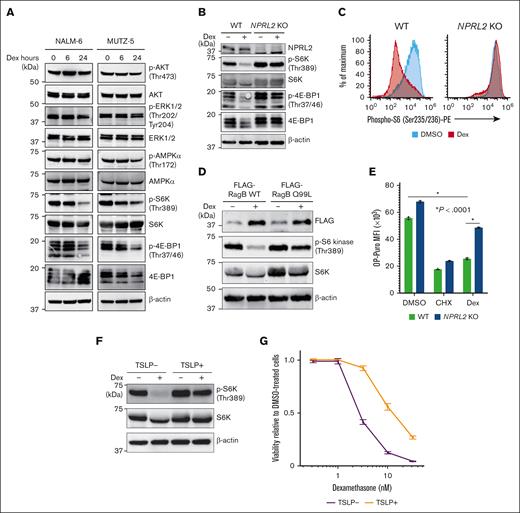
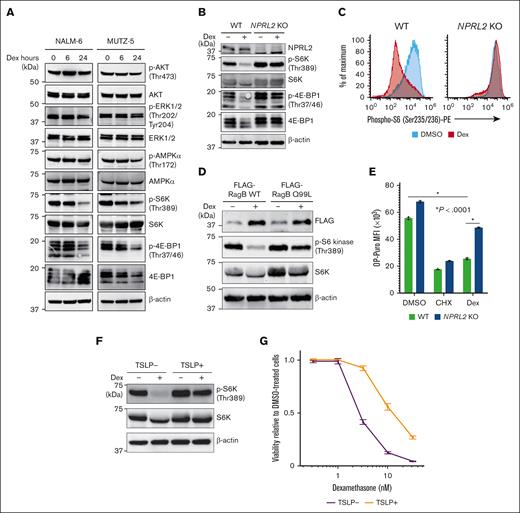
Given that depleting cancer cells of negative regulators of mTORC1 significantly increases their resistance to dexamethasone, we assessed the activity of factors downstream of mTORC1 after dexamethasone treatment in 2 B-ALL cell lines. Dexamethasone treatment significantly reduced levels of phospho-S6 kinase (S6K) and phospho-4E-BP1, both surrogate markers of mTORC1 activation (Figure 3A), and those effects were enhanced by mTORC inhibitor treatment (supplemental Figure 3A). Conversely, NPRL2 depletion almost completely abrogated these effects (Figure 3B-C). Similarly, dexamethasone-induced reduction in phospho-S6K levels was less evident in cells overexpressing a RagB mutant (RagB Q99L) that stably binds GTP and thus constitutively activates mTORC1 signaling than in those expressing WT RagB (Figure 3D). Moreover, dexamethasone treatment suppressed de novo protein synthesis in WT cells of both lines, an effect significantly less pronounced in NPRL2 KO cells, based on OP-Puro incorporation assays (Figure 3E). To determine whether dexamethasone-induced mTORC1 suppression also occurs after treatment with a growth factor known to enhance B-ALL pathogenesis, we treated MUTZ-5 cells, which harbor the IgH::CRLF2 rearrangement, with thymic stromal lymphopoietin (TSLP), a CRLF2 ligand that reportedly enhances phospho-S6K levels.38 Strikingly, TSLP treatment antagonized dexamethasone-induced mTORC1 suppression (Figure 3F), and cells cotreated with TSLP exhibited reduced sensitivity to dexamethasone (Figure 3G), with the effects being rescued by mTORC1 inhibitor treatment (supplemental Figure 3B).
Dexamethasone treatment antagonizes mTORC1 signaling in B-ALL cells. (A) Immunoblot analysis of NALM-6 and MUTZ-5 cells for signaling molecules functioning in the PI3K-AKT-mTORC1 pathway. Cells were treated with 100 nM dexamethasone for indicated hours and then harvested for western blotting with indicated antibodies. (B) NPRL2-WT or NPRL2-KO NALM-6 cells were treated for 24 hours with either DMSO or 100 nM dexamethasone, and activation status of signaling factors functioning in mTORC1 pathways was determined via western blot. (C) Phospho-S6K levels were evaluated by FACS in NPRL2-WT and NPRL2-KO NALM-6 cells after 24 hours of either DMSO or dexamethasone (100 nM) treatment. (D) Either WT RagB or its constitutive-active mutant (RagB Q99L) was overexpressed in NALM-6 cells, and phospho-S6K levels were examined by western blot. (E) Analysis of protein synthesis based on OP-Puro incorporation assays. NPRL2-WT and NPRL2-KO NALM-6 cells were treated 24 hours with either DMSO, cycloheximide (CHX), or 100 nM dexamethasone, and then OP-Puro incorporation was assessed by FACS. CHX, a translation inhibitor, served as a control. Each condition was assessed in triplicate, and data are represented as means ± SD. P values were calculated using ANOVA with Dunnett multiple-comparison test. (F) MUTZ-5 cells were treated with either DMSO or 100 nM dexamethasone for 24 hours with or without TSLP (10 ng/mL), and phospho-S6K levels were assessed by western blot. (G) MUTZ-5 cells were treated for 96 hours with either dexamethasone at various doses (0.32 nM, 1 nM, 3.2 nM, 10 nM, or 32 nM) or DMSO, with or without TSLP (10 ng/mL). Cell viability was assessed as described in Figure 2D. The data presented are representative of multiple independent experiments.
Dexamethasone treatment antagonizes mTORC1 signaling in B-ALL cells. (A) Immunoblot analysis of NALM-6 and MUTZ-5 cells for signaling molecules functioning in the PI3K-AKT-mTORC1 pathway. Cells were treated with 100 nM dexamethasone for indicated hours and then harvested for western blotting with indicated antibodies. (B) NPRL2-WT or NPRL2-KO NALM-6 cells were treated for 24 hours with either DMSO or 100 nM dexamethasone, and activation status of signaling factors functioning in mTORC1 pathways was determined via western blot. (C) Phospho-S6K levels were evaluated by FACS in NPRL2-WT and NPRL2-KO NALM-6 cells after 24 hours of either DMSO or dexamethasone (100 nM) treatment. (D) Either WT RagB or its constitutive-active mutant (RagB Q99L) was overexpressed in NALM-6 cells, and phospho-S6K levels were examined by western blot. (E) Analysis of protein synthesis based on OP-Puro incorporation assays. NPRL2-WT and NPRL2-KO NALM-6 cells were treated 24 hours with either DMSO, cycloheximide (CHX), or 100 nM dexamethasone, and then OP-Puro incorporation was assessed by FACS. CHX, a translation inhibitor, served as a control. Each condition was assessed in triplicate, and data are represented as means ± SD. P values were calculated using ANOVA with Dunnett multiple-comparison test. (F) MUTZ-5 cells were treated with either DMSO or 100 nM dexamethasone for 24 hours with or without TSLP (10 ng/mL), and phospho-S6K levels were assessed by western blot. (G) MUTZ-5 cells were treated for 96 hours with either dexamethasone at various doses (0.32 nM, 1 nM, 3.2 nM, 10 nM, or 32 nM) or DMSO, with or without TSLP (10 ng/mL). Cell viability was assessed as described in Figure 2D. The data presented are representative of multiple independent experiments.
Blocking autophagic activity antagonizes dexamethasone-induced suppression of B-ALL cell growth
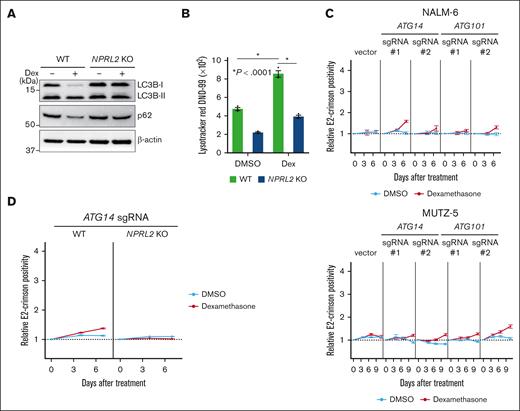
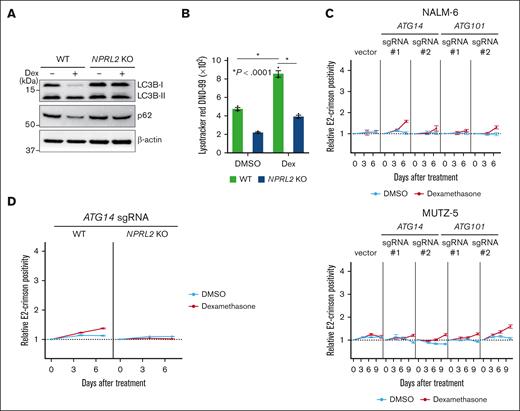
We identified genes encoding positive regulators of autophagy as dexamethasone resistance genes (Figure 1D; supplemental Figure 1B). To determine how dexamethasone treatment affects autophagy, we monitored autophagic activity by assessing levels of LC3-I to LC3-II conversion, a surrogate for autophagosome formation,39 by western blotting in both NPRL2 WT and KO NALM-6 cells, in the presence or absence of dexamethasone. This analysis indicated that dexamethasone treatment significantly induced autophagy in NPRL2 WT but not NPRL2 KO cells (Figure 4A). Furthermore, levels of p62 (also known as Sequestosome 1), whose degradation is a marker of autophagy,39 were reduced by dexamethasone treatment only in WT cells (Figure 4A), findings validated by a LysoTracker dye incorporation assay 40 (Figure 4B).
Dexamethasone induces autophagy, and lack of its component decreases B-ALL cell sensitivity to dexamethasone. (A) WT and NPRL2-KO NALM-6 cells were treated for 24 hours with either DMSO or 100 nM dexamethasone. Changes in LC3B-II and p62 protein levels (both indicators of autophagic activity) were evaluated by western blot using LC3B and p62 antibodies. (B) WT and NPRL2-KO NALM-6 cells were treated as in panel A, and autophagic activity was measured by FACS using LysoTracker Red DND-99 dye. (C) Competition assays were performed using NALM-6 or MUTZ-5-Cas9 cells expressing either empty vector or a lentivirus vector encoding indicated sgRNAs targeting either ATG14 or ATG10, in the presence or absence of dexamethasone (10 nM for NALM-6, and 1 nM for MUTZ-5), as described in Figure 2B. Each condition was analyzed in triplicate, and data are represented as means ± SD. (D) WT and NPRL2-KO NALM-6–Cas9 cells were transduced with a lentivirus vector encoding an sgRNA targeting ATG14, and competition assays were performed with or without dexamethasone (10 nM), as described in Figure 2B. Each condition was assessed in triplicate, and data are represented as means ± SD. The data presented are representative of multiple independent experiments.
Dexamethasone induces autophagy, and lack of its component decreases B-ALL cell sensitivity to dexamethasone. (A) WT and NPRL2-KO NALM-6 cells were treated for 24 hours with either DMSO or 100 nM dexamethasone. Changes in LC3B-II and p62 protein levels (both indicators of autophagic activity) were evaluated by western blot using LC3B and p62 antibodies. (B) WT and NPRL2-KO NALM-6 cells were treated as in panel A, and autophagic activity was measured by FACS using LysoTracker Red DND-99 dye. (C) Competition assays were performed using NALM-6 or MUTZ-5-Cas9 cells expressing either empty vector or a lentivirus vector encoding indicated sgRNAs targeting either ATG14 or ATG10, in the presence or absence of dexamethasone (10 nM for NALM-6, and 1 nM for MUTZ-5), as described in Figure 2B. Each condition was analyzed in triplicate, and data are represented as means ± SD. (D) WT and NPRL2-KO NALM-6–Cas9 cells were transduced with a lentivirus vector encoding an sgRNA targeting ATG14, and competition assays were performed with or without dexamethasone (10 nM), as described in Figure 2B. Each condition was assessed in triplicate, and data are represented as means ± SD. The data presented are representative of multiple independent experiments.
Next, we asked whether defects in autophagy mediate dexamethasone resistance. Activity of the ULK1 and PI3KCIII complexes is reportedly required for various steps of autophagy.41-44 To inhibit autophagy in NALM-6 and MUTZ-5 cells, we used sgRNAs to deplete cells of either ATG101 or ATG14, which are ULK1 or PI3KCIII complex components, respectively,41-44 and generated growth curves in the presence or absence of dexamethasone. Cells expressing sgRNA targeting either ATG101 or ATG14 showed a proliferative advantage in the presence of dexamethasone relative to nontransduced cells (Figure 4C). Notably, these effects were blocked by mTORC1 activation: NPRL2 KO cells transduced with ATG14 sgRNA did not show a proliferative advantage (Figure 4D). Of note, the effect sizes were markedly larger when the mTORC1 pathway was activated upstream by knocking out a component of the GATOR1 complex or TSC2 (Figure 2B) compared with inactivating autophagy, 1 of the mTORC1 effector pathways.
Dexamethasone transcriptionally regulates factors upstream of mTORC1 signaling
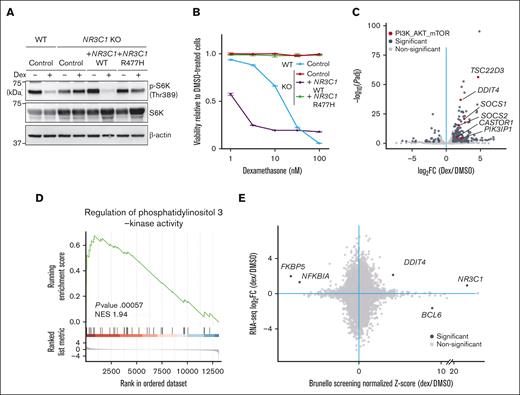
Next, we asked whether dexamethasone-induced mTORC1 suppression requires GR DNA binding capacity. To do so, we knocked out endogenous NR3C1 in NALM-6 cells and then overexpressed either WT NR3C1 or an NR3C1 mutant lacking DNA binding capacity, NR3C1R477H45 (supplemental Figure 4A). RT-PCR analysis of dexamethasone-treated cells revealed upregulation of TSC22D3, a known dexamethasone target gene,46 in cells overexpressing WT NR3C1 but not the NR3C1R477H mutant (supplemental Figure 4B). Although dexamethasone treatment decreased phospho-S6K levels in cells overexpressing WT NR3C1, it failed to do so in cells expressing NR3C1R477H (Figure 5A). Furthermore, cells expressing the NR3C1R477H mutant were resistant to dexamethasone-induced cell death (Figure 5B).
Dexamethasone treatment of B-ALL cells increases transcription of factors upstream of mTORC1. (A) NR3C1-KO NALM-6 cells overexpressing either WT NR3C1 or a mutant defective in DNA binding (NR3C1 R477H) were treated for 24 hours with either DMSO or 100 nM dexamethasone, and phospho-S6K levels were evaluated by western blot. NR3C WT and KO cells expressing an empty vector served as controls. (B) Cells were treated for 96 hours with either dexamethasone at various doses (0.32 nM, 1 nM, 3.2 nM, 10 nM, or 32 nM) or DMSO, and cell viability was assessed, as described in Figure 2D. The data presented are representative of multiple independent experiments. (C) NALM cells were treated for 6 hours with either DMSO or 100 nM dexamethasone and harvested for RNA-seq. Fold-changes (x-axis) in gene expression upon dexamethasone treatment for each gene and their respective P values (y-axis) are displayed in volcano plots. Genes with significantly changed expression after dexamethasone treatment are depicted in dark gray, and, among them, those relevant to the PI3K-AKT-mTORC1 pathway are shown in red. (D) Gene set enrichment analysis (GSEA) analysis demonstrating enrichment of a PI3K-AKT-mTORC1 pathway signature in dexamethasone-treated cells. (E) Dot plots demonstrate a correlation between RNA-seq and CRISPR screen results.
Dexamethasone treatment of B-ALL cells increases transcription of factors upstream of mTORC1. (A) NR3C1-KO NALM-6 cells overexpressing either WT NR3C1 or a mutant defective in DNA binding (NR3C1 R477H) were treated for 24 hours with either DMSO or 100 nM dexamethasone, and phospho-S6K levels were evaluated by western blot. NR3C WT and KO cells expressing an empty vector served as controls. (B) Cells were treated for 96 hours with either dexamethasone at various doses (0.32 nM, 1 nM, 3.2 nM, 10 nM, or 32 nM) or DMSO, and cell viability was assessed, as described in Figure 2D. The data presented are representative of multiple independent experiments. (C) NALM cells were treated for 6 hours with either DMSO or 100 nM dexamethasone and harvested for RNA-seq. Fold-changes (x-axis) in gene expression upon dexamethasone treatment for each gene and their respective P values (y-axis) are displayed in volcano plots. Genes with significantly changed expression after dexamethasone treatment are depicted in dark gray, and, among them, those relevant to the PI3K-AKT-mTORC1 pathway are shown in red. (D) Gene set enrichment analysis (GSEA) analysis demonstrating enrichment of a PI3K-AKT-mTORC1 pathway signature in dexamethasone-treated cells. (E) Dot plots demonstrate a correlation between RNA-seq and CRISPR screen results.
To identify potential dexamethasone/GR target genes functioning in dexamethasone sensitivity, we performed RNA-seq analysis of NALM-6 cells treated for 6 hours with or without dexamethasone (supplemental Table 3). As expected, gene set enrichment analysis demonstrated enrichment of a GC signature (GO:0071385) in dexamethasone-treated cells (supplemental Figure 4C). Importantly, messenger RNA levels of upstream regulators of the mTORC1 pathway, including DDIT4,47,48TSC22D3,49SOCS1/2,50 and CASTOR,51 were significantly upregulated by dexamethasone treatment (Figure 5C), and a PI3K signature (GO:0043551) was also enriched in dexamethasone-treated cells (Figure 5D). Among factors upstream of the mTORC1 pathway, sgRNAs targeting DDIT4 were enriched by dexamethasone treatment in the original CRISPR/Cas9 screen performed in NALM6 cells (Figure 5E).
Discussion
Both Ph-positive ALL and Ph-like ALL have been previously reported to be resistant to GCs, and the PI3K-AKT-mTOR pathway is activated in these B-ALL subtypes.9,21,38,52 Results presented here support the hypothesis that mTORC1 pathway activation decreases leukemia cell sensitivity to GCs. Moreover, our findings suggest that autophagy, a cellular process downstream of the mTORC1 pathway, is involved in mediating GC effects in B-ALL cells.
We previously reported that the RAS pathway plays a major role in the fitness and ruxolitinib sensitivity of IgH::CRLF2–rearranged B-ALL cells.21 In that study, our genome-wide CRISPR/Cas9 dropout screens of ruxolitinib-treated MUTZ-5 cells identified genes encoding negative regulators of the RAS pathway as ruxolitinib resistance genes, but we did not identify genes related to the GATOR1 complex or autophagic processes.21 Considering cross talk between RAS and PI3K-AKT-mTOR pathways,53,54 oncogenic mutations in the RAS pathway, which are frequent in Ph-like ALL cases, may antagonize dexamethasone sensitivity via mTORC1 activation.53,54 In fact, in this study, except for NF1, we identified negative regulators of RAS, such as DUSP6 and LZTR1, as dexamethasone resistance genes only in MUTZ-5 cells (Figure 1C), which harbor WT KRAS and NRAS genes.21 By contrast, sgRNAs targeting negative regulators of the RAS pathway were not enriched upon dexamethasone treatment in NALM-6 cells (Figure 1C) because the RAS signal is presumably activated because of the NRAS A146T mutation (supplemental Table 8). It is likely that the degree of dependency on the mTORC1 pathway in terms of cell fitness varies among B-ALL subtypes depending on genetic background, and these differences may underlie why dependency on autophagy is more evident in MUTZ-5 than NALM-6 cells. It should be noted that the effect sizes on GC sensitivity were markedly smaller when the autophagy pathway, 1 of many effector pathways downstream of mTORC1, was inactivated (Figure 4), compared with the effects observed from activating all downstream pathways through the inactivation of components of the GATOR1 complex or TSC2 (Figure 2), each being an upstream negative regulator of mTORC1.
We, and others, previously showed that blocking both the RAS and PI3K-AKT-mTOR pathways is critical to treat B-ALL, in particular, subtypes harboring the IgH::CRLF2 rearrangement.21,52,55-59 Although simultaneous targeting of both pathways by combining a MEK (MAPK/extracellular signal-regulated kinase kinase) inhibitor (for RAS) with an mTOR pathway inhibitor is reasonable, the toxicity of this approach limits its use in clinical settings.60 Our current study reinforces the importance of shutting-down both pathways, because sensitivity to GC, an essential component of ALL therapy, primarily depends on mTORC1-mediated signals in B-ALL cells. Development of mTOR pathway inhibitors has long been a goal for treating hematologic malignancies; however, such inhibitors are not yet available as a standard of care for B-ALL therapy because, in part, of their insufficient effects on cell killing and/or significant side effects due to simultaneous blocking of both mTORC1 and mTORC2 pathways.61,62 Recently, so-called “bi-steric” mTOR inhibitors that preferentially inactivate mTORC1 over mTORC2, thereby inhibiting the 4EBP1-eIF4E axis without compromising the mTORC2 pathway, have been developed.36,37,63 Considering mechanisms of GC action described here, combining a GC with an mTORC1-specific inhibitor is a reasonable approach. In fact, we found that treatment with RMC-5552, a bi-steric mTORC1-specific inhibitor, significantly enhances dexamethasone sensitivity in NALM-6 cells (Figure 2E).
The mTOR pathway is a central regulator of cellular metabolism via sensing the input of nutrients and/or growth factors. Thus, our findings may be relevant to the observed correlation of obesity with poor response to chemotherapy seen in B-ALL patients.64-66 It is possible that basal mTORC1 activity levels and/or the response to GC treatment vary in B-ALL cells from different patients, and that patients who are obese may show activated mTORC1 signaling due to a high-fat diet and/or overeating.67
We showed that GR transcriptional activity is essential for dexamethasone-induced death of leukemia cells and that a series of upstream mTORC1 regulators is activated by dexamethasone treatment. However, only DDIT4, among potential dexamethasone-regulated genes, was identified as a resistance gene in our CRISPR/Cas9 dropout screen (Figure 5E). These results suggest that dexamethasone transcriptionally regulates multiple genes functioning in the PI3K-AKT-mTOR pathway, collectively suppressing mTORC1 activity. Given that B-ALL subtypes exhibit a variety of oncogenic mutations and that multiple and distinct oncogenic signals can activate RAS and PI3K-AKT-mTOR pathways, it is possible that dexamethasone induces death of B-ALL cells by altering expression of multiple genes upstream of mTORC1.
In summary, this study represents an important step toward a better understanding of mechanisms underlying GC-induced cell death and resistance in B-ALL, providing a foundation for development of new combination therapies targeting mTORC1 signaling to enhance efficacy of GC-based treatments. Because GCs are an essential component of therapies not only for B-ALL but also for numerous immune-related diseases, such as graft-versus-host disease or autoimmune diseases, our study has broad implications in medicine, and is particularly relevant to hematology/oncology, transplantation medicine, and rheumatology.
Acknowledgments
The authors thank the members of the Department of Medicine and Biosystemic Science and the Division of Precision Medicine at Kyushu University for assistance and helpful discussion, and Elise Lamar for critical reading of the manuscript. The authors also thank Satoshi Yoshimura, Zhenhua Li, and Jun Yang for helpful discussion.
This work is supported, in part, by a Grant-in-Aid for Young Scientists (18K16089; to Y.S.), a Grant-in-Aid for Young Scientists (19K17859), a research grant from the Kanae Foundation, the MSD Life Science Foundation, the Yasuda Medical Foundation, the Mochida Memorial Foundation for Medical and Pharmaceutical Research, the Shinnihon Foundation of Advanced Medical Treatment Research, the Takeda Science Foundation (to T.Y.), a Grant-in-Aid for Scientific Research (C; 23K07816; to K.S.), a Grant-in-Aid for Young Scientists (22K16323; to S.H.), a Grant-in-Aid for Scientific Research (S; 16H06391; to K.A.), a Grant-in-Aid for Scientific Research (A; 17H01567, 20H00540), an AMED under grant number 18063889, and a Grant-in-Aid for Scientific Research (S; 20H05699; to T.M).
Authorship
Contribution: H.I., Y.S., T.Y., and T.M. designed CRISPR/Cas9 screen experiments; H.I., Y.S., K.S., T.Y., T.T., J.N., K.A., H.M., S.I., and T.M. reviewed CRISPR screen data; H.I., K.S., Y.S., T.Y., K.S., S.H., T.T., H.M., and F.N. executed the CRISPR/Cas9 and cell biology experiments; and H.I., S.I., and T.M. wrote the manuscript with help from all authors.
Conflict-of-interest disclosure: The authors declare no competing financial interests.
Correspondence: Takahiro Maeda, Division of Precision Medicine, Kyushu University Graduate School of Medical Sciences, 3-1-1 Maidashi, Higashi-ku, Fukuoka 812-8582, Japan; email: maeda.takahiro.294@m.kyushu-u.ac.jp.
References
Author notes
Data are available on request from the corresponding author, Takahiro Maeda (maeda.takahiro.294@m.kyushu-u.ac.jp).
The full-text version of this article contains a data supplement.

![Genome-wide CRISPR/Cas9 screens identify negative regulators of the mTORC1 pathway as key modulators of B-ALL cell sensitivity to dexamethasone. (A) Schematic of the CRISPR screen strategy used to identify regulators of GC-mediated signaling pathways. (B) Dot plots representing β-scores26 of 19 114 genes in the presence or absence of dexamethasone. Genes whose β-scores show statistically significant changes upon drug treatment (false discovery rate [FDR] <0.1) are depicted in red. (C) CRISPR screen data showing gene-level ranking based on differential enrichment of sgRNAs by dexamethasone vs DMSO treatment. Normalized z score values were calculated using the DrugZ program.28 Genes whose sgRNAs were significantly enriched by dexamethasone relative to DMSO treatment are shown in red, and those with sgRNAs significantly depleted are in blue. Genes associated with the GC signal pathway, mTORC1 pathway, Ras pathway, and autophagy are depicted in red, green, blue, and purple, respectively. (D) Venn diagram illustrating genes significantly enriched by dexamethasone relative to DMSO treatment (FDR <0.1) in NALM-6 and MUTZ-5 cells. Dex, dexamethasone.](https://ash.silverchair-cdn.com/ash/content_public/journal/bloodneoplasia/1/2/10.1016_j.bneo.2024.100015/2/m_bneo_neo-2024-000200-gr1.jpeg?Expires=1767851994&Signature=tDu8uPKuMlI1PYyhy7cCIuQS3vDm-DNGhpRv5jLl4UVSYumR1qm2smNUgYQLjZ9JYcRao~RxNJriRfqa6t0zgfflFEFNSmihfr8nydb6hxrZbowU8f8-sR~5UX0rAemOK5Oo76QLf5m2WGsZLWex8QdTxXxQIYLCijafQjLtY15cls3AZJqsrs2om7d5KXeLPSEsB7Bejrw2WiezAj32mJ0rCiBkkSlb7d3mZx2oatBoEe0H4XZjm7H85Y~6aU7rwyat8j6nWU-nkLujzzDQ9Am5DuhSFZ1y386FXo3MSCqg6JywfBm8C2MQjPiKuzl5NmjPdWn1j8jWmo76jjSgLg__&Key-Pair-Id=APKAIE5G5CRDK6RD3PGA)


![Genome-wide CRISPR/Cas9 screens identify negative regulators of the mTORC1 pathway as key modulators of B-ALL cell sensitivity to dexamethasone. (A) Schematic of the CRISPR screen strategy used to identify regulators of GC-mediated signaling pathways. (B) Dot plots representing β-scores26 of 19 114 genes in the presence or absence of dexamethasone. Genes whose β-scores show statistically significant changes upon drug treatment (false discovery rate [FDR] <0.1) are depicted in red. (C) CRISPR screen data showing gene-level ranking based on differential enrichment of sgRNAs by dexamethasone vs DMSO treatment. Normalized z score values were calculated using the DrugZ program.28 Genes whose sgRNAs were significantly enriched by dexamethasone relative to DMSO treatment are shown in red, and those with sgRNAs significantly depleted are in blue. Genes associated with the GC signal pathway, mTORC1 pathway, Ras pathway, and autophagy are depicted in red, green, blue, and purple, respectively. (D) Venn diagram illustrating genes significantly enriched by dexamethasone relative to DMSO treatment (FDR <0.1) in NALM-6 and MUTZ-5 cells. Dex, dexamethasone.](https://ash.silverchair-cdn.com/ash/content_public/journal/bloodneoplasia/1/2/10.1016_j.bneo.2024.100015/2/m_bneo_neo-2024-000200-gr1.jpeg?Expires=1768421590&Signature=2EdAnBvK~F4oL5K4rTqzXAudc-fFz237Y2FAvfiduW8ny0~UIOuhzleEqckisfeCdxEZ1sPzH63r0JLep5jLLy6bkFtSrWmsaa~wWXedl3WelYL8eUded4X2BIX~DDq6w8qdqjW2NXvZRce69lNEKLY7s7xHvLFyVGWrJ-qOsADbbNBb9cYodj4YC3ZBKx515CJhXldFGs8N49Z6brAEJMX4A517fe7jsX5cD9buMJMxY8uFp74d7PsiwAgIaD3E15DlgSVOODSpyiZJASEcT7C5mkYdMbraCVZUTSe9wVJSzohCbu8hY7M2hT440nlcyfM2M2nl3FHWHcqx-xSK2A__&Key-Pair-Id=APKAIE5G5CRDK6RD3PGA)
