Visual Abstract
TO THE EDITOR:
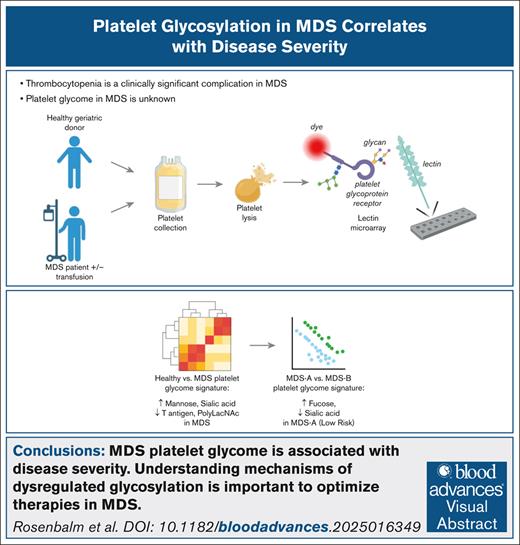
Thrombocytopenia is a common and clinically significant complication in patients with myelodysplastic syndromes (MDS), often leading to increased bleeding risk and decreased survival rates. Suppressed differentiation of megakaryocytic progenitor cells in MDS results in dysplastic, hypolobated megakaryocytes with impaired platelet production.1 Increased apoptosis of megakaryocytes and megakaryocyte progenitors, dysregulated thrombopoietin signaling, and increased platelet destruction also contribute to thrombocytopenia in MDS.2,3 Residual platelets exhibit abnormalities such as altered mean platelet volume, decreased ability to activate, and increased apoptosis.4 Despite supportive treatment with platelet transfusions and emerging therapies like thrombopoietin receptor agonists, the clinical management of severe thrombocytopenia remains a major challenge in MDS.
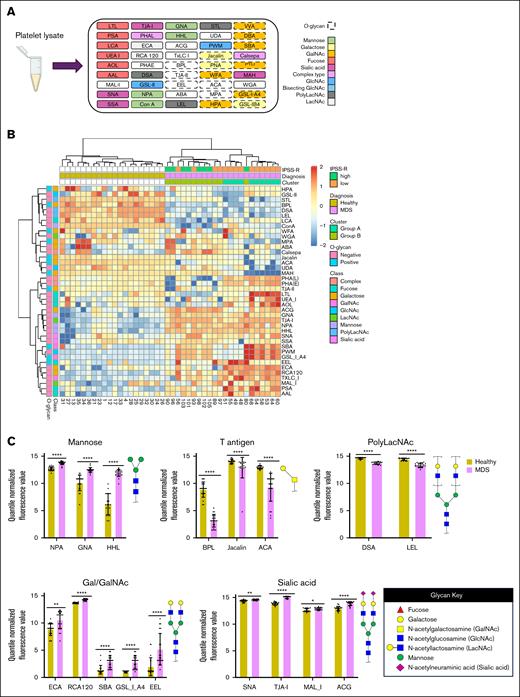
We and others have demonstrated that the ability of platelets to maintain hemostasis is intricately linked to the glycosylation of proteins that regulate various aspects of platelet biology, including production, life span, activation state, adhesion, and aggregation.5,6 However, the direct link between altered glycosylation of platelets and impaired platelet function in the context of MDS remains undefined. We performed a comprehensive analysis of glycoprotein structures using GlycoTechnica lectin microarrays (comprising 45 diverse lectins) to interrogate differences in glycan expression on inactivated platelet lysates isolated from whole blood of healthy donors and patients with MDS (Figure 1A).7 We quantified glycosylation patterns of platelets from age-matched healthy donors (n = 20; average age = 64 ± 11 years) and patients with MDS (n = 22; average age = 67 ± 15 years) across a spectrum of risk groups (supplemental Tables 1 and 2). No patients were actively receiving platelet transfusions. Unsupervised hierarchical clustering of lectin binding signals revealed distinct glycosylation patterns in patients with MDS compared to healthy donors (Figure 1B-C). Interestingly, patient 49, who received a bone marrow transplant before sample collection, exhibited a profile more similar to patients with MDS than healthy donors.
MDS platelets have altered glycan profiles. (A) Schematic diagram of lectin microarray. Lectins are color-coded based on their binding specificity. Created using BioRender.com. (B) Hierarchical heat map clustering of lectin microarray profiling of platelets collected from healthy individuals (n = 20) and patients with MDS (n = 22). Healthy individuals and patients with MDS were not matched based on sex. (C) Bar plots showing statistically significant changes in lectin binding between platelets collected from healthy individuals vs those with MDS. Binding of specific lectins is quantified based on their quantile normalized fluorescence values. Lectins are organized based on their selectivity for carbohydrate epitopes with example glycan substrates shown. ∗P < .05; ∗∗P < .01; ∗∗∗P < .001; and ∗∗∗∗P < .0001.
MDS platelets have altered glycan profiles. (A) Schematic diagram of lectin microarray. Lectins are color-coded based on their binding specificity. Created using BioRender.com. (B) Hierarchical heat map clustering of lectin microarray profiling of platelets collected from healthy individuals (n = 20) and patients with MDS (n = 22). Healthy individuals and patients with MDS were not matched based on sex. (C) Bar plots showing statistically significant changes in lectin binding between platelets collected from healthy individuals vs those with MDS. Binding of specific lectins is quantified based on their quantile normalized fluorescence values. Lectins are organized based on their selectivity for carbohydrate epitopes with example glycan substrates shown. ∗P < .05; ∗∗P < .01; ∗∗∗P < .001; and ∗∗∗∗P < .0001.
Patients with MDS exhibited diminished expression of some O-glycosylation markers, including tumor-associated T/Tn antigens (ACA, BPL, Jacalin). Conversely, patients with MDS displayed elevated levels of high-mannose glycans (HHL, GNA, and NPA), α2,3-sialylation (MAL_I, ACG), α2,6-sialylation (SNA, TJA-I), and galactose/N-acetylgalactosamine (Gal/GalNAc) structures (ECA, RCA120, SBA, GSL_I_A4, EEL). Principal component analysis also revealed a clear separation between healthy and MDS samples, indicating significant disparities in their glycan profiles (supplemental Figure 1A). Despite the heterogeneity and limited sample size of the patient population, there were distinct glycosylation patterns observed in platelets in patients with MDS compared to healthy donors characterized by alterations in several glycan structures including Core 1 O-linked and high-mannose N-linked glycans (supplemental Figure 1B-C). Decreased O-linked glycans and increased high-mannose glycans could contribute to the abnormal platelet production, activation, and life span observed in MDS.8 MDS platelets also demonstrated higher sialylation, which may allude to a compensatory mechanism to increase the circulating life span of patient platelets.9
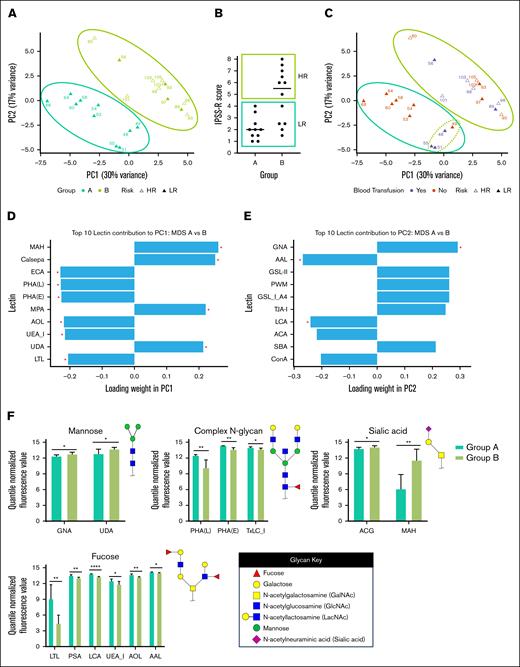
We then asked whether platelet glycan structures were associated with disease status. Principal component analysis of MDS samples broadly separated patients into 2 subgroups: Group A and Group B (Figure 2A). Group A was comprised of low-risk patients (based on the Revised International Prognostic Scoring System), whereas Group B included low-risk and high-risk individuals (Figure 2B and supplemental Table 2). The low-risk Group A showed separation into 2 subgroups, where patients 48, 49, 51, and 55 clustered distinctly from the other Group A patients (Figure 2C). Patients 48, 51, and 55 required red blood cell transfusions, highlighting the need for clinical intervention. In contrast, the remaining patients in Group A did not require transfusion therapy, suggesting a milder disease phenotype. These findings indicate that platelet glycomes may reveal clinically meaningful differences within low-risk patients with MDS. Specifically, it identified a subgroup with possible intermediate-risk features not captured by standard Revised International Prognostic Scoring System scoring, demonstrating the potential of glycomic profiling to refine risk stratification and guide treatment decisions.
Specific lectin signatures drive subgrouping of MDS platelets. (A) Principal component analysis (PCA) plot displaying clustering of platelets collected from patients with MDS based on their glycan profiles. Samples were grouped into Group A (teal) and Group B (green). Patients’ disease statuses are defined as intermediate/low/very low risk (“LR,” closed triangle) or high/very-high risk (“HR,” open triangle) based on Revised International Prognostic Scoring System (IPSS-R) score. (B) Distribution of IPSS-R scores for patients in Group A and Group B. (C) PCA plot displaying clustering of platelets collected from patients with MDS based on transfusions received within 4 weeks of sample collection. Patient 49 received a bone marrow transplant. (D-E) Graphs showing statistically significant (indicated by ∗) drivers of variance for each principal component, PC1 (D) and PC2 (E), among glycan profiles from MDS platelets. (F) Bar plots showing statistically significant changes in lectin binding between platelets collected from healthy individuals vs those with MDS. Binding of specific lectins is quantified based on their quantile normalized fluorescence values. Lectins are organized based on their selectivity for carbohydrate epitopes with example glycan substrates shown. ∗P < .05; ∗∗P < .01; ∗∗∗P < .001; and ∗∗∗∗P < .0001.
Specific lectin signatures drive subgrouping of MDS platelets. (A) Principal component analysis (PCA) plot displaying clustering of platelets collected from patients with MDS based on their glycan profiles. Samples were grouped into Group A (teal) and Group B (green). Patients’ disease statuses are defined as intermediate/low/very low risk (“LR,” closed triangle) or high/very-high risk (“HR,” open triangle) based on Revised International Prognostic Scoring System (IPSS-R) score. (B) Distribution of IPSS-R scores for patients in Group A and Group B. (C) PCA plot displaying clustering of platelets collected from patients with MDS based on transfusions received within 4 weeks of sample collection. Patient 49 received a bone marrow transplant. (D-E) Graphs showing statistically significant (indicated by ∗) drivers of variance for each principal component, PC1 (D) and PC2 (E), among glycan profiles from MDS platelets. (F) Bar plots showing statistically significant changes in lectin binding between platelets collected from healthy individuals vs those with MDS. Binding of specific lectins is quantified based on their quantile normalized fluorescence values. Lectins are organized based on their selectivity for carbohydrate epitopes with example glycan substrates shown. ∗P < .05; ∗∗P < .01; ∗∗∗P < .001; and ∗∗∗∗P < .0001.
We determined 20 key lectins that contributed to the separation between Groups A and B (supplemental Table 3). For the first principal component (PC1) (30% variance), we found that the top 5 significantly contributing lectins were MAH (sialyl Tn antigen), Calsepa (complex N-glycans), ECA (LacNAc), PHA(L) (branched N-glycans), and PHA(E) (bisecting GlcNAc N-glycans) (Figure 2D). For PC2 (17% variance), we found that the top 5 significantly contributing lectins were GNA (terminal mannose), AAL (fucose), LCA (core N-glycan fucose), jacalin (T antigen), and STL (LacNAc) (Figure 2E). We also analyzed lectin binding epitope preferences between the subgroups. Of the significantly different binding lectins between Group A and Group B, we found that they could be grouped into epitope specificities. In lower-risk patients in Group A, the platelets contained reduced high-mannose structures (GNA, UDA), more branched/bisected N-glycans (PHA(L), PHA(E), TxLC_I), reduced α2,3-sialic acid capped glycans (ACG, MAH), and increased fucosylation among many lectins (Figure 2F). Further studies into the detailed structures of fucose and sialic acid-containing glycoconjugates may reveal links between these structures and disease pathology. We acknowledge that although our results are statistically robust, the effect sizes of lectin binding may limit interpretability in single-patient analyses.
We examined the cytogenetic and mutation profile of patients in Group A vs Group B. Four out of 5 patients with TET2 mutations were found in Group A, whereas there was a higher incidence of complex karyotypes (>3 cytogenetic abnormalities) and mutations in genes associated with higher-risk disease such as TP53 and STAG2 in patients in Group B (supplemental Tables 1 and 2).10,11 However, patients with normal karyotype cytogenetics and/or mutations in genes such as SF3B1 were found in both groups. Follow-up studies of statistically-powered larger cohorts will be required to define links between specific mutations (eg, TET2 vs TP53) and the glycan profile. We also examined whether the treatment status at the time of platelet collection could impact glycosylation patterns. Interestingly, patients under observation with stable disease were found in both groups (supplemental Tables 1 and 2). Furthermore, patients in Group B under observation showed platelet glycosylation patterns similar to patients receiving DNA hypomethylating agents. These results suggest that distinct patterns of platelet glycosylation are a fundamental characteristic of MDS that are associated with disease risk. Our results are in agreement with other studies demonstrating links between glycosylation abnormalities and disease risk in MDS: Chrastinová et al12 reported aberrant fucosylation (AAL) of glycoproteins and galactosylated N-glycans (ECL) in the blood plasma of patients with low-risk and high-risk MDS respectively; van Spronsen et al13 found increased α2,6 sialylation and high-mannose glycans on hematopoietic stem and progenitor cells from patients with high-risk MDS compared to patients with low-risk disease.
These results suggest that dysregulation of platelet glycosylation serves as a potential future MDS biomarker that will require investigation of expanded cohorts. Altered glycosylation may identify those patients with low-grade disease by standard molecular and hematologic criteria but who may be at risk for poorer than expected outcomes. Patients who show a prolonged clinical response to hypomethylating agents (HMAs) may exhibit reversion to a normal phenotype. In addition to platelets, the role of glycosylation changes in other cell types in MDS, such as red blood cells and neutrophils, that may serve as additional potential biomarkers, remains unknown. However, glycans are critical regulators of stem cell self-renewal and differentiation and serve as key surface markers of pluripotency.14,15 If glycan alterations arise at the hematopoietic stem and progenitor cell level in MDS, it is reasonable to expect that glycan changes may be detectable across multiple hematopoietic lineages.
Altered glycosylation may explain other clinical observations. For example, stringent fucosylation is required for expression and maintenance of specific blood group antigen decorations of circulating cells.16 Because decreased expression of blood group antigens is commonly observed in patients with hematological malignancies, the reduction of fucosylated epitopes in higher-risk patients may contribute to inconsistent expression of blood group antigens in these individuals.17 Moreover, the altered platelet glycome may reflect the transcriptional, translational, or post-translational status of the megakaryocytes from which platelets are derived, as dysplastic megakaryocytes are commonly observed in MDS. Our observations warrant further studies to elucidate the specific genetic and molecular mechanisms causing aberrant glycosylation in MDS platelets and to use this knowledge to develop novel therapeutic approaches designed to modulate platelet production and function.
Acknowledgments: The authors thank the patients and their families. The authors would also like to thank Versiti Blood Research Institute Bioinformatics Shared Resources (RRID: SCR_025993) for their computational analysis.
This work was supported by P01HL151333 (to K.M.H. and J.T.Y.L.) and by National Cancer Institute grant P30CA016056 involving the use of Clinical Research Services and the Biorepository Laboratory Services Shared Resources at Roswell Park Comprehensive Cancer Center. K.E.R. was supported by the Program for Medical GlycoSciences (K12HL141954 to K.M.H. and J.T.Y.L.).
The Visual Abstract was created in BioRender.com. Nemeth, M. (2025) https://BioRender.com/mwq1t5z. Figure 1C was created in BioRender.com. Nemeth, M. (2025) https://BioRender.com/h96h190.
Contribution: J.T.Y.L. designed the study and experiments; T.L.W. and V.L.A. performed experiments; K.E.R., T.L.W., T.G., D.H., G.S., S.Z., and M.J.N. analyzed the data; K.M.H. and E.A.G. provided critical reagents; and K.E.R., T.L.W., and M.J.N. wrote the manuscript with editorial contributions and review from all authors.
Conflict-of-interest disclosure: E.A.G. reports receiving honoraria for Continuing Medical Education (CME) from Aplastic Anemia and MDS International Foundation, MedscapeLive, MediCom Worldwide, MJH Health, American Society of Hematology, Myelodysoplastic Syndromes International Foundation, and Physicians Educational Resource; consultancy for AbbVie, Alexion Pharmaceuticals, Apellis Pharmaceuticals, Takeda Oncology, Astex Pharmaceuticals/Taiho Oncology, Alexion/AstraZeneca Rare disease, Celgene/Bristol-Myers Squibb, CTI Biopharma, Novartis, Partner Therapeutics, Picnic Health, and Servier; and research support from Alexion Pharmaceuticals, Apellis, Astex /Otsuka Pharmaceuticals, Blueprint Medicines, Celldex Pharmaceuticals, Genentech Inc, and NextCure, Inc. M.J.N. declares research support from Imago Biosciences and Taiho Oncology. The remaining authors declare no competing financial interests.
Correspondence: Michael J. Nemeth, Roswell Park Comprehensive Cancer Center, Elm and Carlton St, Buffalo, NY 14263; email: michael.nemeth@roswellpark.org; and Joseph T. Y. Lau, Roswell Park Comprehensive Cancer Center, Elm and Carlton St, Buffalo, NY 14263; email: joseph.lau@roswellpark.org.
References
Author notes
K.E.R. and T.L.W. contributed equally to this work.
All data are available upon request from the corresponding authors, Michael J. Nemeth (michael.nemeth@roswellpark.org), and Joseph T. Y. Lau (joseph.lau@roswellpark.org).
The full-text version of this article contains a data supplement.


