Key Points
Hierarchical risk stratification acknowledges poor survival of 92% of TP53mut MNs compared with 36.5% by WHO-5 and 80.7% by ICC.
MDS-EB1 and -EB2 share biological characteristics and have equally poor survival, regardless of allelic status, supporting their integration.
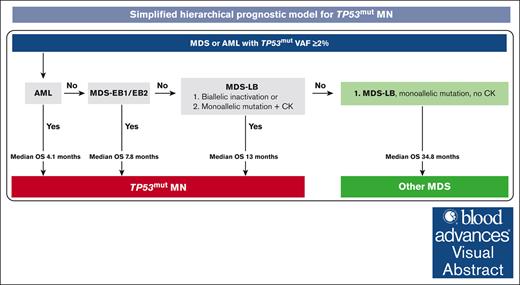
Visual Abstract
This retrospective analysis aimed to provide evidence-based risk stratification of TP53-mutated (TP53mut) myeloid neoplasms (MNs). Of 580 MNs harboring TP53mut with variant allele frequency (VAF) ≥2%, 219 (37.8%), 194 (33.4%), 92 (15.9%), and 75 (12.9%) were classified as acute myeloid leukemia (AML), myelodysplastic syndrome (MDS) with low blasts (MDS-LB), MDS with excess blasts (MDS-EB)-2, and -EB1 according to the revised fourth edition of the World Health Organization (WHO) classification, respectively. Hierarchical analysis identified the following 4 risk groups with distinct survival: (1) MDS-LB, (2) MDS-EB1/EB2/AML VAF <10%, (3) MDS-EB1/EB2 VAF ≥10%, and (4) AML VAF ≥10%. We next evaluated the impact of allelic status, VAF, and complex karyotype (CK). In our cohort, the significance of biallelic status was limited to MDS with <5% blasts and not for blasts 5% to 9%, as proposed by the International Consensus Classification (ICC), or 5% to 19%, as proposed by the fifth edition of the WHO (WHO-5). MDS-EB1 and -EB2 with VAF ≥10% had comparable survival (9.6 vs 7.2 months; P = .12), regardless of allelic status. Contrary to the ICC proposal, MDS-EB1/EB2 with VAF <10% and CK had poor survival compared with those without CK, comparable to MDS-EB1/EB2 with VAF ≥10% (5.6 vs 26.2 vs 6.3 months; P = .003). Survival of TP53mut AML was poor (median 3.9 months) regardless of allelic/CK status. Thus, using ICC or WHO-5 may underestimate prognosis of MDS with blasts 5% to 19% and 5% to 9%, respectively. Collectively, the hierarchical model acknowledges poor survival of 91.9% TP53mut MDS and AML compared with 36.5% and 80.7% by WHO-5 and ICC, respectively.
Introduction
Optimal management of patients with myeloid neoplasm (MN) with TP53 mutations (TP53mut) continues to remain problematic, primarily because the disease can be intrinsically resistant to both cytotoxic- and transplant-based strategies. Alterations in TP53 occur in 5% to 13% of de novo myelodysplastic syndrome (MDS)1-6 and 8% to 11% of acute myeloid leukemia (AML) cases.7,8 This is further enriched to 20% to 40% in older patients with MDS and AML.9,10TP53 alterations are more prevalent in MN with a complex karyotype (CK) or those featuring the loss of 17p, 5q, or 7q,11,12 being reported in 70% to 80% of these cases.2,13-16
Acknowledging the extremely poor prognosis of these cases, the recently updated World Health Organization (WHO) classification (fifth edition, hereafter referred as WHO-5)17 and the International Consensus Classification (ICC)18 recognize TP53mut MDS and MN as distinct entities, respectively, with a stated goal to provide an impetus for further research and facilitate clinical trial enrollment. However, there are critical differences between the 2 classification systems regarding allelic status, variant allele frequency (VAF), and blast categories.19,20 These disparities have the potential to either underestimate or overestimate the prognostic risk, leading to inconsistencies in disease classification and treatment decisions.
Among the prominent areas of differences, AML with mutated TP53 (TP53mut AML) is recognized as a distinct subentity by the ICC, but not by the WHO-5. Both the WHO-5 and ICC acknowledge the poor outcomes associated with multihit TP53mut and have, therefore, excluded single-hit TP53mut MDS, although the proposed bone marrow (BM) and peripheral blood (PB) blast cutoffs vary. In the WHO-5, MDS with biallelic TP53 inactivation is considered a single entity irrespective of blast percentage, whereas cases with monoallelic TP53 inactivation in MDS (BM blast <20%) are excluded from this category altogether. However, in the ICC, TP53mut MDS/AML (BM or peripheral blasts 10%-19%) are included irrespective of the hit status, whereas only multihit TP53mut MDS (BM or peripheral blasts 0%-9%) are included in TP53mut MN. Moreover, the ICC differs from WHO-5 in mandating the VAF threshold of ≥10% and considering the presence of CK in the context of 1 TP53mut (VAF <50%) as a “multihit equivalent.”
This lack of consensus is rooted in the paucity of data, with pivotal studies being limited by the inclusion of certain morphologies2,15 or genetic features.18 To shed light on these discrepancies and pinpoint critical clinical variables, we performed comprehensive analysis of the impact of VAF percentage, TP53 hit status, blast percentage, cytogenetic features, and previous cytotoxic therapies in a large cohort of MN harboring TP53mut with an aim to provide evidence to resolve these differences.
Methods
We analyzed all MN harboring TP53mut (VAF ≥2%, n = 580) evaluated at the Mayo Clinic (USA) and South Australia Health Network (Australia) between February 2002 and August 2023. At the time of diagnosis, TP53mut were identified by next-generation sequencing panels on BM aspirates that covered at least exons 4 to 11. The respective databases captured information including diagnostic characteristics, treatments, allogeneic stem cell transplantation, and long-term follow-up. Integrated genomic analyses, including conventional karyotyping (n = 577), interrogation for acquired copy number variations (CNV; n = 112) based on next-generation sequencing data (n = 30), single-nucleotide polymorphism arrays (n = 16), and fluorescence in situ hybridization (n = 66), were performed in a subset of patients. Additional methodological details of the testing are provided in the supplemental Methods.
TP53mut MN were classified according to the revised fourth edition of the WHO classification using the BM and PB blast percentage cutoff criteria (WHO-4R); however, all MDS subcategories with no increase in blasts (<5% BM and <2% PB blasts) were combined as “MDS with low blasts” (MDS-LB). TP53mut MN were retrospectively classified using the ICC18 and WHO-5 (final version, published online 23 March 2024) classifications.
Statistical methods
Comparisons were performed using Mann-Whitney U test for nonnormally distributed variables. Fisher exact test was used to determine associations between categorical variables. Overall survival (OS) was calculated from the date of MN diagnosis to the date of last follow-up or the date of death. Kaplan-Meier estimations were used, with comparisons made using log-rank tests. Cox regression multivariable analysis with backward selection was undertaken. P values <.05 were considered statistically significant. Nonparametric, multivariate Conditional Inference Trees (CIT) analysis was used to determine the true effect of a predictor, that is, the effect of a predictor if all other effects are simultaneously considered. In CIT, predictors are only included if the predictor is significant (ie, if these predictors are necessary). Risk-stratification models were compared using Harrell c-index.21
Results
Study population and characteristics
Of the 580 MN cases with TP53mut MN, MDS (n = 361, 62.2%) was the most prevalent diagnosis followed by AML (n = 219, 37.8%), as expected. The median age of the patients was 68.6 (interquartile range [IQR], 62-75) years, and 63.1% (n = 366) were male. Detailed patient-, disease-, and treatment-related characteristics are described in supplemental Table 1.
Characterization of TP53 allelic status and WHO-4R categories
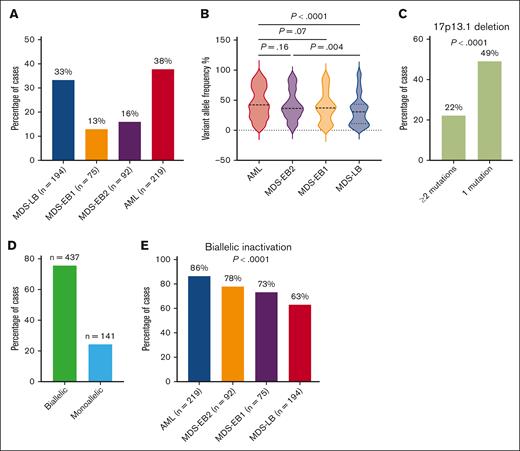
BM and peripheral blast percentages were used to classify TP53mut MN according to WHO-4R: AML (n = 219; 37.8%), MDS-LB (n = 194; 33.4%), MDS with excess blasts (MDS-EB)1 (n = 75; 12.9%), and MDS-EB2 (n = 92; 15.9%; Figure 1A). Clinical features of these 4 distinct groups are summarized in supplemental Table 2. The median TP53mut VAF was 36.9% (IQR, 20-59) and was significantly higher in TP53mut AML (42%; IQR, 24-70) and MDS-EB2 (36.2%; IQR, 24.3-51.8) compared with MDS-LB (31%; IQR, 11.1-43.1; Figure 1B). TP53mut VAF was higher in MDS-EB1 (37.0%; IQR, 19.0-54.0) compared with MDS-LB, but it did not reach the prespecified statistical significance (P = .057).
Characterization of TP53mut MNs. (A) TP53mut AML was highly prevalent followed by MDS-LB, -EB2, and -EB1, respectively. (B) The VAF was significantly higher in AML and MDS-EB2 compared with MDS-LB. (C) 17p loss was more prevalent in cases with single TP53mut. (D) Most TP53mut cases exhibited biallelic inactivation. (E) The frequency of biallelic inactivation increased with higher blast categories.
Characterization of TP53mut MNs. (A) TP53mut AML was highly prevalent followed by MDS-LB, -EB2, and -EB1, respectively. (B) The VAF was significantly higher in AML and MDS-EB2 compared with MDS-LB. (C) 17p loss was more prevalent in cases with single TP53mut. (D) Most TP53mut cases exhibited biallelic inactivation. (E) The frequency of biallelic inactivation increased with higher blast categories.
TP53 CNV analysis was available in 19.3% (n = 112) of the cases, and it confirmed loss of heterozygosity (LOH) of the TP53 wild-type allele in 92.8% (n = 64) of the evaluable cases with 17p13.1 deletion on karyotype. CNV analysis also detected LOH or copy neutral LOH (cnLOH) in 22.5% (n = 9) of the 40 evaluable cases without 17p deletion on karyotype.
Most cases harbored a single TP53mut (71.2%, n = 413), whereas 167 (28.8%) had 2 or more mutations with VAF ≥2%. Not unexpectedly, enrichment of 17p loss was observed in cases with 1 TP53mut compared with cases with 2 or more TP53mut (49.1% vs 22.2%; P < .0001; Figure 1C). Furthermore, 32.4% (n = 67) of the cases with single TP53mut without 17p loss had a VAF ≥50%. For the purpose of this study, biallelic inactivation was defined as (1) ≥2 mutations each with VAF ≥2%; (2) single TP53mut VAF ≥2% plus 17p loss detected on karyotype, fluorescence in situ hybridization, or single-nucleotide polymorphism; or (3) single TP53mut VAF ≥50% without 17p loss, whereas monoallelic inactivation was defined as single TP53mut VAF <50% without 17p loss. In summary, 437 (75.6%) and 141 (24.4%) of 578 evaluable cases had biallelic and monoallelic inactivation, respectively (Figure 1D; supplemental Figure 1).
Next, we assessed the interaction between TP53 allelic inactivation and disease categories based on blast percentage. Biallelic TP53 inactivation progressively increased from MDS-LB to AML (Figure 1E), with 63.2%, 73.3%, 78%, and 86.3% of cases of MDS-LB, MDS-EB1, MDS-EB2, and AML presenting biallelic TP53 inactivation (P < .0001).
WHO-4R categories and TP53mut VAF are key predictors for survival of TP53mut MN
The median OS of the cohort was 8.0 months (Figure 2A). OS was significantly different between the 4 WHO-4R categories: MDS-LB (n = 194; 33.4%) had a significantly longer survival compared with TP53mut MDS-EB1 (n = 75, 12.9%), MDS-EB2 (n = 92, 15.9%), and AML (n = 219, 37.8%; Figure 2B). These findings were confirmed using transplant-censored survival analysis, which revealed significantly longer survival in MDS-LB compared with MDS-EB1, MDS-EB2, and AML (supplemental Figure 2).
Risk stratification of TP53mut MN using CIT analysis. (A) The median OS for patients with TP53mut MN was 8 months. (B) The median OS was progressively shorter with increasing blast percentage categories. (C) Patients with a TP53mut VAF >8% had significantly poorer median OS compared with those with a VAF ≤8%. (D) CIT analysis identified the following 4 distinct risk groups with distinct survival: MDS-LB, MDS-EB1 or -EB2 or AML with VAF <10%, MDS-EB1 or -EB2 with VAF ≥10%, and AML VAF ≥10%. 95% CI, 95% confidence interval.
Risk stratification of TP53mut MN using CIT analysis. (A) The median OS for patients with TP53mut MN was 8 months. (B) The median OS was progressively shorter with increasing blast percentage categories. (C) Patients with a TP53mut VAF >8% had significantly poorer median OS compared with those with a VAF ≤8%. (D) CIT analysis identified the following 4 distinct risk groups with distinct survival: MDS-LB, MDS-EB1 or -EB2 or AML with VAF <10%, MDS-EB1 or -EB2 with VAF ≥10%, and AML VAF ≥10%. 95% CI, 95% confidence interval.
We identified TP53mut VAF 8% as the optimal cutoff to predict OS based on maximally selected rank statistics analysis (supplemental Figure 3). VAF >8% was associated with significantly inferior survival compared with VAF ≤8% (7.5 vs 17.4 months, P < .0001; Figure 2C). Given the small fraction of patients (n = 11, 1.9%) harboring TP53mut VAF 8% to 10% and to align with the published ICC VAF threshold, the VAF threshold was rounded up to ≥10% for the subsequent analyses. Next, we performed time-dependent univariate analysis for survival (supplemental Table 3). WHO-4R categories, CK, monosomal karyotype (MK), del 5q, del 7q, TP53mut VAF, and TP53 allelic status were associated with poor survival. Multivariable analysis using statistically and clinically meaningful variables revealed that the WHO-4R category, TP53mut VAF, biallelic inactivation, and del 7q were independently associated with inferior survival (supplemental Table 4). In contrast, CK, MK, and del 5q were not independently associated with survival.
Next, we performed a CIT analysis as an unbiased multivariate nonparametric approach to recursive partitioning to select splits and identify groups, using P values to determine splits in the data. The CIT analysis included variables such as WHO-4R categories (AML, MDS-EB2, MDS-EB1, MDS-LB), CK, biallelic or monoallelic TP53 inactivation, del 5q, and del 7q. In our cohort, 83% (n = 479) of the patients had either CK or MK, with most (86%; n = 411) exhibiting both. CK significantly co-occurred with MK (odds ratio, 63.4; 95% confidence interval, 31.6-139.8; P < .0001). Therefore, MK was excluded from the CIT analysis.
Combining the WHO-4R categories and TP53mut VAF cutoffs, the CIT analysis classified the cohort into the following 4 hierarchical groups with distinct survival: (1) MDS-LB; (2) MDS-EB1/EB2 and AML with VAF <10%; (3) MDS-EB1/EB2 with VAF ≥10%; and (4) AML with VAF ≥10% (Figure 2D). Next, we systematically evaluated the independent impacts of allelic status, CK, and VAF thresholds in each of these categories.
MDS-LB
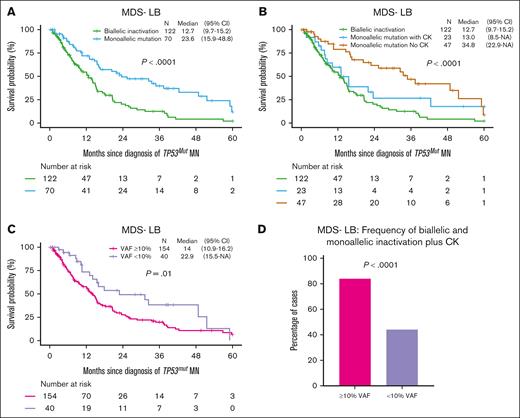
In MDS-LB, biallelic inactivation (n = 122, 63.5%) was common compared with monoallelic inactivation (n = 70, 36.5%) and median OS of MDS-LB with biallelic inactivation was significantly poor compared with monoallelic inactivation (12.7 vs 23.6 months; P < .0001; Figure 3A). However, median OS of MDS-LB with biallelic and monoallelic inactivation with CK was not significantly different (12.7 vs 13.0 months; P = .12; Figure 3B). The median OS of monoallelic inactivation without CK was superior to the monoallelic inactivation with CK (34.8 vs 13.0 months, P = .08; Figure 3B), although it failed to reach the prespecified statistical significance. Next, we evaluated the prognostic impact of TP53mut VAF as 79.4% of the patients with MDS-LB had TP53mut VAF ≥10%, which was associated with significantly poor survival compared with MDS-LB VAF <10% (14 vs 22.9 months; P = .01; Figure 3C). The survival difference between the 2 groups is probably driven by enrichment of biallelic and monoallelic inactivation plus CK in cases with TP53mut VAF ≥10% (84% vs 44%; P < .0001; Figure 3D). Previously, VAF 20% was found to be associated with poor outcome22,23; therefore, we compared survival using the VAF cutoff of 20%. The median OS of the MDS-LB VAF 20% was significantly poorer compared with VAF <20% (13 vs 21.9 months; P = .01; supplemental Figure 4A), probably driven by the enrichment of biallelic inactivation in cases with VAF 20% (supplemental Figure 4B), as the median OS of MDS-LB biallelic (12.1 vs 17.9 months; P = .25), monoallelic with CK (7.9 vs 15.5 months; P = .26), and monoallelic without CK (37.3 vs 33.4 months; P = .94) with VAF 20% was not significantly different compared with their counterparts with VAF <20%, respectively (supplemental Figure 4C-E). In summary, MDS-LB could be further stratified based on allelic status, the presence of CK, or VAF ≥10%.
Further stratification of TP53mut MDS-LB by allelic status, CK, and VAF. (A) The median OS for patients with biallelic TP53 inactivation was significantly shorter compared with those with monoallelic inactivation. (B) Among patients with TP53 monoallelic inactivation, those with CK had a significantly shorter median OS compared with those without CK. Notably, their OS was comparable to that of patients with biallelic inactivation. (C) The median OS for patients with TP53mut VAF ≥10% was significantly poor compared with those with a VAF <10%. (D) Biallelic TP53 inactivation was more prevalent in cases with a VAF ≥10% compared with those with a VAF <10%. 95% CI, 95% confidence interval; NA, not available.
Further stratification of TP53mut MDS-LB by allelic status, CK, and VAF. (A) The median OS for patients with biallelic TP53 inactivation was significantly shorter compared with those with monoallelic inactivation. (B) Among patients with TP53 monoallelic inactivation, those with CK had a significantly shorter median OS compared with those without CK. Notably, their OS was comparable to that of patients with biallelic inactivation. (C) The median OS for patients with TP53mut VAF ≥10% was significantly poor compared with those with a VAF <10%. (D) Biallelic TP53 inactivation was more prevalent in cases with a VAF ≥10% compared with those with a VAF <10%. 95% CI, 95% confidence interval; NA, not available.
MDS-EB1, MDS-EB2, and AML with VAF <10% are a distinct group
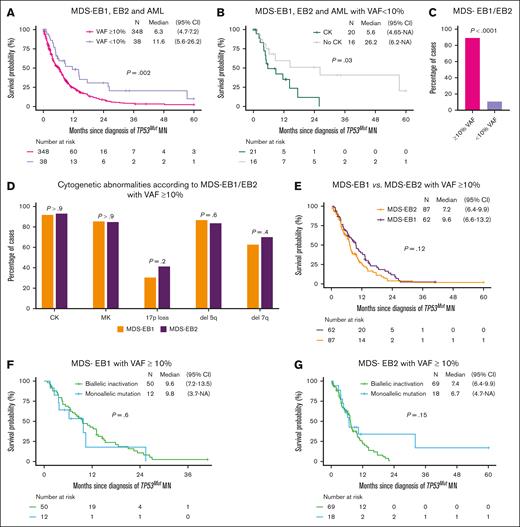
Overall, 38 cases (9.8%) of MDS-EB1 (n = 13), MDS-EB2 (n = 5), and AML (n = 20) had TP53mut VAF <10%, which was associated with longer OS compared with their counterparts with VAF ≥10% (11.6 vs 6.3 months, P = .002; Figure 4A). CK was observed in 55.6% of these TP53mut MN with VAF <10% and was associated with significantly poorer survival (5.6 vs 26.2 months, P = .03; Figure 4B). Thus, MDS-EB1, EB2, and AML with VAF <10% and CK have poorer survival comparable to their counterparts with VAF ≥10% (5.6 vs 6.3 months; Figure 4A-B). However, the median OS of MDS-EB1, EB2 with VAF <10% without CK was comparable to monoallelic MDS-LB without CK (26.2 vs 34.8 months; P = .44) (supplemental Figure 5).
Biological characteristics and survival in TP53mut MDS-EB1 and -EB2 with VAF ≥10%. (A) The median OS of patients with MDS-EB1, MDS-EB2, and AML with a VAF ≥10% was significantly poor compared with those with a VAF <10%. (B) Patients with MDS-EB1, MDS-EB2, or AML with a VAF <10% and a CK had significantly poorer median OS compared with those without CK. (C) Most MDS-EB1 and EB2 cases had VAF ≥10%. (D) The frequency of high-risk cytogenetic features, including CK, MK, 17p loss, deletion 5q, and deletion 7q, was similar between MDS-EB1 and MDS-EB2 cases with VAF ≥10%. (E) The median OS of patients with MDS-EB1 was comparable to that of patients with MDS-EB2. (F) For MDS-EB1 cases with VAF ≥10%, the median OS was similar between those with monoallelic and biallelic inactivation. (G) Similarly in MDS-EB2 cases with VAF ≥10%, the median OS was comparable between monoallelic and biallelic inactivation. 95% CI, 95% confidence interval; NA, not available.
Biological characteristics and survival in TP53mut MDS-EB1 and -EB2 with VAF ≥10%. (A) The median OS of patients with MDS-EB1, MDS-EB2, and AML with a VAF ≥10% was significantly poor compared with those with a VAF <10%. (B) Patients with MDS-EB1, MDS-EB2, or AML with a VAF <10% and a CK had significantly poorer median OS compared with those without CK. (C) Most MDS-EB1 and EB2 cases had VAF ≥10%. (D) The frequency of high-risk cytogenetic features, including CK, MK, 17p loss, deletion 5q, and deletion 7q, was similar between MDS-EB1 and MDS-EB2 cases with VAF ≥10%. (E) The median OS of patients with MDS-EB1 was comparable to that of patients with MDS-EB2. (F) For MDS-EB1 cases with VAF ≥10%, the median OS was similar between those with monoallelic and biallelic inactivation. (G) Similarly in MDS-EB2 cases with VAF ≥10%, the median OS was comparable between monoallelic and biallelic inactivation. 95% CI, 95% confidence interval; NA, not available.
TP53mut MDS-EB1 and MDS-EB2 with VAF ≥10% have comparable biological characteristics and survival
TP53mut MDS-EB1 and MDS-EB2 constituted 28.8% of the cases (n = 167) of TP53mut MN, and most (n = 149, 89.3%) had TP53mut VAF ≥10% (Figure 4C). Poor-risk cytogenetic features, such as CK (91.9% vs 93.1%; P > .9), MK (85.5% vs 85.1%; P > .9), 17p loss (30.6% vs 41.4%, P = .2), del 5q (87.1% vs 83.7%, P = .64), and del 7q (62.9% vs 69.8%, P = .4), were comparable between MDS-EB1 and MDS-EB2 with VAF ≥10% (Figure 4D). Survival of TP53mut MDS-EB1 and EB2 with VAF ≥10% was comparable (9.6 vs 7.2 months, P = .12; Figure 4E).
Most MDS-EB1 with VAF ≥10% (n = 62) had biallelic inactivation (n = 50, 80.6%), whereas 19.4% of the cases (n = 12) had monoallelic inactivation. Intriguingly, there was no survival difference in monoallelic vs biallelic inactivation (9.8 vs 9.6 months; P = .6; Figure 4F). Similarly, biallelic inactivation (79.3%, n = 69) was prevalent in MDS-EB2 with VAF ≥10% (n = 87), whereas 20.7% of the cases (n = 18) had monoallelic inactivation. In line with MDS-EB1, the survival of monoallelic and biallelic TP53 inactivation was comparable (6.7 vs 7.4 months, P = .15) in MDS-EB2 (Figure 4G).
TP53mut AML with VAF ≥10% is a distinct subgroup with extremely poor survival
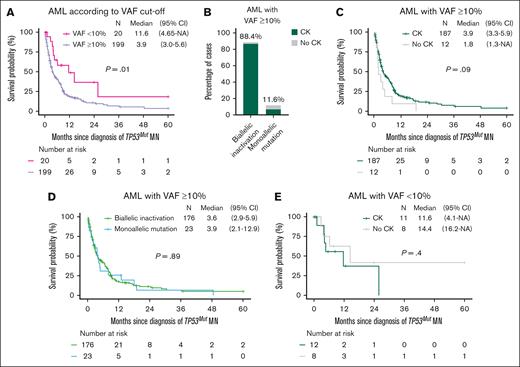
Most (n = 199; 91.9%) TP53mut AML had VAF ≥10% and was associated with significantly shorter survival of 3.9 months (Figure 5A). Striking enrichment of CK (94.0%; n = 187) and biallelic inactivation (88.4%, n = 176) was observed in TP53mut AML with VAF ≥10% (Figure 5B). Survival of AML was equally poor irrespective of the allelic and CK status (Figure 5C-E).
Survival outcome of TP53mut AML was poor irrespective of allelic status and CK status. (A) The median OS of TP53mut AML with VAF ≥10% was significantly poor compared with AML with a VAF <10%. (B) CK was more prevalent in AML cases with biallelic compared with those with monoallelic inactivation. In AML with a VAF ≥10%, the median OS was similar in (C) cases with or without CK, and (D) biallelic and monoallelic inactivation. (E) Similarly in AML with a VAF <10%, median OS was comparable regardless of CK status. 95% CI, 95% confidence interval; NA, not available.
Survival outcome of TP53mut AML was poor irrespective of allelic status and CK status. (A) The median OS of TP53mut AML with VAF ≥10% was significantly poor compared with AML with a VAF <10%. (B) CK was more prevalent in AML cases with biallelic compared with those with monoallelic inactivation. In AML with a VAF ≥10%, the median OS was similar in (C) cases with or without CK, and (D) biallelic and monoallelic inactivation. (E) Similarly in AML with a VAF <10%, median OS was comparable regardless of CK status. 95% CI, 95% confidence interval; NA, not available.
WHO-5 and ICC classification systems did not classify a substantial proportion of MN harboring TP53mut
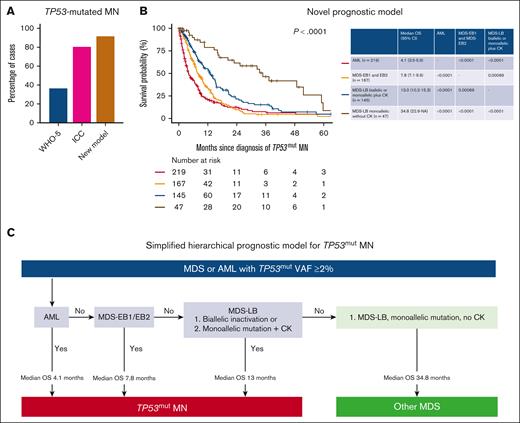
Next, we evaluated the proportion of the cohort that were classified as TP53mut MN by the recently proposed WHO-5 and ICC criteria. The WHO-5 classification is restricted only to MDS with biallelic TP53 inactivation (BM and peripheral blasts <20%). Therefore, 219 TP53mut AML (37.8%) could not be classified further using WHO-5. The WHO-5 classification is also restricted to biallelic TP53 inactivation. This criterion further excluded 148 cases (25.5%). In summary, using the WHO-5 would acknowledge only 211 cases (36.4%) as TP53mut MN (Figure 6A; supplemental Figure 6).
Hierarchical classification schema for TP53mut MNs. (A) The distribution of TP53mut MN cases classified by WHO-5, ICC, and the proposed model. (B) The novel prognostic model identifies 4 distinct categories of TP53mut MN with significant differences in survival outcomes. (C) Simplified hierarchical prognostic model for TP53mut MN. NA, not available.
Hierarchical classification schema for TP53mut MNs. (A) The distribution of TP53mut MN cases classified by WHO-5, ICC, and the proposed model. (B) The novel prognostic model identifies 4 distinct categories of TP53mut MN with significant differences in survival outcomes. (C) Simplified hierarchical prognostic model for TP53mut MN. NA, not available.
The ICC includes multihit TP53mut MDS (BM and blood blasts 0%-9%), TP53mut MDS/AML (BM or blood blasts 10%-19%), and TP53mut AML (BM or blood blast ≥20%, extramedullary disease or pure erythroid leukemia) only if VAF ≥10%. Thus, 78 cases (13.4%) with TP53mut VAF 2 to <10% were not classified as TP53mut MN. Second, 34 (5.9%) were MDS <10% blast with single-hit TP53mut, which would similarly be excluded. Overall, using the ICC criteria would result in the inclusion of 468 cases (80.7%) (Figure 6A; supplemental Figure 7).
We, then, performed an analysis using the model proposed in Figure 2B. The median OS of TP53mut MDS-LB biallelic inactivation, MDS-LB monoallelic inactivation with CK, MDS-EB1/EB2/AML VAF <10% with CK, MDS-EB1 and EB2 with VAF ≥10%, and AML VAF ≥10% was poor (Figure 6B).
In our cohort of 580 patients, only 16 cases (2.8%) had MDS-EB1/EB2 (1.4%, n = 8) or AML (1.4%, n = 8) with VAF <10% without CK. Considering the relatively small number of cases and that VAF calculation is semiquantitative with interlaboratory variation, to make the model simpler and useful in clinical practice, we have included these cases in the final proposed hierarchical model (Figure 6C).
Collectively, the proposed model would acknowledge a poor outcome in 531 (91.9%) of 578 evaluable cases (Figure 6A). In contrast, the 55 cases (9.5%) of MDS-LB monoallelic inactivation without CK and MDS-EB1/EB2 VAF <10% without CK had longer survival (Figure 6B). Furthermore, transplant-censored survival significantly differed between the 4 groups (supplemental Figure 8). Combining these findings, we provide a simplified hierarchical prognostic model of TP53mut MN (Figure 6D).
Discussion
Clarity in the classification of TP53mut MN is expected to streamline diagnostic protocols and treatment decisions, advance research, and facilitate trial enrollment.24 However, discrepancies in the classification may lead to overutilization of tests, diagnostic delays, discordance in therapeutic decisions, and overlaps or gaps in clinical trial design. Using a large international cohort of TP53mut MN, we provide an evidence-based classification that can be readily used in a clinic. Such a reconsideration is warranted as 64% and 19% MN harboring TP53mut would not be classified as TP53mut MN by WHO-5 and ICC, respectively.
In defining TP53mut MN, whether the blast percentage or allelic status takes precedence has been a matter of debate.2,3,17,18,22,23 Both ICC and WHO-5 mandate the demonstration of biallelic TP53 inactivation for blasts 0% to 9%. For 10% to 19% blasts (MDS/AML), single-hit is sufficient to classify TP53mut MN by ICC, whereas WHO-5 requires biallelic TP53 inactivation. Our study demonstrates comparable biological characteristics and survival of TP53mut MDS-EB1 and -EB2 with VAF ≥10%, whereas the clinical features and survival of MDS-LB and MDS-EB1/EB2/AML VAF <10% in the absence of CK are significantly distinct from these 2 entities.
The proposed risk-stratification model provides compelling evidence for the following: (1) MDS-LB with monoallelic mutation plus CK is associated with significantly poor survival. (2) Survival of MDS-EB1 and EB2 is poor regardless of allelic status and supports combining MDS-EB1 and EB2 regardless of the allelic status. Stengel et al also observed poor outcome of MDS with ≥5% blasts with biallelic alterations and suggested considering these patients equivalent to AML due to the similarly difficult treatment strategy, although their data reveal that blast count affects prognosis.3; (3) TP53mut AML is associated with extremely poor survival. Our findings have several implications. First, the exclusion of monoallelic MDS-EB1 (n = 20; 3.4% of the cohort) and monoallelic MDS-EB1/EB2 (n = 40; 6.9%) from the ICC and WHO-5 classification of TP53mut MN and MDS, respectively, poses the risk of undertreatment, such as not offering potentially curative allogeneic stem cell transplantation and excluding the patients from clinical trials. Second, MDS-EB1/EB2/AML cases with VAF <10%, which are excluded from the ICC criteria, are associated with poor survival in the presence of CK. Third, survival of MDS-LB with monoallelic TP53mut inactivation without CK was significantly better compared with biallelic and monoallelic TP53 inactivation with CK. Hence, acknowledging the CK as a “biallelic equivalent” would minimize diagnostic delays and identify patients at risk of poor survival. Our analysis also provides impetus for future refinements of WHO-5 and ICC.
A critical difference in inference between ours and the pivotal study of Bernard et al2 is that, in their study, favorable outcome of monoallelic TP53mut was found regardless of blast percentage. In contrast, in our study, the favorable outcome was limited to monoallelic MDS-LB without CK. The exact reasons behind the discrepancy are not clear. The proportion of cases with biallelic inactivation were 75.6% in this study and 66.9% in the study of Bernard et al those of LOH/cnLOH in cases without 17p deletion on karyotype were 22.5% in this study and ∼25% in the study of Bernard et al. However, our cohort consisted of TP53mut MDS and AML, and therapy-related MN were highly enriched (48%). In contrast, the study of Bernard et al was limited to MDS and only ∼11% of TP53-mutated cases were therapy related.
Another potential, but unlikely, explanation is the real-world nature of our study. Specifically, CNV analysis was performed in only 19% of the cases, and it validated LOH of the TP53 wild-type allele in 93% of the evaluable cases with 17p13.1 deletion on karyotype. Moreover, CNV analysis also detected LOH or cnLOH in 22.5% (n = 9) of the 40 evaluable cases without 17p deletion on karyotype, and all these cases had CK. However, these findings need further validation in a larger cohort with a comprehensive CNV analysis. Thus, our analysis could have missed some cases of biallelic inactivation. However, impact on overall analysis is expected to be limited as most cases (n = 501; 86.4%) had 2 mutations (n = 167), single mutation with VAF ≥50% (n = 158), single mutation with VAF <50% plus 17p13.1 deletion on metaphase karyotype (n = 112), or CK (n = 64). We could have missed, biallelic inactivation in few of the remaining 66 cases with single TP53mut VAF <50% without 17p deletion and CK.
The prognostic implications of various empiric TP53mut VAF thresholds have been actively debated, and a VAF ≥20% was associated with a poor outcome.22,23 In other studies, TP53mut VAF >40% was associated with poor outcome, especially in cases treated with cytarabine-based intensive chemotherapy. However, these studies included limited number of TP53mut cases and did not evaluate the interaction between VAF, allelic status, blast percentage, and CK status.22,25 Bernard et al2 reported a distinct interaction between VAF and allelic status in TP53mut MDS. For example, they reported a poor outcome of TP53mut multihit across ranges of VAF and that multihit patients with VAF <11% had a dismal outcome, although in monoallelic patients poor outcome was restricted to MDS with VAF ≥22%.2 Similarly, Bahaj et al observed a poor outcome of monoallelic TP53mut with VAF >23% compared with those with VAF <23%, reported to behave biologically similar to biallelic inactivation.23 Notably, in our cohort, biallelic and monoallelic inactivation with CK were enriched in MDS-LB with VAF 20% compared with VAF <20% and in VAF ≥10% compared with VAF <10%. It is noteworthy that the prognostic impact of CK was restricted to monoallelic MDS-LB, MDS-EB1/EB2, and AML cases with VAF <10% but not in the other subgroups, suggesting a complex interaction between blast, allelic status, VAF, and CK. The burden of biallelic inactivation and CK progressively increased from MDS-LB, MDS-EB1, and MDS-EB2 to AML. In addition, most MDS-LB, MDS-EB1/EB2, and AML cases with biallelic inactivation harbored CK (81.1%, 94.9%, 95.8%, and 97.9%, respectively). CK was also more prevalent in monoallelic mutated cases of MDS-EB1, -EB2, and AML compared with MDS-LB (58.6% vs 32.9%; P = .003). The increasing burden of biallelic inactivation and CK in both biallelic and monoallelic cases, especially in higher blast MDS and AML compared with MDS-LB, may explain why CK had prognostic impact in monoallelic MDS-LB but not in higher blast MDS and AML. Stengel et al also reported poor prognostic impact of CK in cases with <5% blast but not in cases with 5% blasts.3 Collectively, these results indicate a close interaction between blast percentage, allelic status, CK, and VAF. Therefore, analysis focusing solely on VAF without accounting for other parameters could lead to misleading conclusions.
The results of our retrospective study spanning >20 years should be interpreted in this context. Both the diagnostic workup and choice and sequencing of therapies reflected clinical decision-making at the time and were influenced by institutional workflows. The study cohort therefore lacks the diagnostic and treatment homogeneity of some studies,15 but it reflects routine clinical practice. The clinically reported VAF threshold has evolved over the years and is currently at ≥2% at our centers. Therefore, our study is unable to shed light on cases with TP53mut cases with VAF <2%. In addition, the proportion of VAF <10%, especially in the MDS-EB1/EB2/AML categories, was small. Whether the allelic status further stratifies this, akin to the MDS-LB cohort, needs to be determined. Moreover, although all consecutive TP53mut MN patients were included in the analyses, therapy related myeloid neoplasm cases may have been enriched given our referral pattern and interest.13,14 Finally, validation of the presented novel hierarchical evidence-based model in an independent large cohort would improve clinical adaptability.
Acknowledging these limitations, our analysis of the largest cohort, to our knowledge, encompassing all MN cases harboring TP53mut provides clarification in multiple areas of dissensus, provides evidence-based hierarchical prognostic model, and informs future revisions of the guidelines.
Acknowledgments
The authors thank their patients and their families. The authors gratefully acknowledge the support of the South Australia Cancer Research Biobank.
M.V.S. was supported by Bridget Kiely Clinician Career Development in Transplant Research and Kennedy Bacon Funds for Leukemia and Bone Marrow Transplant Research. D.H. was supported by National Health and Medical Research Council (NHMRC)/Medical Research Future Fund Investigator grant MRF1195517, Cancer Australia grant APP2013617, and the Leukemia Foundation Australia. S.K. was supported by NHMRC Investigator grant GNT2007739. D.T. was supported by the Commonwealth Serum Laboratories (2020 Centenary Fellowship), Australian Medical Research Future Fund grants 1201012, 2024427, 2008972, NHMRC grant 2023/GNT2029809, the Leukemia & Lymphoma Society (LLS 6619-21; LLS 6650-23; chronic myelomonocytic leuekmia Special Initiative), Snowdome Foundation (cofunder LLS 6619-21, LLS 6650-23), and the Leukaemia Foundation (cofunder LLS 6619-21, LLS 6650-23). M.M.K. was supported by the Medical Research Future Fund (MRF2030689).
Authorship
Contribution: M.V.S. and D.H. designed the study, contributed patients, analyzed the data, and wrote the manuscript; K.H., A. Baranwal, Z.K.P., C.T., S.S., V.G., S. Khanna, D.R., and M.M.K collated the data and edited the manuscript; A. Brown, H.S.S., R.H., and C.N.H. performed and analyzed mutational profiling; M.V.S., D.L., P.G., and D.H. performed and analyzed cytogenetic analysis; D.C. performed hematopathology analysis; A.A.-K., K.B., M.R.L., W.J.H., P.B., T.B., D.T.Y., M.M.P., J.M.F., N.G., C.Y.A.Y., H.A., A.A.M., D.T., and A.T. contributed patients and edited the manuscript; S. Kumar, A.O., and D.A.A. provided critical inputs and edited the manuscript; C.H.K. performed statistical analysis and edited the manuscript; and all authors agreed to the final version of the manuscript.
Conflict-of-interest disclosure: M.V.S. receives research funding to the institution from Astellas, Celgene, and Marker Therapeutics. D.H. is a member of the board of directors or advisory committees of AbbVie and Novartis. A.A.-K. provides research support to Novartis and Astex. M.M.P. is a member of the board of directors or advisory committees of Stemline Therapeutics and receives research funding from Kura Oncology. P.G. is a member of the advisory board of AbbVie. N.G. is a member of the advisory board for DISC Medicine and Agios. The remaining authors declare no competing financial interests.
Correspondence: Mithun Vinod Shah, Department of Hematology, Mayo Clinic Rochester, 200 1st St SW, Rochester, MN 55906; email: shah.mithun@mayo.edu; and Devendra Hiwase, Department of Haematology, Royal Adelaide Hospital and Precision Medicine Theme, South Australian Health and Medical Research Institute, Adelaide, SA 5000, Australia; email: devendra.hiwase@sa.gov.au.
References
Author notes
Additional methods and data can be found in the supplemental Methods. Original data are available on request from the corresponding authors, Mithun Vinod Shah (shah.mithun@mayo.edu) or Devendra Hiwase (devendra.hiwase@sa.gov.au).
The full-text version of this article contains a data supplement.

