Key Points
Renal impairment and enhanced venous thrombosis in Townes AS mice mimic similar complications in humans with SCT.
Nephropathy and increased size of venous thrombi in Townes AS mice are associated with localized sickling of SCT RBCs.
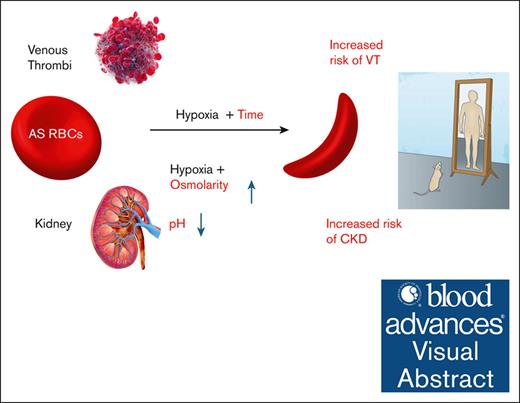
Visual Abstract
Sickle cell trait (SCT) is present in participants who possess a single copy of the βS-globin gene mutation. Although most affected individuals are asymptomatic, SCT is a well-established risk factor for venous thrombosis and renal complications, including chronic and end-stage kidney disease. After prolonged hypoxia, SCT red blood cells (RBCs) can undergo sickling, and hypoxia-mediated RBC sickling can be enhanced by cellular dehydration, hyperosmolarity, and/or acidosis. Some or all of these conditions may be encountered in the nidus of venous thrombi and in the medulla of the kidney. We sought to determine whether Townes sickle trait (AS) mice develop kidney dysfunction and manifest enhanced venous thrombosis. We demonstrated that the harsh environment within the inner medulla induces RBC sickling in vitro and in vivo and is associated with kidney-related pathologies, including impaired urinary concentration, albuminuria, and declining renal function, closely mimicking those seen in human SCT. In the inferior vena cava model of venous thrombosis, extreme and prolonged hypoxia in the core of RBC-rich venous thrombi resulted in irreversible RBC sickling and larger clots in Townes AS mice than AA controls (littermates expressing hemoglobin A only). Our results support the use of Townes AS mice in future studies investigating mechanisms of venous thrombosis and chronic kidney disease in SCT.
Introduction
Sickle hemoglobin (Hb; HbS) results from a single nucleotide substitution in the β-globin gene (βS). Individuals who are homozygous for HbS are affected by sickle cell anemia, one of several symptomatic forms of sickle cell disease (SCD). Heterozygous carriers of HbS are said to have sickle cell trait (SCT). Systematic analyses of large cohort studies have established that SCT is a risk factor for a limited number of complications, including venous thrombosis (VT) and chronic kidney disease (CKD).1-6 Although the relative risk for these complications is modest, the population-attributable risks are significant, given the estimated 300 million individuals with SCT worldwide.7,8
Hypoxia-induced HbS polymerization leading to red blood cell (RBC) sickling is the proximate cause of all clinical manifestations of sickle hemoglobinopathies. Multiple SCD-related complications have been associated with chronic hemolysis, stress reticulocytosis, or hyposplenism, none of which are observed in SCT.9-11 However, all complications of SCT must also ultimately be traceable back to the β-globin mutation and, presumably, the resultant RBC sickling. The degree and duration of hypoxia required to induce sickling of SCT RBCs are much greater than in SCD due to the lower intraerythrocyte HbS concentration, which ranges between 25% and 45%.12 Nonetheless, prolonged exposure of SCT RBCs to profound hypoxia, such as in the nidus of venous thrombi, could result in RBC sickling. Furthermore, hypoxia-mediated sickling and decreased RBC deformability can be enhanced by local hyperosmolarity and/or acidosis that may be encountered in the inner medulla of the kidney13 or in actively exercising anaerobic skeletal muscle.14
The mechanism(s) accounting for the increased risk of VT and CKD in SCT are poorly understood. This is partly due to the poor characterization of preclinical models of SCT that recapitulate these complications. The objective of this study was therefore to determine whether Townes mice expressing single copies of normal human β-globin (HbA) and HbS (hereafter referred to as AS mice) manifest kidney dysfunction and a greater propensity to VT than littermate controls expressing HbA only (AA mice).
Methods
Animals
The generation of non–sickle cell (AA) and sickle cell (SS) Townes mice expressing both human α- and β-globin genes (βA and βS forms) knocked into the mouse locus has been previously described.15,16 At age 4 weeks, mice were weaned, and the number of inherited copies of either βA or βS was confirmed by genotyping. Mice expressing exclusively human βA served as genetic controls (AA), and mice with 1 copy of βA and 1 copy of mutant βS served as sickle cell trait (AS). Experimental AA and AS mice were generated by crossing AA and AS mice and were used for VT experiments between ages 8 and 12 weeks. For longitudinal renal function analysis, mice entered the study at age 8 weeks and were followed through age 40 weeks. All animal studies were approved by the Animal Care and Use Committees of the University of North Carolina at Chapel Hill and the University of Alabama at Birmingham, in compliance with National Institutes of Health guidelines. Blood was obtained from the inferior vena cava (IVC) of AA and AS mice at the indicated time points. Hematologic parameters were measured on an Element HT5 cell counter (Heska, Loveland, CO).
IVC stasis model of VT
The IVC stasis model of VT was performed in male mice, as previously described.17,18 Mice were anesthetized by intraperitoneal injection of ketamine (100 mg/kg) and xylazine (10 mg/kg). A midline laparotomy incision was made, and the bowel was externalized and wrapped in wetted gauze. The IVC and adjacent aorta were mobilized by blunt dissection. Side branches were ligated using 5-0 Prolene suture. Back branches were cauterized by diathermy. The IVC was then permanently ligated using 5-0 Prolene suture material. Intraoperative buprenorphine was administered at a dose of 0.05 mg/kg. The peritoneum and skin were closed using 4-0 nonabsorbable monofilament suture material. At 24 hours after IVC ligation, the thrombus was removed and weighed. The operator was blinded with respect to the genotype of mice. Only male mice were used because the presence of additional uterine and ovarian side branches makes female mice unsuitable. Ligation of uterine and ovarian IVC side branches can lead to pathological organ necrosis.19
Thrombi generated in the IVC stasis model were also used to determine whether severe hypoxia was present in the nidus of the clot using the EF5 Hypoxia Detection Kit (Millipore). AA mice (n = 2) received a tail vein injection of EF5, a 2-nitroimidazole derivative, before complete IVC ligation. EF5 preferentially accumulates in severely hypoxic cells (partial pressure of oxygen [pO2] < 10 mm Hg) by forming adducts with cellular macromolecules.20 After thrombus harvesting, mouse monoclonal antibody ELK3-51 conjugated to Alexa Fluor 488 (supplied in the kit) was then used to detect the EF5 adducts in cells within the clot, according to the manufacturer’s instructions.
Western blotting
To address whether differences in thrombus composition could explain the difference in thrombus size in AS mice, western blotting of thrombus lysates was performed as previously described17 and documented in the supplemental Methods.
Clot contraction assay
Clot contraction of whole blood was performed ex vivo as previously described,21,22 with the addition of a hypoxic challenge. Blood was drawn from the IVC of anesthetized mice into syringes preloaded with 3.8% sodium citrate (final ratio 1:9) and transferred to an oxygen control cabinet (Coy Lab Products) maintained at a pO2 of 20 mm Hg. Whole blood from AA and AS mice was added to siliconized wells (Sigmacote, SL2-100ML; Sigma-Aldrich) of a 96-well plate (CLS3695; Sigma-Aldrich) to ensure clot integrity and prevent adhesion to the well. Blood was incubated in hypoxic conditions in the chamber for 4 hours at 37°C. Clotting was then initiated by adding 3.75-μL CaCl2 (final, 10 mM; C1016; Sigma-Aldrich), 7.5-μL tissue factor (2 pM; Dade Innovin, B4212-40; Siemens Healthcare, Erlangen, Germany), and 11.5-μL Hepes buffered saline (20-mM HEPES [N-2-hydroxyethylpiperazine-N′-2-ethanesulfonic acid], 150-mM NaCl, pH 7.4), which was gently mixed with 127.5 μL of whole blood. The microplate was incubated at 37°C for 1 hour to allow clot formation and contraction. Clots were then removed and weighed. Enumeration of RBCs in the serum was performed after dilution in 3.8% sodium citrate (1:1 dilution) using a Heska cell counter.
Electron microscopy
Clot morphology was evaluated using scanning and transmission electron microscopy, as described in the supplemental Methods.
Deformability and sickling of RBCs under hypoxia
RBC deformability, expressed as the elongation index (EI), was measured by ektacytometry using the Laser Optical Rotational Red Cell Analyzer (RR Mechatronics, The Netherlands). EI is defined as the longitudinal dimension of the RBC along the axis of applied shear stress divided by the transverse dimension of the cell along the same axis. In the Oxygenscan mode, EI is monitored during a cycle of constantly applied shear stress (∼30 Pa at 37°C), whereas the sample is subjected to a continuously decreasing pO2, initially at ∼150 mm Hg and dropping to ∼20 mm Hg over 22 minutes, followed by a reoxygenation phase lasting 8 minutes. Standard Oxygenscan conditions were also modified to evaluate the effect of concomitant hyperosmolality and/or acidosis, as previously described.13
GFR
Longitudinal kidney function assessment was performed in 18 AS and 18 age-matched AA mice (1 day before metabolic cage studies), starting at age 8 weeks. We evaluated only male mice because we previously demonstrated significant sex differences in CKD associated with sickle cell nephropathy.23,24 Glomerular filtration rate (GFR) was measured at 4-week intervals over 40 weeks, using transdermal MX GFR monitors (MediBeacon Inc) and transcutaneous measurement of a fluorescein isothiocyanate–labeled sinistrin technique (0.15 mg per gram of body weight; MediBeacon Inc). Elimination kinetic curves were used to determine the half-life of fluorescein isothiocyanate–labeled sinistrin and calculate GFR (normalized to body weight), as previously described.25
Urine collection and analysis
Metabolic cage studies were performed at 4-week intervals up to 40 weeks, starting at age 8 weeks. Mice (n = 18 per genotype) were allowed to adapt to metabolic cages for 1 day before the collection of 24-hour urine samples, as previously described.26 All urine analyses were performed on 24-hour urine samples. Urine osmolality was determined using a vapor pressure osmometer (Model 5600; ELITech Group, France). Urinary protein concentration was measured using the Bradford assay (BioRad Laboratories, CA). Urinary concentrations of kidney injury markers were measured using enzyme-linked immunosorbent assay (ELISA) for mouse albumin (Mouse Albumin ELISA kit; Aviva System Biology, CA) and kidney injury marker 1 (KIM-1; KIM-1 [TIM-1] Mouse ELISA kit; Abcam, United Kingdom).
Histology
Terminal tissue collection was performed after whole-body phosphate-buffered saline perfusion. The right kidney, isolated from mice aged 40 weeks (n = 5 AA; n = 6 AS), was immersed in 10% formalin, embedded in paraffin, sectioned (4-μm thick), and stained with Masson trichrome, hematoxylin and eosin, and Prussian blue using standard protocols. Kidney sections were evaluated blindly for glomerular sclerosis, glomerular congestion, interstitial fibrosis, and iron accumulation, according to the criteria used for quantifying changes in renal structures, as previously described.26-28 Details of kidney histological analysis are provided in the supplemental Methods.
Statistical analysis
Statistical analysis was performed using GraphPad Prism (version 10.2.2). Data were analyzed using 2-way analysis of variance with mixed effect analysis with Bonferroni post hoc test, unpaired Student t test (for normally distributed data), or Mann-Whitney U nonparametric test. Results were expressed as means ± standard error of mean (SEM), with P value <.05 considered statistically significant.
Results
Age- and genotype-dependent hematologic profiles
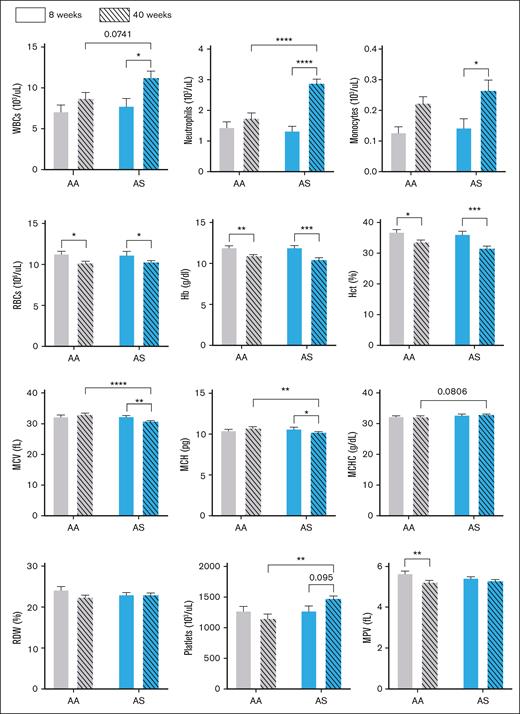
Given that mice were followed until age 40 weeks in our natural history studies of kidney disease, we characterized the hematologic profiles of AA and AS male mice at ages 8 and 40 weeks. By high-performance liquid chromatography, human HbS accounted for 30.1% of total Hb expressed in AS animals. As shown in Figure 1, RBC, white blood cell (WBC), and platelet counts in 8-week-old AA and AS mice were indistinguishable. However, an age-dependent anemia, manifested by lower Hb, hematocrit, and RBC counts, was evident in both AA and AS mice at age 40 weeks. RBCs in AS mice were smaller (lower mean corpuscular volume) at this time point, albeit without any change in RBC Hb concentration (mean corpuscular Hb concentration). The WBC count and differential, as well as the platelet count, were equivalent in 8-week-old AA and AS mice. However, by age 40 weeks, increased WBC (due to increased numbers of neutrophils and other myeloid lineage cells) and platelet counts were observed in AS mice.
Age-dependent hematologic changes in control (AA) and sickle trait (AS) mice. Hematology profiles for AA (gray bars) and AS mice (blue bars) are shown for mice (n = 6-10) aged 8 weeks (open bars) and 40 weeks (striped bars). Values are shown as mean ± SEM. ∗P < .05; ∗∗P < .01; ∗∗∗P < .001; ∗∗∗∗P < .0001. Hct, hematocrit; MCH, mean corpuscular Hb; MCHC, mean corpuscular Hb concentration; MCV, mean corpuscular volume; MPV, mean platelet volume; RDW, red cell distribution width.
Age-dependent hematologic changes in control (AA) and sickle trait (AS) mice. Hematology profiles for AA (gray bars) and AS mice (blue bars) are shown for mice (n = 6-10) aged 8 weeks (open bars) and 40 weeks (striped bars). Values are shown as mean ± SEM. ∗P < .05; ∗∗P < .01; ∗∗∗P < .001; ∗∗∗∗P < .0001. Hct, hematocrit; MCH, mean corpuscular Hb; MCHC, mean corpuscular Hb concentration; MCV, mean corpuscular volume; MPV, mean platelet volume; RDW, red cell distribution width.
Enhanced VT in AS mice is accompanied by RBC sickling within the clot
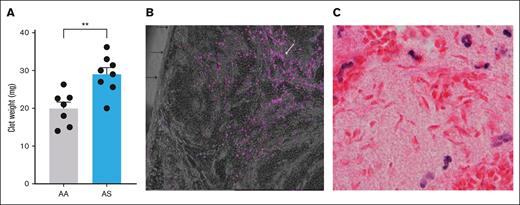
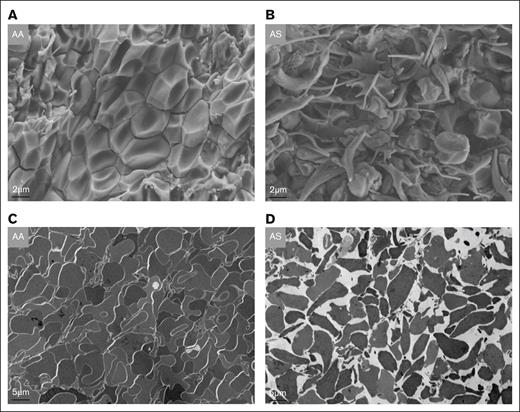
Baseline levels of thrombin-antithrombin complexes in platelet-free plasma did not differ between 10- to 12-week-old AA (n = 9) and AS mice (n = 10; 9.7 ± 1.2 vs 11.8 ± 1.9 ng/mL), indicating the absence of systemic coagulation activation, in contrast to SS mice.29,30 After 24 hours of IVC stasis, thrombus weight was significantly increased (P < .01) in AS mice (n = 8; mean ± SEM, 29.0 ± 1.7 mg) compared with AA controls (n = 7; mean ± SEM, 20.0 mg ± 1.7 mg; Figure 2A). Detection of tissue hypoxia using the EF5 detection kit demonstrated fluorescent cells in the central zones of the clot, indicating the presence of severe hypoxia (pO2 < 10 mm Hg) in the nidus of the IVC thrombi (Figure 2B). Because RBCs rely solely on anaerobic metabolism (glycolysis) to generate adenosine triphosphate, they do not form the adducts detected by this method. However, the zone of most extreme hypoxia in the clot nidus of AS mice was accompanied by the presence of sickled RBCs in hematoxylin and eosin–stained paraffin sections (Figure 2C). By electron microscopy, typical polyhedrocytic RBCs were apparent in the core of the thrombus in AA mice (Figure 3A). In contrast, extensive RBC sickling was observed in the core of AS thrombi, with the presence of both fully and partially sickled RBCs (Figure 3B). Furthermore, transmission electron microscopy images indicated that the tight packing of RBCs in AA thrombi was markedly disrupted by RBC sickling in AS clots (Figure 3C and D, respectively).
Inferior vena cava thrombi in male AA vs AS mice. (A) Thrombus weight after 24 hours of IVC stasis in AA (n = 7) compared with AS mice (n = 8). (B) Demonstration of severe hypoxia (<10 mm Hg) in the nidus of an IVC clot from a control (AA) mouse, illustrated by the presence of fluorescent cells (white arrow) in the central zone of the thrombus. Individual cells are primarily leucocytes. Black arrows point to the IVC clot surface that abutted the IVC lumen in vivo. (C) Hematoxylin and eosin (H&E) staining showing sickled red cells in the innermost zone of an IVC thrombus from an AS mouse. ∗∗P < .01.
Inferior vena cava thrombi in male AA vs AS mice. (A) Thrombus weight after 24 hours of IVC stasis in AA (n = 7) compared with AS mice (n = 8). (B) Demonstration of severe hypoxia (<10 mm Hg) in the nidus of an IVC clot from a control (AA) mouse, illustrated by the presence of fluorescent cells (white arrow) in the central zone of the thrombus. Individual cells are primarily leucocytes. Black arrows point to the IVC clot surface that abutted the IVC lumen in vivo. (C) Hematoxylin and eosin (H&E) staining showing sickled red cells in the innermost zone of an IVC thrombus from an AS mouse. ∗∗P < .01.
EM images of inferior vena cava thrombi in AA vs AS mice. (A) Typical tightly packed polyhedrocytes in thrombi from AA mice as seen on scanning EM images. (B) In contrast, multiple sickled RBCs with extruding membrane spicules are visible in the core of a thrombus from an AS mouse alongside some nonsickled cells. (C-D) Transmission EM images illustrating tightly packed RBCs (“polyhedrocytes”) in a thrombus from an AA mouse, compared with the loose packing in a clot from an AS mouse. EM, electron microscopy.
EM images of inferior vena cava thrombi in AA vs AS mice. (A) Typical tightly packed polyhedrocytes in thrombi from AA mice as seen on scanning EM images. (B) In contrast, multiple sickled RBCs with extruding membrane spicules are visible in the core of a thrombus from an AS mouse alongside some nonsickled cells. (C-D) Transmission EM images illustrating tightly packed RBCs (“polyhedrocytes”) in a thrombus from an AA mouse, compared with the loose packing in a clot from an AS mouse. EM, electron microscopy.
Using western blotting, we determined whether differences in thrombus composition could explain the increased thrombus size in AS mice. To determine the relative abundance of platelets and neutrophils, thrombus tissue lysates from AA and AS mice were immunoblotted for the cell-specific markers CD41 and Ly6G, respectively. Densitometric analysis revealed that the platelet marker CD41 and the neutrophil marker Ly6G were not different in thrombi formed in AA and AS mice (supplemental Figure).
Prolonged hypoxia attenuates extrusion of AS RBCs from contracting clots
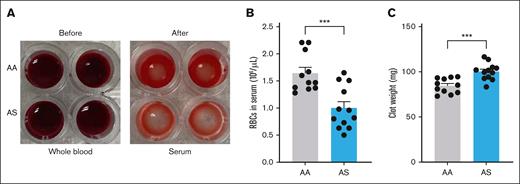
During platelet-mediated whole blood clot contraction, RBCs are extruded into the serum. We previously demonstrated that the number of RBCs extruded from AS clots formed under room air (pO2 ≈ 160 mm Hg) did not differ significantly from AA clots.21 To better mimic the oxygen concentration in the venous circulation and the prolonged severe hypoxia encountered by RBCs retained within the nidus of venous thrombi, the clot contraction assay was performed using whole blood preincubated in a hypoxia chamber at a pO2 of 20 mm Hg. In contrast to clot contraction performed in ambient air, the number of RBCs extruded from AS clots formed under hypoxic conditions was significantly reduced compared with the number extruded from AA clots (Figure 4A-B). Consequently, the weight of AS clots was significantly increased compared with AA clots (Figure 4C).
RBC extrusion during whole blood clot contraction. (A) Citrated whole blood was obtained from male or female AA (n = 11) and AS (n = 11) mice and was preincubated under hypoxic conditions (20 mm Hg for 4 hours) “before” the addition of tissue factor and calcium as described in “Methods.” The sample was incubated for a further 1 hour to allow clotting and retraction, “after” which RBCs extruded into the serum were enumerated. (B) Number of RBCs extruded into the serum during clot contraction. (C) Clot weights in AA and AS mice. ∗∗P < .01; ∗∗∗P < .001.
RBC extrusion during whole blood clot contraction. (A) Citrated whole blood was obtained from male or female AA (n = 11) and AS (n = 11) mice and was preincubated under hypoxic conditions (20 mm Hg for 4 hours) “before” the addition of tissue factor and calcium as described in “Methods.” The sample was incubated for a further 1 hour to allow clotting and retraction, “after” which RBCs extruded into the serum were enumerated. (B) Number of RBCs extruded into the serum during clot contraction. (C) Clot weights in AA and AS mice. ∗∗P < .01; ∗∗∗P < .001.
Nephropathy observed in AS mice closely mimics abnormalities of the kidney observed in humans with SCT
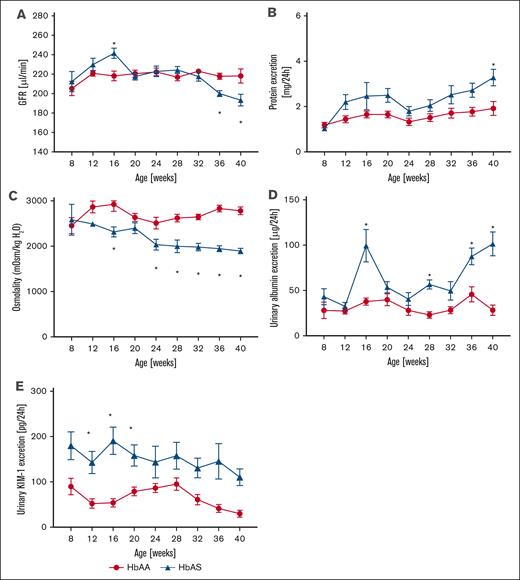
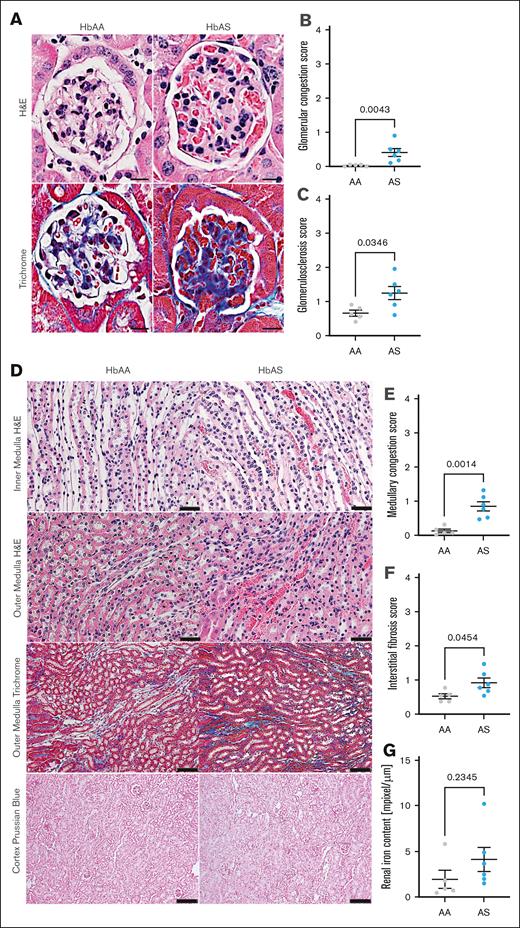
In a longitudinal study of kidney function in male AA and AS mice, we measured GFR and collected 24-hour urine samples every 4 weeks, from age 8 weeks through 40 weeks. Eight-week-old AS mice exhibited no differences in any of the measured parameters compared with AA controls. However, AS mice developed a moderate but statistically significant increase in GFR, peaking at age 16 weeks (Figure 5A). By 36 weeks, progressive loss of kidney function was evident in AS mice, as demonstrated by decreased GFR (Figure 5A), accompanied by a twofold increase in proteinuria at age 40 weeks (4.6 ± 1.1 vs 2.3 ± 0.4 mg/d; P < .05; Figure 5B). Urine osmolality, an indicator of urinary concentrating ability, progressively declined in AS mice, with statistically significant changes starting at 24 weeks compared with controls (1946 ± 63 vs 2672 ± 135 mOsm/kg at 40 weeks; P = .002; Figure 5C). Additionally, AS mice manifested progressive glomerular damage, as evidenced by albuminuria (Figure 5D). Histological analysis confirmed significant kidney hypertrophy and glomerular injury, including glomerular hypertrophy (5071 ± 188 vs 3443 ± 88 μm2; supplemental Table), vascular congestion (0.41 ± 0.12 vs 0.03 ± 0.01; P = .016; Figure 6A-B), and glomerulosclerosis (1.24 ± 0.19 vs 0.66 ± 0.09; P = .029; Figure 6A,C) in 40-week-old AS mice. Moreover, increased levels of urinary KIM-1, a marker of proximal tubular injury, were observed in AS mice throughout the duration of the study, with peak levels at 16 weeks (228.3 ± 32.6 vs 53.8 ± 8.5 pg/d, respectively; P < 0.05; Figure 5E). Histological analysis of renal medulla and tubular structures in 40-week-old AS mice showed significant tubular injury with congestion of the medullary vasa recta (0.83 ± 0.14 vs 0.11 ± 0.05; P = .001; Figure 6D-E), which was colocalized with interstitial fibrosis (0.95 ± 0.14 vs 0.55 ± 0.07; P = .045; Figure 6D,F) in the absence of significant tubular iron deposition (Figure 6D,G).
Longitudinal assessment of renal phenotype in male SCT (AS; n = 18, red lines) and genetic control (AA; n = 18, blue lines) mice. (A) Trajectory of GFR. (B) Urinary protein excretion over time. (C) Urinary osmolality over time. (D) Urinary albumin excretion over time. (E) Urinary KIM-1 excretion over time. Data are mean ± SEM. ∗P < .05; analysis by 2-way analysis of variance with mixed-effect analysis using Bonferroni post hoc test. Panel A, Pinteraction < .0001; Pgenotype = .9004; Page < .0001. Panel B, Pinteraction = .7011; Pgenotype = .0012; Page = .0224. Panel C, Pinteraction = .0469; Pgenotype < 0.0001; Page = 0.0001. Panel D, Pinteraction < .0001; Pgenotype < .0001; Page < .0001. Panel E, Pinteraction = .7150; Pgenotype < .0001; Page = .1897. KIM-1, kidney injury marker 1.
Longitudinal assessment of renal phenotype in male SCT (AS; n = 18, red lines) and genetic control (AA; n = 18, blue lines) mice. (A) Trajectory of GFR. (B) Urinary protein excretion over time. (C) Urinary osmolality over time. (D) Urinary albumin excretion over time. (E) Urinary KIM-1 excretion over time. Data are mean ± SEM. ∗P < .05; analysis by 2-way analysis of variance with mixed-effect analysis using Bonferroni post hoc test. Panel A, Pinteraction < .0001; Pgenotype = .9004; Page < .0001. Panel B, Pinteraction = .7011; Pgenotype = .0012; Page = .0224. Panel C, Pinteraction = .0469; Pgenotype < 0.0001; Page = 0.0001. Panel D, Pinteraction < .0001; Pgenotype < .0001; Page < .0001. Panel E, Pinteraction = .7150; Pgenotype < .0001; Page = .1897. KIM-1, kidney injury marker 1.
Histological assessment of renal phenotype in male SCT (AS) and genetic control (AA) mice. (A) Representative H&E–stained cortical sections (top; original magnification, 40×; scale bar, 20 μm) and representative Masson trichrome–stained cortical sections of 40-week-old AS and age-matched AA mice (lower; original magnification, 20×; scale bar, 50 μm). (B) Quantification of glomerular congestion score index presented in panel A. (C) Quantification of glomerular sclerosis score index presented in panel A. (D) Representative H&E–stained renal medulla sections of 40-week-old AS and age-matched AA mice (original magnification, 40×; scale bar, 20 μm) and representative Masson trichrome–stained renal medulla sections of 40-week-old AS and age-matched AA male mice (original magnification, 20×; scale bar, 50 μm) and Prussian blue cortical section of 40-week-old AS and age-matched AA mice (original magnification, 10×; scale bar, 100 μm). (E) Quantification of medullary congestion score index presented in panel D; (F) Quantification of medullary interstitial fibrosis index presented in panel D; quantification of iron deposition in the whole kidney sections represented and megapixel per micrometer. In panels B-C and E-G, data are mean ± SEM (n = 5-6 per genotype); analysis by Mann-Whitney nonparametric test, ∗P < .05.
Histological assessment of renal phenotype in male SCT (AS) and genetic control (AA) mice. (A) Representative H&E–stained cortical sections (top; original magnification, 40×; scale bar, 20 μm) and representative Masson trichrome–stained cortical sections of 40-week-old AS and age-matched AA mice (lower; original magnification, 20×; scale bar, 50 μm). (B) Quantification of glomerular congestion score index presented in panel A. (C) Quantification of glomerular sclerosis score index presented in panel A. (D) Representative H&E–stained renal medulla sections of 40-week-old AS and age-matched AA mice (original magnification, 40×; scale bar, 20 μm) and representative Masson trichrome–stained renal medulla sections of 40-week-old AS and age-matched AA male mice (original magnification, 20×; scale bar, 50 μm) and Prussian blue cortical section of 40-week-old AS and age-matched AA mice (original magnification, 10×; scale bar, 100 μm). (E) Quantification of medullary congestion score index presented in panel D; (F) Quantification of medullary interstitial fibrosis index presented in panel D; quantification of iron deposition in the whole kidney sections represented and megapixel per micrometer. In panels B-C and E-G, data are mean ± SEM (n = 5-6 per genotype); analysis by Mann-Whitney nonparametric test, ∗P < .05.
Decreased deformability and sickling in AS RBCs
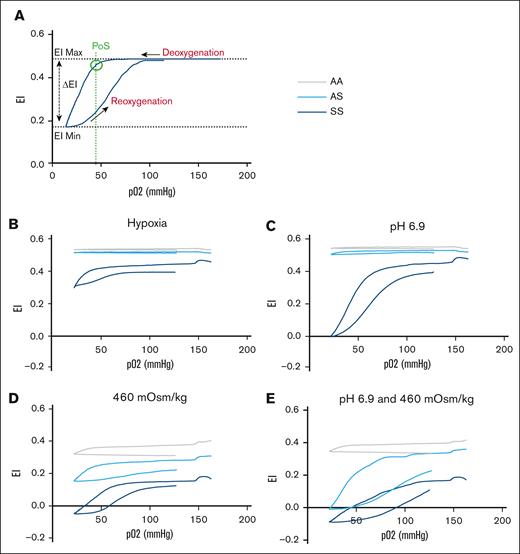
To investigate the contribution of RBCs to the renal medullary vascular congestion in AS mice, we evaluated the effect of hypoxia plus hyperosmolality and/or acidosis on RBC deformability and sickling using Laser Optical Rotational Red Cell Analyzer Oxygenscan. We previously demonstrated that human SCT RBCs exhibit reduced deformability and an increased tendency to sickle when exposed to hyperosmolarity and/or acidosis during progressive hypoxia.13 This approach was used to determine whether a similar phenotype is observed in mouse AS RBCs under the same conditions. In whole blood at physiologic pH (7.4) and osmolality (290 mOsm/kg), no decrease in RBC deformability or discernible point of sickling (PoS) was observed during deoxygenation in AS samples (Figure 7B). In the presence of extracellular acidosis (pH 6.9), a barely discernible PoS was observed (Figure 7C). In contrast, in the presence of extracellular hypertonicity (460 mOsm/kg) ± acidosis, a clear PoS with reversible deformability was apparent in AS samples (Figure 7D-E).
Reduced deformability of AS mouse RBCs under hypoxia is accentuated by hyperosmolality and/or acidosis. (A) Human SCD sample to illustrate typical Oxygenscan profile and readouts. PoS is calculated as the downward inflection point at which there is a >5% drop in the EI Max. (B) Whole blood samples demonstrating no change in deformability in AA or AS mice with deoxygenation. In SS mice, the baseline EI Max was lower, indicative of reduced RBC deformability even under normoxic conditions. During progressive hypoxia, only SS RBCs underwent sickling. (C) Effect of acidosis. At a pH of 6.9, a barely discernible PoS was observed in AS mice, with a more exaggerated profile in SS. (D) Effect of hyperosmolality (460 mOsm/kg). Baseline EI Max was diminished in all genotypes, presumably due to osmotically induced RBC dehydration. Thereafter, reversible sickling was evident in both AS and SS samples. (E) Effect of acidosis (pH 6.9) and hyperosmolality (460 mOsm/kg). The EI Max was lower in AS than in AA, although a clearly reversible component of the EI indicative of reversible sickling was apparent. Notably, the Oxygenscan profile in AA samples in hypertonic conditions also demonstrated a late downward inflection of the EI Max during deoxygenation. Given the impossibility that this is due to RBC sickling, it presumably reflects a sudden deformability change in RBC membranes that unlike sickling, appears to be irreversible, because no rebound in EI is seen during reoxygenation. Panels B-E contain data from 4 AA, 6 AS, and 2 SS mice, including both genders. EI Max, maximum elonagtion index; EI Min, mimimum elongation index.
Reduced deformability of AS mouse RBCs under hypoxia is accentuated by hyperosmolality and/or acidosis. (A) Human SCD sample to illustrate typical Oxygenscan profile and readouts. PoS is calculated as the downward inflection point at which there is a >5% drop in the EI Max. (B) Whole blood samples demonstrating no change in deformability in AA or AS mice with deoxygenation. In SS mice, the baseline EI Max was lower, indicative of reduced RBC deformability even under normoxic conditions. During progressive hypoxia, only SS RBCs underwent sickling. (C) Effect of acidosis. At a pH of 6.9, a barely discernible PoS was observed in AS mice, with a more exaggerated profile in SS. (D) Effect of hyperosmolality (460 mOsm/kg). Baseline EI Max was diminished in all genotypes, presumably due to osmotically induced RBC dehydration. Thereafter, reversible sickling was evident in both AS and SS samples. (E) Effect of acidosis (pH 6.9) and hyperosmolality (460 mOsm/kg). The EI Max was lower in AS than in AA, although a clearly reversible component of the EI indicative of reversible sickling was apparent. Notably, the Oxygenscan profile in AA samples in hypertonic conditions also demonstrated a late downward inflection of the EI Max during deoxygenation. Given the impossibility that this is due to RBC sickling, it presumably reflects a sudden deformability change in RBC membranes that unlike sickling, appears to be irreversible, because no rebound in EI is seen during reoxygenation. Panels B-E contain data from 4 AA, 6 AS, and 2 SS mice, including both genders. EI Max, maximum elonagtion index; EI Min, mimimum elongation index.
Discussion
The SS Townes mouse has been extensively studied as a model of sickle cell anemia, in which it mimics many of the hematologic and end-organ complications encountered in the analogous human disorder.31 However, it has become apparent in recent years that certain complications, including VT and CKD, are associated with SCT.4,32-34 The need for a mouse model to explore the mechanism of these complications led us to characterize Townes AS mice in greater detail. We observed that a phenotype for both VT and kidney dysfunction and injury is present in these animals. Specifically, in a commonly used model of VT (IVC stasis), clot size was enhanced in AS mice, and the natural history of age-dependent kidney dysfunction in humans with SCT was recapitulated in AS mice. WBC and platelet counts were also elevated in older AS mice. We have no mechanistic explanation for this observation. Furthermore, to our knowledge, no studies have addressed changes in WBC and platelet counts in aging humans with SCT. However, a recent case-control study of proteomic profiling in Black women identified 35 SCT-associated plasma proteins that are enriched in pathways related to kidney function, hemolysis, and inflammation. Notably, these women were relatively older, with a mean age of 61 years (standard deviation ± 7 years), suggesting possible age-dependency of the observed profiles.35
We reasoned that all complications of SCT are ultimately traceable to the β-globin gene mutation, and certain in vivo microenvironments characterized by prolonged hypoxia (± other severe environmental conditions) promote local changes in SCT RBCs that are not observed in circulating RBCs. Although there is growing interest in hypoxic storage of RBCs for transfusion,36 RBCs containing HbS are uniquely intolerant to hypoxia. In the case of VT, the relative hypoxia in the venous circulation (30-40 mm Hg) is further accentuated in the core of erythrocyte rich “red thrombi.”37 Our demonstration of pO2 levels <10 mm Hg in this location is consistent with previously reported findings in mouse models of VT.38 Importantly, the prolonged retention of RBCs within the clot may exceed the deoxyHbS gelation time, which determines the “delay time” of RBC sickling. Notably, the delay time is strongly inversely correlated with the intracellular HbS concentration,39 and reversible sickling may eventually become irreversible if hypoxia is sustained. Scanning electron microscopy clearly demonstrated sickled RBCs in the nidus of IVC thrombi from AS mice, supporting this concept. Precisely how this series of events leads to larger thrombi, or whether thrombi are more prone to instability and pulmonary embolization in AS mice, remains to be determined. One possibility for the larger clot size is increased local thrombin generation due to greater prothrombinase activity associated with enhanced expression of phosphatidylserine on the outer membrane leaflet of sickled RBCs.40,41 Reduced extrusion of AS RBCs during clot contraction under hypoxic conditions (as shown in this study) may also contribute to larger clots in vivo. Although there are additional possibilities to explain the prothrombotic propensity in SCT, these mechanisms are not mutually exclusive. Indeed, collectively, they suggest a possible multifactorial etiology of VT, in which the common theme is the effect of prolonged hypoxia on HbS-containing RBCs entrapped within “red thrombi” in the low shear rate, relatively hypoxic venous circulation. This hypothesis is supported by the fact that SCT does not appear to be associated with any increased risk for arterial thrombotic events.42-45 It has been shown that the average volume fraction in venous thrombi due to RBC content (50% ± 5%) is ∼10-fold greater than RBC content in arterial “white thrombi” (3.7% ± 1.0%).37 Furthermore, the pO2 in the arterial circulation (90-100 mm Hg) likely counters the tendency of SCT RBCs to undergo hypoxia-induced sickling.
Recent studies have also re-emphasized the need for a better understanding of the mechanism(s) and natural history of kidney disease in SCT. In agreement with other histopathological reports in AS mice,46-48 our comprehensive, longitudinal study of kidney involvement in humanized AS mice revealed numerous pathological changes, including early increased GFR (ie, hyperfiltration), glomerulopathy, tubular injury, medullary congestion, decreased urine concentrating ability, and progressive decline in glomerular filtration. Recent population studies have confirmed an association between SCT and CKD in African Americans. Using 5 prospective US population–based cohort studies, Naik et al showed that individuals with SCT have an increased risk of baseline and incident CKD, a higher rate of estimated glomerular filtration rate (eGFR) decline, and more frequent albuminuria compared with noncarriers of HbS.1 A similar association between SCT and albuminuria or SCT and albuminuria and/or eGFR <60 mL/min per 1.73 m2 was reported in Hispanic and Latino populations.49 Another large population-based cohort study (REGARDS [the Reasons for Geographic and Racial Differences in Stroke]) provided additional evidence that SCT is not only associated with substantially higher odds of CKD but also with progression to end-stage kidney disease.2 A further study evaluating the trajectory and predictors of kidney function decline in SCT and SCD confirmed that SCT is associated with faster eGFR decline than controls with normal Hb phenotype.50 Interestingly, faster rates of eGFR decline were observed in individuals with SCT with baseline eGFR ≥90 mL/min per 1.73 m2. In SCD and diabetes,50-53 the loss of eGFR is preceded by an earlier hyperfiltration phase. We observed an early onset “hyperfiltration-like” phenotype in AS mice that requires further evaluation in humans with SCT. To date, data on supranormal renal hemodynamics in SCT are limited to 2 small Congolese and Iraqi pediatric studies,54,55 which suggested the need for larger natural history studies verifying the prevalence of hyperfiltration and its potential contribution to SCT-associated kidney disease.
Other common abnormalities of the kidney in individuals with SCT include isosthenuria and papillary necrosis.32,56,57 These entities are a consequence of ischemic damage to the renal medulla with medullary microinfarctions and loss of vasa recta, which generate the osmolar gradient necessary for urine concentration. Ischemic injury to metabolically active proximal tubular cells in the outer renal medulla of AS mice may account for the increased urinary excretion of KIM-1. In the inner medulla, biophysical conditions may be more severe, with pH as low 5.9, pO2 as low as 10 to 20 mm Hg, and osmolality as high as 1200 mOsm/kg in the low flow circulation in the vasa recta.58 Our murine data are in accordance with other preclinical46,47 and human reports,59 with us observing vascular congestion of sickled RBCs within the vasa recta of AS mouse kidneys that was associated with interstitial fibrosis and resultant progressive impairment in urine concentrating ability. These changes are highly reminiscent of the widespread loss of microvasculature in the renal medulla of humans with SCT.57 Modeling the hostile environment in the inner renal medulla, we demonstrated that a combination of hypoxia, hyperosmolality, and acidosis reduces deformability and promotes sickling in AS RBCs. Reduced deformability may be due to both cellular dehydration and sickling-related changes in the RBC membrane.14 Despite some subtle differences in the Oxygenscan profiles between human SCT13 and murine AS RBCs, the overall pattern is remarkably similar. Modifiers of interindividual variability in human SCT responses likely include the variable intraerythrocyte HbS percentage, coexisting α-globin gene deletion(s),59,60 and/or polymorphisms in RBC ion channels, such as PIEZO1, which may promote cellular dehydration.61
This study has several limitations. First, renal phenotype was assessed only in male mice, based on sex differences in renal involvement in SS mice.23 However, a several studies in humans with SCT have suggested that CKD is more prevalent in men.50,62-64 A higher incidence of renal medullary carcinoma in males with SCT is well established.65,66 It has been suggested that both renal medullary carcinoma and CKD are associated with greater participation in high intensity exercise and larger muscle mass in men.67 Regardless, we acknowledge that further studies are needed to confirm that the AS mouse model of kidney disease is applicable to both sexes. Despite these unresolved issues, insights from this mouse model may help to identify therapeutic targets to prevent and/or treat VT and CKD in the large global population of individuals with SCT.
Acknowledgments
This work was supported by National Heart, Lung, and Blood Institute grants RO1HL171501, R00HL144817, and T32HL007149, and the American Society of Nephrology Norman Siegel Research Scholar grant (M.K.).
Authorship
Contribution: N.S.K., M.K., and R.P. conceptualized the study; F.T., M.O.S., S.P.G., M.W.H., P.E., I.P., C.M., and M.K. performed experiments; F.T., M.O.S., S.P.G., D.M.M., R.P., M.K., and N.S.K. analyzed data; V.K.D., D.M.M., P.E., R.P., M.K., and N.S.K. interpreted results; F.T. and M.K. prepared figures; F.T., M.O.S., R.P., M.K., and N.S.K. drafted the manuscript; V.K.D., S.P.G., D.M.M., R.P., M.K., and N.S.K. edited and revised the manuscript; and all authors approved the final version of the manuscript.
Conflict-of-interest disclosure: The authors declare no competing financial interests.
Correspondence: Malgorzata Kasztan, Division of Hematology/Oncology, Department of Pediatrics, University of Alabama at Birmingham, 1918 University Blvd, MCLM 535, Birmingham, AL 35233; email: mkasztan@uabmc.edu; and Nigel S. Key, Department of Medicine, University of North Carolina at Chapel Hill, 116 Manning Dr, 8008B Mary Ellen Jones, CB #7035, Chapel Hill, NC 27599; email: nigel_key@med.unc.edu.
References
Author notes
F.T. and M.O.S. contributed equally to this study.
Original data are available on reasonable request from the corresponding authors, Malgorzata Kasztan (mkasztan@uabmc.edu) or Nigel S. Key (nigel_key@med.unc.edu).
The full-text version of this article contains a data supplement.

