TO THE EDITOR:
Lymphodepleting chemotherapy (LDC) plays a key role in the efficacy of chimeric antigen receptor (CAR) T-cell therapy.1 Adding fludarabine to the LDC regimen, as well as the disease response to LDC, have been identified as prognostic factors for patients with relapsed/refractory (R/R) large B-cell lymphoma (LBCL) treated with CAR T cells.2 The impact of fludarabine exposure on survival has been explored in the context of allogeneic hematopoietic cell transplantation (allo-HCT),3 which showed that high fludarabine levels are associated with impaired immune reconstitution and lower event-free survival due to higher nonrelapse mortality.
In the CAR T-cell field, 2 articles published in Blood Advances4,5 addressed this issue in pediatric and young adult patients with R/R B-cell acute lymphoblastic leukemia (B-ALL). Fabrizio et al estimated the fludarabine exposure of patients treated with tisagenlecleucel (tisa-cel) based on a population pharmacokinetic (popPK) model developed in allo-HCT recipients.4 They identified an optimal estimated area under the plasma-drug concentration–time curve (area under the curve [AUC] ≥14 mg × hour/L [mgh/L]) associated with prolonged overall survival (OS), duration of B-cell aplasia, and cumulative incidence of relapse. Dekker et al conducted a similar study in a limited cohort of patients with B-ALL (n = 26), measuring fludarabine blood levels in different time points during the LDC period. In this study, an optimal fludarabine exposure (AUC≥14 mgh/L) was associated with better efficacy outcomes. Interestingly, they reported relevant individual variations; up to 50% of patients had a predicted AUC value that varied by 4 mgh/L or more in comparison to the popPK model.5
In the recent article published in Blood Advances by Scordo et al,6 “Identifying an Optimal Fludarabine Exposure for Improved Outcomes after CD19 CAR T-cell therapy for Aggressive B-NHL,” the authors predicted fludarabine systemic exposure, expressed as AUC using the same popPK model7 in a large cohort of patients with R/R LBCL (n = 199) treated with axicabtagene ciloleucel (axi-cel). The authors observed that patients with an estimated AUC of 18 to 20 mgh/L (defined as optimal systemic exposure) had prolonged progression-free survival and OS compared with patients with a lower or a higher predicted AUC. In addition, patients with a high estimated AUC have an increased risk of developing immune effector cell-associated neurotoxicity syndrome. Based on these findings, the authors suggested that implementing a PK–guided dosing strategy for fludarabine to achieve an optimal AUC could potentially enhance CAR T-cell outcomes, although they acknowledged the need for independent external validation of the model and the lack of data regarding real fludarabine levels.
These studies highlight some important questions regarding the role of fludarabine exposure in the efficacy and safety of CAR T-cell therapy: (1) is estimated fludarabine exposure, using popPK models, an accurate surrogate for measured fludarabine levels? (2) Can we modulate the fludarabine dose of an individual patient using the estimated exposure without real fludarabine levels? (3) Can fludarabine exposure be used as a prognostic factor for CAR T-cell therapy outcomes?
At our institution, we prospectively assessed fludarabine blood levels for patients with R/R LBCL who received CD19–targeted CAR T-cell therapy after 2 or more prior lines of treatment since March 2021, as part of an institutional review board–approved study (PI21/00197) and it was performed in accordance with the Declaration of Helsinki.
Blood samples were scheduled at 7 time points between the start of LDC and CAR T-cell infusion: on day 1 of LDC (at 90 and 120 minutes after fludarabine administration), on day 2 of LDC (before fludarabine administration), on day 3 of LDC (at 90 and 120 minutes, and 24 hours after fludarabine administration), and 30 minutes before CAR T infusion. Patients with ≤4 samples or who received CAR T-cell infusion >5 days after the last fludarabine dose were excluded from the study. Fludarabine concentrations were determined using an ultra-performance liquid chromatography tandem mass spectrometry assay following liquid-liquid extraction procedures.8
Measured fludarabine exposure was defined as the individual patient cumulative AUC up to the last measurement time (AUC0-Last) expressed as mgh/L and was obtained by Bayesian estimation of the PK parameters using the measured blood concentrations and individual pharmacokinetic profiles, including body weight and estimated glomerular filtration rate (liters per hour per kilogram). A conversion factor of 0.781 was applied to change fludarabine triphosphate (F-ara-ATP) to its monophosphate (F-ara-AMP), as previously reported.3 Model–predicted fludarabine exposure was calculated using the covariates previously described without the observed individual PK profiles. In both cases, the popPK model of Langenhorst et al7 implemented in NONMEM v7.4 was used. A generalized logistic mixed model for repeated measures was performed to compare measured and predicted fludarabine exposure. Analyses were performed using the R software version 4.2.2.
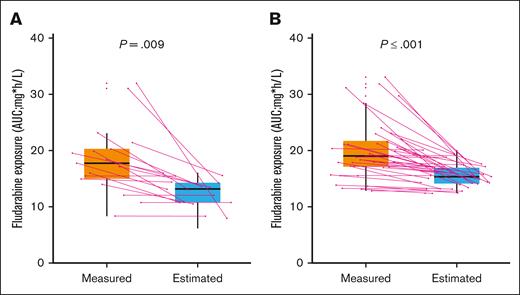
In an attempt to study the correlation between the measured and model-predicted fludarabine exposure, we used data from the first 54 patients with R/R LBCL in our study. Thirty-seven (69%) and 17 (31%) patients received axi-cel and tisagenlecleucel (tisa-cel), respectively. The median number of samples per patient was 7 (interquartile range [IQR], 6-7) and 90% (339/378) of the initially planned samples. The median administered dose of fludarabine was 51.3 mg per day, following label recommendations (25 mg/m2 daily ×3 for tisa-cel and 30 mg/m2 ×3 for axi-cel). Dose adjustment was required in 6 (11%) patients with a decreased glomerular filtration rate (25% reduction in 3 patients and 30% in 3 patients). The median measured fludarabine exposure for the complete cohort was 18.61 mgh/L (IQR, 15.72-21.52), whereas the model-predicted AUC was 14.40 mgh/L (IQR, 13.12-15.98); the model-predicted method underestimated the fludarabine exposure in comparison with the measured method (P < .001). Of note, our estimated AUC was slightly lower than that of previous ALL studies, although this could be attributed to differences in patient characteristics and fludarabine doses administered between both studies. Considering separately each CAR T-cell product, the estimated AUC was also lower than the measured AUC for axi-cel (15.30 vs 19.08 [P < .01]) and tisa-cel (13.08 vs 17.75 [P < .01]) (Figure 1). Despite the higher fludarabine dose received by axi-cel patients, in comparison to tisa-cel, median measured exposure was similar in both groups (19.08 vs 17.75; P = .23).
Distribution of measured and predicted fludarabine AUC according to CAR T-cell construct. (A) Tisa-cel (B) Axi-cel. Box plot providing a summary of the variability between the values of fludarabine exposure observed in our cohort (measured) and the predicted (estimated) values using a previously popPK model. Continuous lines indicate individual patients.
Distribution of measured and predicted fludarabine AUC according to CAR T-cell construct. (A) Tisa-cel (B) Axi-cel. Box plot providing a summary of the variability between the values of fludarabine exposure observed in our cohort (measured) and the predicted (estimated) values using a previously popPK model. Continuous lines indicate individual patients.
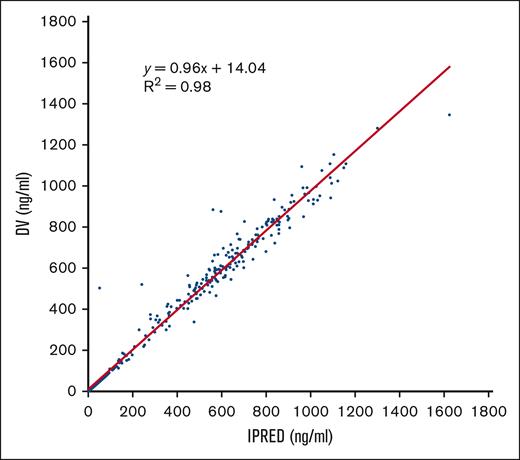
Finally, to test the strength of the PK model used in our study, we compared drug concentrations vs the individual predicted concentrations for each patient at each time point (Figure 2). We observed a high correlation (r2 = 0.98) between both variables, indicating the good predictive capacity of the model.
Correlation between drug concentrations vs the individual predicted concentrations for each patient at each time point. Scatterplot showing a symmetric distribution around the diagonal line indicating a strong positive correlation between the 2 variables, which reinforces the strength of the model. DV, drug concentrations; IPRED individual predicted concentrations.
Correlation between drug concentrations vs the individual predicted concentrations for each patient at each time point. Scatterplot showing a symmetric distribution around the diagonal line indicating a strong positive correlation between the 2 variables, which reinforces the strength of the model. DV, drug concentrations; IPRED individual predicted concentrations.
Our findings showed that for patients with LBCL, the model-predicted method provided lower fludarabine exposure results compared with the AUC obtained with serial measurements, as was suggested for patients with B-ALL.5 The median underestimation was 16.09% and 32.96% for patients receiving axi-cel and tisa-cel, respectively, although some patients had underestimation >50%. The reasons behind these differences are not completely understood and may include the following: first, the predicted popPK model was developed in a cohort of patients undergoing allo-HCT7 and these patients can differ significantly from CAR T-cell recipients in terms of age, renal function, and body mass index (BMI). In fact, BMI was the only baseline characteristic significantly different between patients with high (≥50%) and low (<50%) variations between both methods (median 27.08 mgh/L [IQR, 25.92-29.37] vs 24.68 mgh/L [IQR, 22.73-26.25]; P = .018). Second, the fludarabine dose used in conditioning regimens for allo-HCT, as well as concomitant chemotherapy, is different from the dose and regimens used for LDC before CAR T-cell infusion. Finally, the estimation method has a limited capacity to capture the variations in weight and renal function occurring during the LDC period.
Using a predictive model for fludarabine exposure to establish an optimal dose range with the potential to improve outcomes in this patient population is intriguing and logistically attractive, although narrow windows, as proposed by Scordo et al (18-20 mgh/L), may harbor additional logistical challenges. However, our study highlights the unpredictability of actual fludarabine exposure, which may limit the accuracy of these theoretical models. Thus, calculating the exposure based on fludarabine blood levels might be a better reflection of the real AUC in each individual patient. However, we acknowledge that this methodology has intrinsic challenges in terms of financial and logistical barriers that potentially limit its use. As suggested by Scordo et al our group is running studies comparing both methodologies in parallel to determine their impact on safety and efficacy outcomes, although larger data sets are needed to account for potential confounding factors.
Contribution: M.A.S-S., M.M., G.I., and P.B. were involved in the study conception and design; M.A.S.-S., I.F.T., and J.V. were responsible for data acquisition; M.A.S.-S., G.I., and P.B. were responsible for data analysis; V.N. performed statistical analysis; M.A.S.-S. wrote the manuscript; and all authors critically reviewed the manuscript and approved the submitted and final versions.
Conflict-of-interest disclosure: M.A.S.-S. received honoraria from Kite/Gilead, Takeda, and Janssen. G.I. received consultancy and honoraria from Novartis, Roche, Kite/Gilead, Bristol-Myers Squibb, AbbVie, Janssen, Sandoz, Miltenyi, and AstraZeneca. P.B. serves advisory board and consultancy for Allogene, Amgen, Bristol-Myers Squibb/Celgene, Kite/Gilead, Incyte, Miltenyi Biomedicine, Novartis, Nektar, Pfizer, and Pierre Fabre. The remaining authors declare no competing financial interests.
Correspondence: Pere Barba, Department of Hematology, Hospital Universitari Vall d’Hebron, Universitat Autònoma de Barcelona, Passeig de la Vall d' Hebron 119, Barcelona, 08035, Spain; email: pbarba@vhio.net.
References
Author notes
Data will be available upon reasonable request from the corresponding author, Pere Barba (pbarba@vhio.net).


