Key Points
YY1 cooccupies with SMC3 at a large cohort of promoters genome wide and represses SMC3 expression in HSPCs.
Establish a distinct regulatory circuit of 2 chromatin structural factors and its impact on HSC quiescence and metabolism.
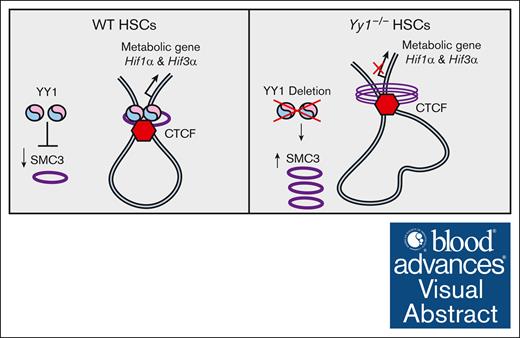
Visual Abstract
Yin Yang 1 (YY1) and structural maintenance of chromosomes 3 (SMC3) are 2 critical chromatin structural factors that mediate long-distance enhancer-promoter interactions and promote developmentally regulated changes in chromatin architecture in hematopoietic stem/progenitor cells (HSPCs). Although YY1 has critical functions in promoting hematopoietic stem cell (HSC) self-renewal and maintaining HSC quiescence, SMC3 is required for proper myeloid lineage differentiation. However, many questions remain unanswered regarding how YY1 and SMC3 interact with each other and affect hematopoiesis. We found that YY1 physically interacts with SMC3 and cooccupies with SMC3 at a large cohort of promoters genome wide, and YY1 deficiency deregulates the genetic network governing cell metabolism. YY1 occupies the Smc3 promoter and represses SMC3 expression in HSPCs. Although deletion of 1 Smc3 allele partially restores HSC numbers and quiescence in YY1 knockout mice, Yy1−/−Smc3+/− HSCs fail to reconstitute blood after bone marrow transplant. YY1 regulates HSC metabolic pathways and maintains proper intracellular reactive oxygen species levels in HSCs, and this regulation is independent of the YY1–SMC3 axis. Our results establish a distinct YY1–SMC3 axis and its impact on HSC quiescence and metabolism.
Introduction
Yin Yang 1 (YY1) is a ubiquitous zinc finger transcription factor and polycomb group protein (PcG) that can activate or repress transcription of target genes,1,2 promote chromatin/chromosome structural changes, and form gene-regulatory DNA loops between proximal and distal promoters and enhancer binding sites through homodimer interactions.3,4 YY1 orchestrates PcG-mediated gene repression by recruiting other PcG members to specific chromatin sites to control histone modifications.5-7 YY1 plays important roles in gene regulation, early embryonic development, X-chromosome inactivation, DNA repair, normal hematopoiesis, as well as hematopoietic cancers.8-11 Although YY1 is required for both B- and T-lymphocyte development,8,12-16 its functions in hematopoietic stem cell (HSC) development were incompletely characterized. Our previous study demonstrates that a conditional Yy1 knockout in HSCs decreases long-term repopulating activity, and that ectopic YY1 expression expands HSCs. YY1 deficiency deregulates the genetic network governing HSC proliferation, impairs stem cell factor/c-Kit signaling, and disrupts mechanisms conferring HSC quiescence.17 Nevertheless, the underlying mechanisms by which YY1 regulates HSC quiescence and self-renewal are still largely unknown.
Cohesin is a multimeric protein complex that is important for sister chromatid cohesion and segregation during mitosis. Cohesin consists of a ring-like structure comprised of structural maintenance of chromosomes (SMC)1, SMC3, and RAD21, bound to STAG1 or STAG2, which wraps around chromatin.18,19 SMC1 and SMC3 form the core component of the cohesin complex.19 Cohesin encircles chromatin fibers without directly binding to DNA and plays critical roles in chromosome segregation, DNA repair, and DNA looping.20-22 Depletion of cohesin core components promotes HSC expansion to skew toward myeloid differentiation.23-26 Homozygous deletion of Smc3 causes bone marrow (BM) aplasia in mice and SMC3-deficient mice die shortly. Smc3 haploinsufficiency increases HSC self-renewal and cooperates with myeloid leukemia oncogene Flt3-internal tandem duplications to induce acute myeloid leukemia.26 Knockdown of cohesin complex proteins by short hairpin RNA (shRNA) can lead to myeloproliferative neoplasms in mice.23
Enhancers and gene promoters interact with each other to regulate the expression of target genes. An established paradigm for enhancer function involves chromatin looping in which the 2 sites are brought physically close together.27-30 Proteins that facilitate chromatin looping alter local and higher-order chromatin structure, and therefore these proteins are defined as chromatin structural factors. YY1, cohesion, and CCCTC-binding factor (CTCF) are all essential chromatin structural factors.3,4,22,31-35 In addition, YY1 and cohesin complex proteins are critical for regulating HSC fate.23-26,35 Many questions remain unanswered regarding how chromatin structural factors interact with each other and impact hematopoiesis. Our RNA-sequencing (RNA-seq) analysis comparing wild-type and Yy1−/− HSCs demonstrated that Smc3 is upregulated in YY1-deficient cells, and genes regulated by YY1 are significantly enriched in cell cycle progression, cell division, chromosome condensation and segregation, and cytoskeleton and spindle organization.17 Thus, we hypothesized that YY1 is a critical regulator of the cohesin complex protein SMC3, and that there is a distinct YY1–SMC3 axis-dependent/-independent regulation of HSC functions.
Herein, we demonstrate that YY1 and cohesin complex proteins cooccupy a large cohort of promoters genome wide by physically interacting with the cohesin protein SMC3. YY1 deficiency deregulates the genetic network governing cell metabolism. YY1 represses SMC3 expression and occupies the Smc3 promoter in hematopoietic stem and progenitor cells (HSPCs). Although SMC3 is upregulated in YY1-null BM cells (BMCs), SMC3 protein expression was normalized in Yy1−/−Smc3+/− cells. Although deletion of 1 Smc3 allele partially rescues long-term HSC (LT-HSC) percentage in YY1-deficient mice and leads to a partial restoration of HSC quiescence, Yy1−/−Smc3+/− cells fail to reconstitute blood in mice that received BM transplantation. YY1-deficient HSCs have increased intracellular reactive oxygen species (ROS) levels, and the regulation of proper ROS level is independent of the YY1–SMC3 axis. Our results establish a distinct regulatory circuit of 2 chromatin structural factors and its impact on HSC quiescence and metabolism.
Methods
ChIP-seq data analysis
Chromatin immunoprecipitation sequencing (ChIP-seq) data for CTCF, H3K27ac, SMC1, SMC3, and YY1 as well as associated input were downloaded from Gene Expression Omnibus (GEO; accession identifiers: GSE22562, GSE62380, and GSE68195).36-38 ENCyclopedia Of DNA Elements (ENCODE) ChIP-seq pipeline (version 2.1.6) was used to align reads to mouse genome (mm10) and call peaks. Protein-coding transcripts and long noncoding RNAs from GENCODE basic annotation (version M22) were used to define exons and introns. Proximal promoter is defined as 1 kb upstream of a gene, and distal promoter is defined as 4 kb upstream of a proximal promoter. H3K27ac peaks were considered as enhancers and the rest of the genomic regions were defined as intergenic. The genomic locations of ChIP-seq peaks from chromosomes 1 to 19 and X are determined by peak overlap with the aforementioned 6 types of genomic regions. Gene Ontology (GO) term overrepresentation was analyzed by the goana function from the Bioconductor package limma (version 3.50.1).
Cleavage under targets and tagmentation analysis
According to published protocol39 (see supplemental Material for details), the cleavage under targets and tagmentation (CUT&Tag) libraries were constructed with hematopoietic precursor cell-7 (HPC-7) cells infected with MigR1-shLuc or MigR1-shYY1. CUT&Tag FASTQ files were first processed by removing the adapter “CTGTCTCTTATACACATCT” using the Cutadapt software (version 4.5) and then aligned to the mouse genome (version mm10) by Bowtie2 (version 2.5.1). Duplicated fragments were marked and removed by Picard (version 3.1.1). Peaks were called by MACS2 (version 2.2.9.1) for each replicate under a q-value cutoff of 10−6. Only peaks from chromosome 1 through 19, X, or Y, and not overlapping with any of the ENCODE problematic genomic regions (https://www.encodeproject.org/files/ENCFF547MET/) were kept. Because every sample has 3 replicates, we defined peaks for a sample as the genomic regions belonging to peaks called in all 3 replicates and with a minimum genomic span of 10 base pairs (bp). Peak location type and GO term overrepresentation were processed in the same way as in ChIP-seq analysis.
Mice
To induce the expression of cyclization recombinase (Cre), 8-week-old mice were injected with 100 μg of pI-pC (GE Healthcare Life Science) every other day for 4 doses. Approximately equal proportions of male and female mice were used, and aggregated data were presented because sex-specific differences were not found (supplemental Figure 9). All experiments described in this manuscript were performed 7 days after the last injection of pI-pC, unless stated otherwise. All experiments involving mice were approved by the institutional laboratory animal care and use committee of the University of Wisconsin-Madison and conform to the appropriate regulatory standards.
BM transplantation
Competitive BM transplantation assay was performed as previously described.17 Total BMCs were transplanted to lethally irradiated (8.5 Gy) recipient mice (CD45.1+). At 4 week after transplantation, recipient mice were treated with 4 doses of pI-pC every other day. Peripheral blood chimerism was evaluated by flow cytometry every 4 weeks.
Flow cytometric analysis
Directly conjugated or biotin-conjugated antibodies specific for the following surface antigens were purchased from eBioscience: CD3 (145-2C11), CD4 (RM4-5), CD8 (53-6.7), B220 (RA3-6B2), TER119 (TER-119), Gr-1 (RB6-8C5), IgM (eB121-15F9), CD19 (eBio1D3), interleukin 7Rα (A7R34), CD45.2 (104), CD45.1 (A20), Sca1 (D7), c-Kit (2B8), Mac1 (M1/70), and Thy1.2 (53-2.1). CD48 (103427) and CD150 (TC15-12F12.2) were purchased from BioLegend. Ghostdye Violet510 (Tonbo Bioscience) was used to exclude nonviable cells. Data were acquired from LSR Fortessa (BD Biosciences) and analyzed using BD FlowJo version 10.0.7 software.
Cell cycle analyses
BMCs were fixed with 4% paraformaldehyde, permeabilized with 0.1% saponin in phosphate-buffered saline, and stained with fluorescein isothiocyanate–conjugated Ki67 (BD Biosciences) and DAPI (4′,6-diamidino-2-phenylindole; Thermo Fisher) in addition to HSC, Lin− Sca1+c-kit+ (LSK), myeloid progenitors (MP; Lin− Sca1−c-kit+), and multipotent progenitor (MPP) markers.
RNA-seq data analysis
RNA-seq reads were aligned by Spliced Transcripts Alignment to a Reference (version 2.5.2b) to the mouse genome (version mm10) with GENCODE basic gene annotations (version M22). Gene expression levels were quantified by RNA-Seq by Expectation-Maximization (version 1.3.0), and differential expression was analyzed by edgeR (version 3.36.0). A differentially expressed gene was required to have at least twofold changes, an adjusted P value < .05, and transcript per million ≥1 in all the replicates in at least 1 of 2 conditions in comparison. Gene set enrichment analysis was performed by fgsea (version 1.20.0) with M2 curated gene sets from the Molecular Signatures database (version 2022.1.Mm). The RNA-seq data have been deposited to GEO with an access identity GSE239743 (https://www.ncbi.nlm.nih.gov/geo/query/acc.cgi?acc=GSE239743) and a secure token, yrsruwgurxgjfqh.
Statistical analysis
All statistical analyses were conducted using GraphPad Prism version 7.04. The Student t test was used to determine statistical significance between Mx1-Cre and Yy1f/fMx1-Cre groups. Differences between the 4 groups were determined using a 1-way analysis of variance followed by Tukey post hoc test. Two-way analysis of variance followed by Tukey post hoc test was used to compare cells in different phases of the cell cycle, as measured by Ki67 and DAPI flow cytometry analysis. P values ≤ .05 were considered statistically significant.
Results
YY1 and cohesin complex proteins cooccupy a large cohort of promoters genome wide
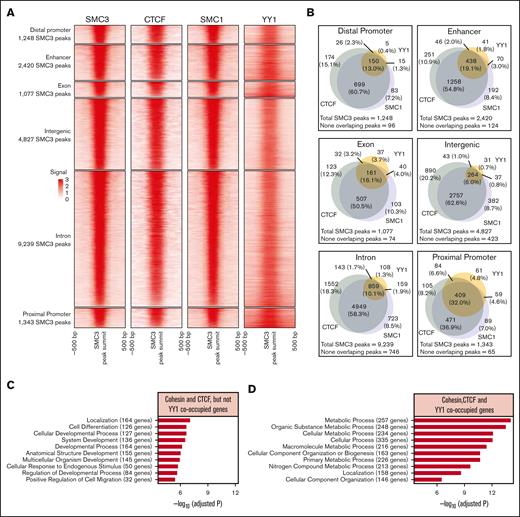
To assess YY1 and cohesin complex proteins SMC3 and SMC1A binding sites throughout the genome, previously published ChIP-seq data sets on mouse embryonic stem cells from GEO under the accession GSE62380, GSE68195, and GSE22562 were analyzed.36-38 In total, 20 154 SMC3 ChIP-seq peaks were identified and stratified by their genomic locations. CTCF, SMC1, and YY1 binding peaks had overall strong overlapping with SMC3 peaks at all genomic locations (Figure 1A; supplemental Figure 1). Among the 20 154 SMC3 peaks, >90% of SMC3 binding peaks were cooccupied with CTCF, SMC1, and/or YY1, with only 1528 SMC3 peaks were not. At most of the genomic locations, SMC3 colocalized more frequently with CTCF and SMC1 than YY1 (Figure 1A-B). YY1 cooccupancy with cohesin and CTCF is more prevalent in the proximal promoter compared with other genome locations. Overall, 32% of SMC3 binding peaks at the proximal promoter were cooccupied with YY1, CTCF, and SMC1 compared with 19.1% at the enhancer, 16.1% at the exon, 13% at the distal promoter, 10.1% at the intron, and 6% at the intergenic region (Figure 1B). Interestingly, GO term overrepresentation analysis on genes cooccupied by cohesin, CTCF, and/or YY1 at proximal promoters indicated a functional significance of YY1 dependent vs independent regulation at proximal promoters. For promoters with YY1-independent cohesion-CTCF occupancy, genes were enriched in cellular differentiation and developmental process (Figure 1C). In contrast, for promoters with YY1-dependent occupancy, genes were mainly enriched in the metabolic process (Figure 1D).
ChIP-seq analysis of YY1 and cohesin complex protein binding sites. (A) Heat map of SMC3, CTCF, SMC1, and YY1 ChIP-seq signals around SMC3 peak summits. Each row represents a SMC3 peak region that is defined as a 500-bp genomic region flanking a SMC3 ChIP-seq peak summit. (B) Venn diagrams to compare the overlapping of CTCF, SMC1, and YY1 peaks with that of SMC3 peaks. (C-D) Top 10 overrepresented GO terms on genes that have proximal promoters overlapping with SMC3 peaks. Genes were stratified by the 471 SMC3 peaks overlapping with SMC1 and CTCF but not YY1 (C), and the 409 SMC3 peaks overlapping with SMC1, CTCF, and YY1 (D).
ChIP-seq analysis of YY1 and cohesin complex protein binding sites. (A) Heat map of SMC3, CTCF, SMC1, and YY1 ChIP-seq signals around SMC3 peak summits. Each row represents a SMC3 peak region that is defined as a 500-bp genomic region flanking a SMC3 ChIP-seq peak summit. (B) Venn diagrams to compare the overlapping of CTCF, SMC1, and YY1 peaks with that of SMC3 peaks. (C-D) Top 10 overrepresented GO terms on genes that have proximal promoters overlapping with SMC3 peaks. Genes were stratified by the 471 SMC3 peaks overlapping with SMC1 and CTCF but not YY1 (C), and the 409 SMC3 peaks overlapping with SMC1, CTCF, and YY1 (D).
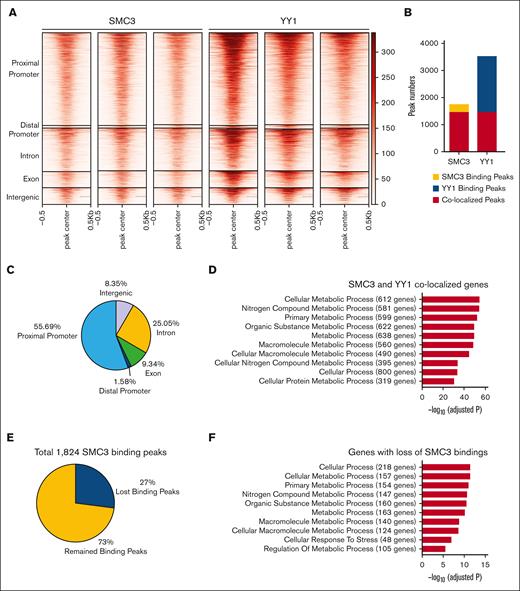
To further evaluate YY1 and SMC3 cooccupancy in HSPCs, we conducted CUT&Tag experiments in the HSPC line HPC-740,41 with antibodies against YY1 and SMC3. Consistent with compiled ChIP-seq data (Figure 1), YY1 had strong overlapping with SMC3 peaks at all genomic locations (Figure 2; supplemental Figure 2). Among 1824 SMC3 binding peaks, 83% were cooccupied by YY1. Among 3602 YY1 binding peaks, 42% were cooccupied by SMC3 (Figure 2B). YY1 cooccupancy with SMC3 is more prevalent in the proximal promoter than other genome locations. Of cobinding peaks, 56% were at the proximal promoter compared with 25% at intron, 9% at exon, 8% at intergenic region, and 1.6% at the distal promoter (Figure 2C). YY1 activates c-Kit expression in HSPCs by binding at the Kit locus.17 The CUT&Tag analysis revealed a YY1-SMC3 cobinding peak at the Kit locus. Upon YY1 knockdown, YY1 enrichment at the Kit locus was reduced, whereas SMC3 binding was intact (supplemental Figure 2D). Consistent with compiled ChIP-seq data (Figure 1D), GO term overrepresentation analysis on genes cooccupied by YY1 and SMC3 at the proximal promoter region show that top 10 enriched pathways are involved in cell metabolism (Figure 2D). To determine what overlapping cobinding sites of YY1 and SMC3 depend on the presence of YY1, we knocked down YY1 in HPC-7 cells by shRNA. Over 70% of Yy1 transcript was reduced in HPC-7 cells infected with sh-YY1 vs sh-Luc (supplemental Figure 8). Peak analysis in YY1 knockdown HPC-7 cells show that ∼27% of SMC3 binding peaks were lost upon YY1 knockdown (Figure 2E), most of which were associated with genes that are critical for cell metabolic process (Figure 2F). The ChIP-seq and CUT&Tag assays support that YY1 and SMC3 cooccupy at proximal promoter regions that are critical for regulating cellular metabolism.
CUT&Tag analysis of YY1 and SMC3 binding sites. (A) Heat map of SMC3 and YY1 signals around SMC3 peak summits at different genomic regions. Each row represents a SMC3 peak region that is defined as a 1-kilobase genomic region flanking a SMC3 CUT&Tag peak summit. (B) YY1, SMC3, and cobinding peak numbers. (C) Percentages and numbers of YY1 and SMC3 cobinding peaks at different genomic regions. (D) Top 10 overrepresented GO terms on genes that have proximal promoters occupied with SMC3 and YY1 peaks. (E) In total, 27% of SMC3 binding peaks were lost upon YY1 knockdown. (F) Top 10 overrepresented GO terms on genes that have lost SMC3 bindings at proximal promoters upon YY1 knockdown.
CUT&Tag analysis of YY1 and SMC3 binding sites. (A) Heat map of SMC3 and YY1 signals around SMC3 peak summits at different genomic regions. Each row represents a SMC3 peak region that is defined as a 1-kilobase genomic region flanking a SMC3 CUT&Tag peak summit. (B) YY1, SMC3, and cobinding peak numbers. (C) Percentages and numbers of YY1 and SMC3 cobinding peaks at different genomic regions. (D) Top 10 overrepresented GO terms on genes that have proximal promoters occupied with SMC3 and YY1 peaks. (E) In total, 27% of SMC3 binding peaks were lost upon YY1 knockdown. (F) Top 10 overrepresented GO terms on genes that have lost SMC3 bindings at proximal promoters upon YY1 knockdown.
YY1 physically interacts with SMC3 via its zinc finger domain
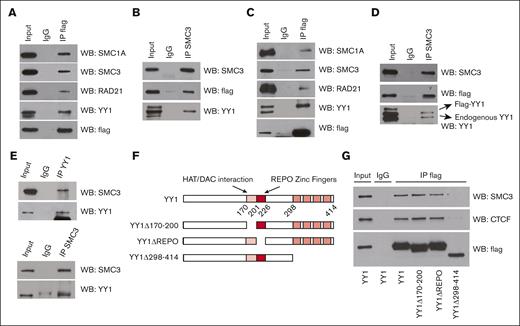
Because YY1 and cohesin complex proteins cooccupied a large cohort of promoters throughout the genome, we assessed whether YY1 physically interacted with cohesin complex proteins. Human embryonic kidney-293 (HEK-293) cells (Figure 3A-B) and HPC-7 cells (Figure 3C-D) were transfected and infected respectively with plasmids expressing Flag-tagged YY1, and the nuclear extracts were coimmunoprecipitated with anti-Flag antibody or immunoglobulin G (IgG) control. Compared with IgG control, cohesin complex proteins SMC1A, SMC3, and RAD21 coimmunoprecipitated when using the anti-Flag antibody in HEK-293 (Figure 3A) and HPC-7 cells (Figure 3C). The reciprocal intraperitoneal co-(IP) was conducted by immunoprecipitation with an anti-SMC3 antibody. Compared with IgG control, YY1 coimmunoprecipitated with anti-SMC3 antibody in HEK-293 (Figure 3B) and HPC-7 cells (Figure 3D). To access endogenous YY1 interaction with SMC3, total BMCs were harvested from C57BL/6 mice at 4 days after 5-fluorouracil injections (5 mg/mouse). Endogenous co-IPs were conducted in nuclear extract of 5-fluorouracil–enriched BMCs with IgG control, or anti-YY1 or anti-SMC3 antibody. SMC3 and YY1 proteins coimmunoprecipitated with each other with anti-YY1 (Figure 3E upper panel) or anti-SMC3 antibody (Figure 3E lower panel) in BMCs.
YY1 physically interacts with cohesin complex proteins through its zinc finger domain. (A-B) YY1 physically interacts with cohesin complex proteins in 293 cells. (A) Nuclear extracts were immunoprecipitated with anti-Flag antibody and were western blotted for SMC1A, SMC3, RAD21, YY1, or Flag. (B) Reciprocal nuclear co-immunoprecipitation (co-IP). Nuclear extracts were immunoprecipitated with anti-SMC3 antibody and western blotted for SMC3, Flag, or YY1. (C-D) YY1 physically interacts with cohesin complex proteins in HPC7. (C) Nuclear extracts were immunoprecipitated with anti-Flag antibody and were western blotted for SMC1A, SMC3, RAD21, Flag or YY1. (D) Reciprocal nuclear co-IP. Nuclear extracts were immunoprecipitated with anti-SMC3 antibody and western blotted for SMC3, Flag, or YY1. (E) Endogenous YY1 physically interacts with SMC3 in 5-fluorouracil enriched BMCs. Nuclear extracts of 5-fluorouracil–enriched BMCs from C57BL/6 mice were immunoprecipitated with anti-YY1 or anti-SMC3 antibody and were western blotted for SMC3 or YY1. (F) Diagram of YY1 functional domain and YY1 mutants. (G) YY1 amino acid sequence 298 through 414 is required for its physical interaction with SMC3. Nuclear extracts from transfected cells were immunoprecipitated with anti-Flag antibody and western blotted for SMC3, CTCF, or Flag.
YY1 physically interacts with cohesin complex proteins through its zinc finger domain. (A-B) YY1 physically interacts with cohesin complex proteins in 293 cells. (A) Nuclear extracts were immunoprecipitated with anti-Flag antibody and were western blotted for SMC1A, SMC3, RAD21, YY1, or Flag. (B) Reciprocal nuclear co-immunoprecipitation (co-IP). Nuclear extracts were immunoprecipitated with anti-SMC3 antibody and western blotted for SMC3, Flag, or YY1. (C-D) YY1 physically interacts with cohesin complex proteins in HPC7. (C) Nuclear extracts were immunoprecipitated with anti-Flag antibody and were western blotted for SMC1A, SMC3, RAD21, Flag or YY1. (D) Reciprocal nuclear co-IP. Nuclear extracts were immunoprecipitated with anti-SMC3 antibody and western blotted for SMC3, Flag, or YY1. (E) Endogenous YY1 physically interacts with SMC3 in 5-fluorouracil enriched BMCs. Nuclear extracts of 5-fluorouracil–enriched BMCs from C57BL/6 mice were immunoprecipitated with anti-YY1 or anti-SMC3 antibody and were western blotted for SMC3 or YY1. (F) Diagram of YY1 functional domain and YY1 mutants. (G) YY1 amino acid sequence 298 through 414 is required for its physical interaction with SMC3. Nuclear extracts from transfected cells were immunoprecipitated with anti-Flag antibody and western blotted for SMC3, CTCF, or Flag.
To access which YY1 functional domain is required for its interaction/association with cohesin complex protein SMC3, we transfected HEK-293 cells with wild-type YY1 or YY1 functional domain mutants: YY1 Δ170-200, YY1 ΔREPO, or YY1 Δ298-414. YY1 Δ170-200 deletes a transcriptional repression domain that interacts with numerous proteins5,42,43; YY1 ΔREPO deletes the PcG recruiting domain5; YY1 Δ298-414 deletes the 4 zinc fingers DNA binding domain44 (Figure 3F). Although wild-type YY1, YY1 Δ170-200, and YY1 ΔREPO physically interacted with SMC3, YY1 Δ298-414 did not (Figure 3G). Thus, YY1 zinc finger domain is required for YY1 interaction/association with cohesin complex protein SMC3 (Figure 3F-G). We conclude that YY1 and SMC3 occupied a large cohort of the genome by physically interacting with each other.
YY1 occupies the Smc3 promoter and represses SMC3 expression
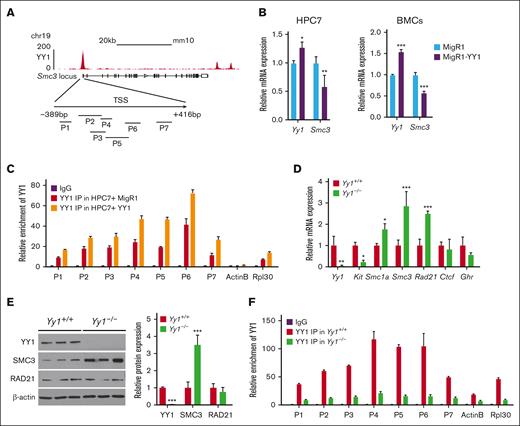
Interestingly, compiled ChIP-seq data sets from mouse embryonic stem cells38 and CUT&Tag data in HPC-7 cells show that YY1 binds strongly at the Smc3 promoter region (from −389 bp to +416 bp) from transcription start site (Figure 4A; supplemental Figure 3A-B). In contrast, no binding and a weak YY1 binding was detected at the Smc1 and Rad 21 promoters respectively (supplemental Figure 3A-B). To assess how YY1 regulates SMC3 expression, we assessed Smc3 messenger RNA (mRNA) expression by ectopically expressing YY1 in hematopoietic cells. We retrovirally transduced HPC-740,41 and total BMCs from B6 mice with MigR1-YY1 vs MigR1 empty vector control. Green fluorescent protein–positive HPC-7 cells and BMCs were sorted by fluorescence-activated cell sorting, and the YY1 expression levels were correlated with the median fluorescence intensity of green fluorescent protein expression (supplemental Figure 3C). Ectopic expression of YY1 in HPC-7 cells and total BMCs led to downregulation of Smc3 mRNA expression (Figure 4B) but did not impact Smc1 or Rad 21 mRNA expression (supplemental Figure 3C). To further validate the ChIP-seq and CUT&Tag data, ChIP quantitative polymerase chain reaction (qPCR) was conducted in HPC-7 cells infected with MigR1-YY1 vs MigR1 vector control. We detected the YY1 binding at the Smc3 promoter, and ectopic expression of YY1 further increased YY1 binding at the promoter region (Figure 4C). These experiments support that YY1 binds at the Smc3 promoter, and that high YY1 expression suppresses Smc3 expression at the transcript level in HSPCs. To test how loss of function of YY1 affects SMC3 expression and occupancy, we used a conditional Yy1-knockout allele Yy1f/f with loxP sites flanking the Yy1 promoter region and exon18 and crossed Yy1f/f mice with inducible Mx1-Cre. In Yy1f/fMx1-Cre mice, YY1 deletion was achieved after treatment with the interferon alfa (IFN-α)-stimulating pI-pC. Yy1f/fMx1-Cre (Yy1−/−) and Mx1-cre (Yy1+/+) mice received 4 doses of pI-pC injections and at 7 days after injections there was a >90% reduction of YY1 mRNA expression in Yy1−/− lineage negative (Lin−) BMCs (Figure 4D) compared with Yy1+/+ Lin− BMCs. Next, we evaluated Smc1a, Smc3, and Rad21 mRNA expressions in Yy1−/− vs Yy1+/+ Lin− BMCs. Consistent with our previous publication,17Yy1−/−Lin− cells had decreased Yy1 and Kit mRNA expression compared with Yy1+/+Lin− cells, and Ctcf and Ghr mRNA expression levels were similar. In contrast, Smc1a, Smc3, and Rad21 mRNA expressions were significantly increased in Yy1−/−compared to Yy1+/+Lin− BMCs (Figure 4D). In Yy1−/− total BMCs, SMC3 protein expression was significantly increased compared with Yy1+/+ cells, and RAD21 protein expression did not differ significantly (Figure 4E). Thus, SMC3 is upregulated in YY1-deficient BMCs. Consistently, ChIP-qPCR analysis show that YY1 occupied the Smc3 promoter area in Yy1+/+ total BMCs but not in Yy1−/−cells (Figure 4F). Our data support that YY1 deficiency leads to loss of YY1 binding/occupancy at the Smc3 promoter and upregulation of SMC3.
YY1 inhibits SMC3 expression directly. (A) ChIP-seq binding profile for YY1 at the Smc3 locus in mESCs and YY1 ChIP-qPCR primer design strategy at the Smc3 promoter (supplemental Figure 10). (B) Yy1 and Smc3 transcript levels in HPC7 and total BMCs with and without ectopic YY1 expression. (C) ChIP-qPCR analysis of YY1 bindings at the Smc3 promoter in HPC7 cells infected with MigR1-YY1 or MigR1 vector only. (D) quantitative reverse transcription PCR to detect transcript levels in Lin− BMCs of Yy1−/−and Yy1+/+ mice. Primers are listed in supplemental Figure 10. (E) Western blot and quantification to detect the YY1, SMC3, and RAD21 protein expressions in total BMCs of Yy1−/−and Yy1+/+ mice. (F) ChIP-qPCR analysis of the binding of YY1 at the Smc3 promoter region in Yy1+/+ and Yy1−/−total BMCs. Data are presented as means ± standard deviation (SD); ∗P < .05, ∗∗P < .01, and ∗∗∗P < .001.
YY1 inhibits SMC3 expression directly. (A) ChIP-seq binding profile for YY1 at the Smc3 locus in mESCs and YY1 ChIP-qPCR primer design strategy at the Smc3 promoter (supplemental Figure 10). (B) Yy1 and Smc3 transcript levels in HPC7 and total BMCs with and without ectopic YY1 expression. (C) ChIP-qPCR analysis of YY1 bindings at the Smc3 promoter in HPC7 cells infected with MigR1-YY1 or MigR1 vector only. (D) quantitative reverse transcription PCR to detect transcript levels in Lin− BMCs of Yy1−/−and Yy1+/+ mice. Primers are listed in supplemental Figure 10. (E) Western blot and quantification to detect the YY1, SMC3, and RAD21 protein expressions in total BMCs of Yy1−/−and Yy1+/+ mice. (F) ChIP-qPCR analysis of the binding of YY1 at the Smc3 promoter region in Yy1+/+ and Yy1−/−total BMCs. Data are presented as means ± standard deviation (SD); ∗P < .05, ∗∗P < .01, and ∗∗∗P < .001.
SMC3 expression is normalized in Yy1−/−Smc3+/− mice
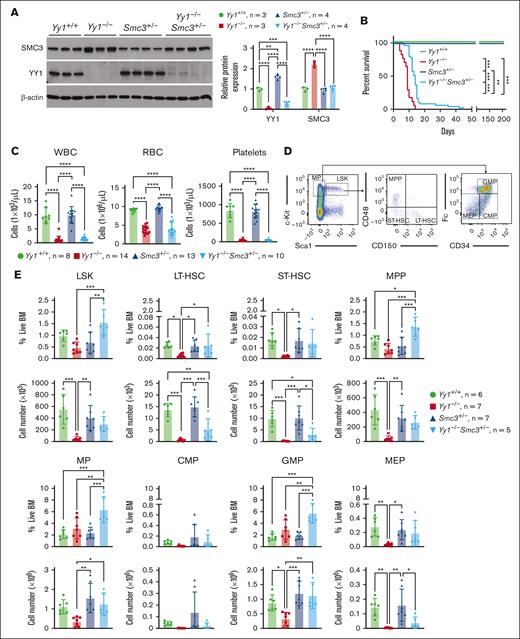
Because SMC3 is upregulated in YY1-deficient HSPCs (Figure 4D-E),17 we evaluate the functional significance of YY1 regulation of SMC3 by deleting 1 copy of Smc3 in YY1 knockout mice. To generate Yy1−/−Smc3+/− mice, Yy1f/fSmc3f/f mice were first generated by crossing Yy1f/f with Smc3f/f and then crossing Yy1f/+Smc3f/+ heterozygotes. Yy1f/fSmc3f/f mice were subsequently crossed with Yy1f/+Mx1-Cre mice to generate Yy1f/fSmc3f/+Mx1-Cre mice (Yy1−/−Smc3+/−; supplemental Figure 4A). After pI-pC injections, homozygous Yy1 and heterozygous Smc3 were selectively deleted in Yy1f/fSmc3f/+ BMCs, and loxP-flanked Yy1f and Smc3f were not detected by PCR. Using DNA from tail samples as a control, we show that rearrangement/deletion events at Yy1 and Smc3 were specific to the hematopoietic cells (supplemental Figure 4B). Mx1-Cre (Yy1+/+), Yy1f/fMx1-Cre (Yy1−/−), Smc3f/+Mx1-Cre (Smc3+/−), and Yy1f/fSmc3f/+Mx1-Cre (Yy1−/−Smc3+/−) mice were evaluated after 4 doses of pI-pC injections. Interestingly, although SMC3 was upregulated in Yy1−/−BMCs, SMC3 protein expression was normalized to the wild-type level in Yy1−/−Smc3+/− BMCs (Figure 5A). Thus, we concluded that SMC3 is overexpressed in YY1-deficient BMCs, and SMC3 expression level is normalized to the wild-type level in Yy1−/−Smc3+/− mice.
Smc3 haploinsufficiency partially rescues Yy1−/− HSPC percentages and numbers. (A) SMC3 expression was normalized in Yy1−/−Smc3+/− BMCs. Western blot and quantification to detect SMC3 and YY1 protein expressions in BMCs of Yy1−/−, Yy1+/+, Smc3+/−, and Yy1−/−Smc3+/− mice. (B) Survival curve of Yy1+/+, Yy1−/−, Smc3+/−, and Yy1−/−Smc3+/− mice. (C) Complete blood count (CBC) analysis. (D) Representative flow gating strategy for LSK, LT-HSC, ST-HSC, MPP, MP, common myeloid progenitors (CMP), granulocyte monocyte progenitors (GMP), and megakaryocyte erythroid progenitors (MEP) populations. (E) Quantification of percentages and absolute numbers of LSK, LT-HSC, ST-HSC, MPP, MP, CMP, GMP and MEP populations. N represents the number of mice; data are presented as means ± SD; ∗P < .05, ∗∗P < .01, and ∗∗∗P < .001.
Smc3 haploinsufficiency partially rescues Yy1−/− HSPC percentages and numbers. (A) SMC3 expression was normalized in Yy1−/−Smc3+/− BMCs. Western blot and quantification to detect SMC3 and YY1 protein expressions in BMCs of Yy1−/−, Yy1+/+, Smc3+/−, and Yy1−/−Smc3+/− mice. (B) Survival curve of Yy1+/+, Yy1−/−, Smc3+/−, and Yy1−/−Smc3+/− mice. (C) Complete blood count (CBC) analysis. (D) Representative flow gating strategy for LSK, LT-HSC, ST-HSC, MPP, MP, common myeloid progenitors (CMP), granulocyte monocyte progenitors (GMP), and megakaryocyte erythroid progenitors (MEP) populations. (E) Quantification of percentages and absolute numbers of LSK, LT-HSC, ST-HSC, MPP, MP, CMP, GMP and MEP populations. N represents the number of mice; data are presented as means ± SD; ∗P < .05, ∗∗P < .01, and ∗∗∗P < .001.
Deletion of 1 Smc3 allele partially rescues LT-HSC percentage in YY1-deficient mice
Consistent with our previously published result,17 YY1-deficient mice died ∼10 days after pI-pC injections.17 Although Yy1−/−Smc3+/− mice demonstrated increased survival compared with YY1-deficient mice, they still had significant survival defects compared to wild-type or Smc3+/− mice (Figure 5B). Similar to YY1-deficient mice, Yy1−/−Smc3+/− mice were severely pancytopenic with reduction of red blood cells, platelets, and leukocytes (Figure 5C). Although Yy1−/−mice had decreased numbers of LT-HSCs (Lin−Sca1+c-Kit+CD48−CD150+), short-term HSCs (ST-HSC; Lin−Sca1+c-Kit+CD48−CD150−), MPPs (Lin−Sca1+c-Kit+CD48+CD150−), GMP (Lin−Sca1−c-Kit+CD34+CD16/32hi), and MEP (Lin−Sca1−c-Kit+CD34−CD16/32low) compared with wild-type mice, Yy1−/−Smc3+/− mice had increased percentages of LT-HSCs, MPPs, MPs, and GMPs compared with Yy1−/−mice. Strikingly, Yy1−/−Smc3+/− mice had similar cell numbers of MPs and GMPs compared with wild-type mice. Thus, deletion of 1 allele of Smc3 leads to a partial rescue of HSC and progenitor cell percentages and numbers in YY1-deficient mice (Figure 5D-E; supplemental Figure 5).
Deletion of 1 Smc3 allele in YY1-deficient HSCs partially restores HSC quiescence
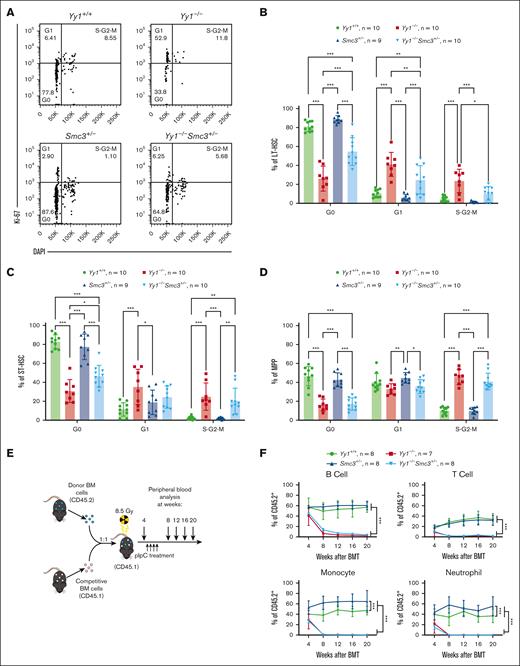
Because our previous data showed that YY1 deficiency caused decreased HSC quiescence and self-renewal,17 we assessed the impact of deleting 1 copy of Smc3 on HSC functions in YY1-deficient mice. In Yy1−/−Smc3+/− mice, there was an increase in the percentage of cells in the G0 phase in LT-HSC and ST-HSC compartments when compared with Yy1−/−HSCs (Figure 6A-C) but not in the MPP population (Figure 6D). The percentages of cells in active proliferative stages (G1 and/or S-G2-M phases) were decreased in Yy1−/−Smc3+/− LT-HSCs and ST-HSCs compared with Yy1−/− HSCs. Our result showed that HSC quiescence was partially restored in Yy1−/−Smc3+/− mice by deleting 1 copy of Smc3 in YY1-deficient HSCs.
Smc3 haploinsufficiency partially restores HSC quiescence in Yy1−/−mice. (A) Representative gating strategy for Ki67/DAPI cell proliferation assay of LT-HSCs (Lin−Sca1+c-Kit+CD48−CD150+). Cells in the G0 phase were defined as Ki67−DAPI−. Cells in the G1 phase were defined as Ki67+DAPI−. Cells in S/G2/M phase were defined as Ki67+DAPI+. (B-D) Quantification of percentages of LT-HSC, ST-HSC, and MPP cells in G0, G1, and S/G2/M phase. (E) Experimental strategy of BM transplantation (BMT). (F) Quantification of donor-derived contribution in B-cell (Thy1.2−CD19+), T-cell (Thy1.2+CD19−), monocyte (Mac1+Gr1−), and neutrophil (Mac1+Gr1+) populations at 4, 8, 12, 16, and 20 weeks after BMT. N represents the number of mice; data are presented as means ± SD; ∗P < .05, ∗∗P < .01, and ∗∗∗P < .001.
Smc3 haploinsufficiency partially restores HSC quiescence in Yy1−/−mice. (A) Representative gating strategy for Ki67/DAPI cell proliferation assay of LT-HSCs (Lin−Sca1+c-Kit+CD48−CD150+). Cells in the G0 phase were defined as Ki67−DAPI−. Cells in the G1 phase were defined as Ki67+DAPI−. Cells in S/G2/M phase were defined as Ki67+DAPI+. (B-D) Quantification of percentages of LT-HSC, ST-HSC, and MPP cells in G0, G1, and S/G2/M phase. (E) Experimental strategy of BM transplantation (BMT). (F) Quantification of donor-derived contribution in B-cell (Thy1.2−CD19+), T-cell (Thy1.2+CD19−), monocyte (Mac1+Gr1−), and neutrophil (Mac1+Gr1+) populations at 4, 8, 12, 16, and 20 weeks after BMT. N represents the number of mice; data are presented as means ± SD; ∗P < .05, ∗∗P < .01, and ∗∗∗P < .001.
Next, we assessed blood chimerism in mice transplanted with Mx1-Cre, Yy1f/fMx1-Cre, Smc3f/+Mx1-Cre, and Yy1f/fSmc3f/+Mx1-Cre BMCs. CD45.1 recipient mice were treated with pI-pC injections at 4 weeks after BM transplantation and donor-derived percentages (% CD45.2+) were evaluated at 4, 8, 12, 16, and 20 weeks after BM transplant (Figure 6E). At week 4, before pI-pC injections, all 4 cohorts had similar donor-derived percentages. Beginning at week 8 (4 weeks after pI-pC injections), mice transplanted with Yy1f/fMx1-Cre and Yy1f/fSmc3f/+Mx1-Cre BMCs had significantly decreased donor-derived percentages in peripheral monocyte, neutrophil, and B- and T-cell compartments, compared with mice transplanted with Mx1-Cre or Smc3f/+Mx1-Cre BMCs. Mice transplanted with Smc3f/+Mx1-Cre BMCs had a higher donor-derived percentage in the myeloid compartments, as previously described26 (Figure 6F). Our data support that both Yy1−/−and Yy1−/−Smc3+/− HSCs fail to reconstitute blood. Thus, restoring SMC3 expression level in YY1-deficient mice was able to partially reestablish the HSC quiescence but not the capacity to reconstitute blood.
YY1 regulates HSC metabolism via an SMC3-independent pathway
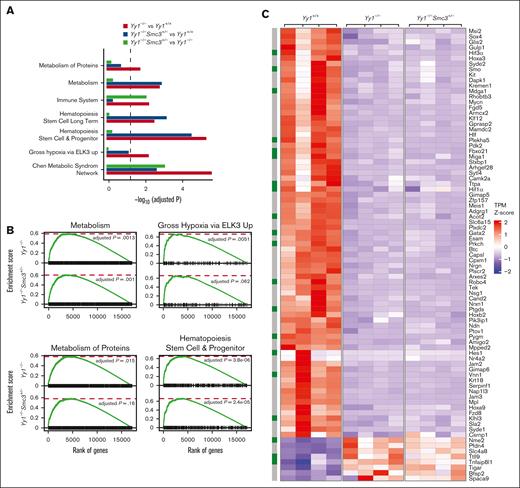
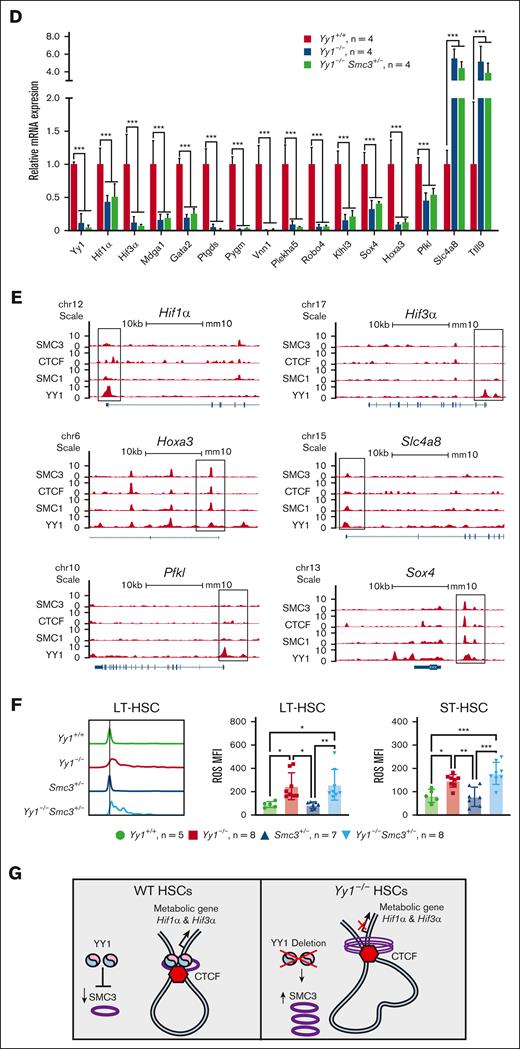
To further elucidate the underlying mechanisms of YY1 regulation of HSC functions, RNA-seq analysis was conducted in LSK cells sorted from Yy1−/−, Yy1−/−Smc3+/−, and Yy1+/+ mice. There were 836 upregulated and 1502 downregulated genes detected in Yy1−/−LSK compared with Yy1+/+ LSK cells, and there were 621 upregulated and 1370 downregulated genes detected in Yy1−/−Smc3+/− LSK compared with Yy1+/+ LSK cells (supplemental Figure 6). Genes involved in HSC long-term self-renewal and metabolism were enriched in pathway analysis in Yy1−/−and Yy1−/−Smc3+/− LSKs compared with Yy1+/+ cells (Figure 7A). Genes involved in the immune system were enriched in pathway analysis comparing Yy1−/−Smc3+/− with Yy1−/−LSKs. Gene set enrichment analysis showed that pathways involved in metabolism were deregulated in both Yy1−/−and Yy1−/−Smc3+/− LSK cells compared with wild-type LSKs (Figure 7B). Many genes that are critical for HSC metabolism and hypoxia were dysregulated; Hif1α, Hif3α, Plekha5, Klhl3, Pfkl, Vnn1, Mdga1, Gata2, Ptgds, Sox4, and Hoxa3 were downregulated, and Ttll9 and Slc4a8 were upregulated in Yy1−/−and Yy1−/−Smc3+/− LSK cells compared with Yy1+/+ cells (Figure 7C-D). Based on compiled ChIP-seq analysis (Figure 1), YY1 occupied the promoter areas of Hif1α, Hif3α, Hoxa3, and Pfkl without cohesin. In contrast, YY1 colocalized with cohesin and/or CTCF at the promoters of Sox4, Hoxa3, and Slc4a8 (Figure 7E). Quantitative reverse transcription PCR confirm that Hif1α and Hif3α were downregulated in Yy1−/−LSK cells and deletion of 1 copy of Smc3 did not restore Hif1α and Hif3α expressions in Yy1−/−Smc3+/− LSK cells (supplemental Figure 7). Thus, YY1 controls HSC metabolic genes regardless of Smc3 expression level. To assess gene expression changes upon acute protein deletion, we knocked down YY1 in HPC-7 cells by shRNA. Compared with sh-Luc control, Hif3α, Plekha5, and Klhl3 were downregulated (supplemental Figure 8). Because Hif1α and Hif3α are critical for maintaining the proper intracellular ROS level in HSCs, we analyzed intracellular ROS levels in Yy1−/−, Yy1−/−Smc3+/−, and Yy1+/+ LT-HSCs (Lin−Sca1+c-Kit+CD48−CD150+) and ST-HSCs (Lin−Sca1+c-Kit+CD48−CD150−) by flow analysis. YY1 deficiency leads to an increase of intracellular ROS in LT-HSCs and ST-HSCs, and the increase of ROS was also detected in Yy1−/−Smc3+/− HSCs (Figure 7F). Our results show that YY1 controls HSC metabolic genes and regulates intracellular ROS level in HSCs, and YY1 regulation of HSC ROS and metabolism is independent of the YY1–SMC3 axis.
Yy1−/−LSKs exhibit an aberrant genetic network with corruption of genes involved in HSC metabolism. RNA-seq–based comparison of gene expression in sorted Yy1+/+, Yy1−/−, and Yy1−/−Smc3+/− LSK cells. (A-B) Gene set enrichment analysis of genes deregulated in Yy1−/−vs Yy1+/+, Yy1−/−Smc3+/− vs Yy1+/+, and Yy1−/−Smc3+/− vs Yy1−/−. Enriched biological processes are shown with corresponding adjusted P values (A). Genes involved in metabolism and HSPCs are enriched in Yy1−/−and Yy1−/−Smc3+/− LSK cells compared with Yy1+/+ (B). (C) Heat map depicting selected upregulated and downregulated genes involved in regulation of HSPC function based on transcript per million. The green boxes label the genes involved in metabolism pathway. (D) mRNA expression levels of genes that are critical for metabolism and HSC functions based on the transcript per million of RNA-seq. (E) YY1, cohesion, and CTCF occupancy at the promoters of genes that are critical for HSC function and metabolism. (F) Increased intracellular ROS levels in Yy1−/−and Yy1−/−Smc3+/− HSCs. (G) Schematic diagram shows that YY1 represses SMC3 expression and interacts with SMC3 to facilitate chromatin structures of genes that are critical for HSC metabolism. In YY1-deficient HSCs, SMC3 is upregulated and interacts with CTCF, which leads to changes of chromatin conformation and altered metabolic gene expression. N represents the number of mice; data are presented as means ± SD; ∗P < .05 ∗∗P < .01, and ∗∗∗P < .001.
Yy1−/−LSKs exhibit an aberrant genetic network with corruption of genes involved in HSC metabolism. RNA-seq–based comparison of gene expression in sorted Yy1+/+, Yy1−/−, and Yy1−/−Smc3+/− LSK cells. (A-B) Gene set enrichment analysis of genes deregulated in Yy1−/−vs Yy1+/+, Yy1−/−Smc3+/− vs Yy1+/+, and Yy1−/−Smc3+/− vs Yy1−/−. Enriched biological processes are shown with corresponding adjusted P values (A). Genes involved in metabolism and HSPCs are enriched in Yy1−/−and Yy1−/−Smc3+/− LSK cells compared with Yy1+/+ (B). (C) Heat map depicting selected upregulated and downregulated genes involved in regulation of HSPC function based on transcript per million. The green boxes label the genes involved in metabolism pathway. (D) mRNA expression levels of genes that are critical for metabolism and HSC functions based on the transcript per million of RNA-seq. (E) YY1, cohesion, and CTCF occupancy at the promoters of genes that are critical for HSC function and metabolism. (F) Increased intracellular ROS levels in Yy1−/−and Yy1−/−Smc3+/− HSCs. (G) Schematic diagram shows that YY1 represses SMC3 expression and interacts with SMC3 to facilitate chromatin structures of genes that are critical for HSC metabolism. In YY1-deficient HSCs, SMC3 is upregulated and interacts with CTCF, which leads to changes of chromatin conformation and altered metabolic gene expression. N represents the number of mice; data are presented as means ± SD; ∗P < .05 ∗∗P < .01, and ∗∗∗P < .001.
Discussion
YY1, cohesion, and CTCF have been implicated in the formation of DNA loops needed for variable diversity joining rearrangement at the immunoglobulin locus during B-cell development.13,45-47 Moreover, YY1 has been identified as a new critical chromatin structural factor in addition to CTCF and cohesin to mediate DNA looping and alteration of chromatin and chromosome tertiary structure.3,48 YY1 mediates transcriptional repression through its C-terminal region that contains 4 C2H2-type zinc finger motifs (amino acids 298-414),42,43 whereas the N-terminal region of YY1 (amino acids 1-200) mediates transcriptional activation.2,42,43,49,50 YY1 recruits PcG proteins and causes consequent histone modification through a sequence motif that maps to amino acid residues 201 to 226 (the YY1REPO domain).5 The C-terminal portion of YY1, including amino acids 201 through 414 (YY1 201-414), is critical for chromatin looping needed for immunoglobulin class switching recombination,51 as well as for X-chromosome inactivation52 (Figure 3F). Young et al demonstrated that YY1 binds to active enhancers and promoter-proximal elements and forms dimers that facilitate the long-distance interaction of these DNA elements.3 Our studies here show that YY1 physically interacts with cohesin complex proteins via the C-terminal zinc finger domain (Figure 3G), and YY1 and cohesin complex proteins cooccupy a large cohort of promoters genome wide (Figures 1 and 2). Interestingly, YY1 binds at the Smc3 promoter directly (Figure 4A,C,F; supplemental Figure 3A-B) and represses SMC3 expression (Figure 4B,D-E). Genes that were occupied by YY1 play distinct biological functions in metabolism compared with genes that were only occupied by CTCF and cohesin (Figures 1C-D and 2D). Consistent with YY1 genome-wide occupancy (Figures 1D and 2D), YY1 deficiency leads to a deregulated genetic network governing cell metabolisms (Figure 7A-D) and failure to maintain proper ROS levels in HSCs (Figure 7F). Interestingly, although SMC3 expression was normalized to the wild-type level in Yy1−/−Smc3+/− mice, Yy1−/−Smc3+/− HSCs fail to reconstitute blood, likely because of deregulated HSC metabolic genes and elevated ROS levels. Thus, YY1 controls HSC functions via both SMC3-dependent and -independent pathways.
One possible hypothetical model is that YY1 binds to active enhancers and promoter-proximal elements and forms heterodimers with SMC3 and/or CTCF (Figure 3),53 or forms homodimers with itself that facilitate the formation of long-distance DNA loops.3 Without YY1, SMC3 is upregulated (Figure 4D-E), and remains bound at most proximal promoter regions (Figure 2E). The promoter-enhancer looping is mainly maintained by cohesin interacting with other chromatin structural factors such as CTCF. Because larger chromosomal loop structures are usually made by the interaction of CTCF proteins with cohesin complex proteins,54-57 the chromatin/DNA looping structures are altered in YY1-deficient HSCs. Because of the chromatin conformation change, genes involved in cell metabolism, which are mainly occupied by YY1 during normal conditions, remained deregulated regardless of the presence of other chromatin structural factors. Thus, YY1-deficient HSCs have decreased Hif1α and Hif3α, elevated intracellular ROS, and fail to reconstitute blood (Figure 7G). It will be interesting to further analyze high-order chromatin structures of gene loci that are critical for HSC metabolism in Yy1+/+, Yy1−/−, and Yy1−/−Smc3+/− HSPCs in the future.
In adult humans, ∼90% of HSCs exist in a quiescent nondividing state (G0), and up to a third of the remaining 10% of HSCs actively proliferate and are found in other stages of the cell cycle.58-60 Quiescence is a fundamental characteristic of HSCs in adult BM, and adult HSCs can remain in a quiescent state for a prolonged time.60 Generally, HSC cycle quiescence parallels its capacity for self-renewal and long-term repopulating activity. Thus, the cell cycle must be precisely regulated in HSCs to ensure adequate hematopoiesis without stem cell exhaustion.61,62 Many extrinsic factors regulate and balance the processes of quiescence, self-renewal, and differentiation of HSCs63-67: these include proinflammatory cytokines (eg, transforming growth factor β, IFN-γ, and IFN-α)68-70 and osteoblastic and sinusoidal vascular niches.63-67 Moreover, the impact of extrinsic regulators is modified and modulated by intrinsic regulators of cell cycle progression in HSCs, including some transcription factors.71-74 Our study shows that YY1 regulatory function in maintaining HSC quiescence is at least partially through its regulation of cohesin complex protein SMC3. Although YY1-deficient HSPCs are highly proliferative and have a high SMC3 expression level, normalizing SMC3 expression level in YY1-deficient mice is able to partially restore HSC quiescence (Figure 6A-D). Although HSC quiescence was partially restored in Yy1−/−Smc3+/− mice, Yy1−/−Smc3+/− HSCs fail to reconstitute blood upon BM transplant (Figure 6E-F). Therefore, YY1 regulation of cohesin is a critical driver for HSC quiescence but not for all HSC functions. Although genes/pathways that are critical for cell metabolism are deregulated in both Yy1−/−and Yy1−/−Smc3+/− samples, pathway analysis show that genes involved in immune system are differently regulated in Yy1−/−and Yy1−/−Smc3+/− cells (Figure 7A). SMC3 occupancy at the promoter regions, which are critical for cell metabolism, heavily rely on presence of YY1 (Figure 2F), and this may explain why normalization of SMC3 expression is not sufficient to rescue HSC metabolic defects. It will be interesting to further dissect how the YY1–SMC3 axis controls the cross talk between HSCs and the immune system, such as immune cells in the BM microenvironment, in the future.
Acknowledgments
The authors thank the University of Wisconsin Carbone Comprehensive Cancer Center for use of its Shared Services (Flow Cytometry Core and Cancer Informatics Shared Resources), which are supported by University of Wisconsin Carbone Comprehensive Cancer Center grant P30 CA014520, to complete this research. The authors thank Ross Levine for providing Smc3f/f mice.
This work was supported by National Institutes of Health Office of Infrasture grant R03OD026603 and National Heart, Lung, and Blood Institute grant R01HL146540 (X.P.), and the Coordination for the Improvement of High Education Personnel, Brazil (A.L.F.V.A.). A.D.V. is supported by a National Cancer Institute career development grant K08 CA215317 and a grant from the Edward P. Evans Foundation.
Authorship
Contribution: X.P. designed experiments; Z.L., A.L.F.V.A., Y.W., S.S., A.K., and X.P. performed experiments; Z.L., A.L.F.V.A., Y.W., P.L., S.J.M., A.D.V., M.B., and X.P. analyzed and interpreted the data; and Z.L., Y.W., A.L.F.V.A., P.L., and X.P. wrote the manuscript.
Conflict-of-interest disclosure: The authors declare no competing financial interests.
Correspondence: Xuan Pan, Department of Medical Sciences, University of Wisconsin-Madison Medical Sciences, 2015 Linden Dr, 4470 SVM, Madison, WI 53706; email: xpan24@wisc.edu.
References
Author notes
Z.L., Y.W., and A.L.F.V.A. contributed equally to this work.
The data sets generated and/or analyzed during this study are available on reasonable request from the corresponding author, Xuan Pan (xpan24@wisc.edu).
The full-text version of this article contains a data supplement.

