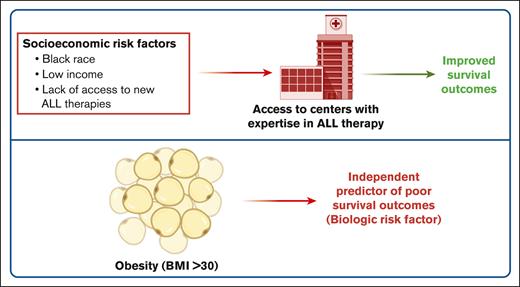
Patients with ALL treated at dedicated ALL centers of excellence have improved survival outcomes independent of their race or income.
Obesity is a biologic determinant of adverse OS in adults with ALL.
Visual Abstract
Various socioeconomic and biologic factors affect cancer health disparities and differences in health outcomes. To better characterize the socioeconomic vs biologic determinants of acute lymphoblastic leukemia (ALL) outcomes, we conducted a single-institution, retrospective analysis of adult patients with ALL treated at the University of Chicago (UChicago) from 2010 to 2022 and compared our outcomes with the US national data (the Surveillance, Epidemiology, and End Results [SEER] database). Among 221 adult patients with ALL treated at UChicago, BCR::ABL1 was more frequent in patients with higher body mass index (BMI; odds ratio [OR], 7.64; 95% confidence interval [CI], 1.17-49.9) and non-Hispanic Black (NHB) ancestry (59% vs 24% in non-Hispanic White (NHW) and 20% in Hispanic patients; P = .001). In a multivariable analysis, age (hazard ratio [HR], 6.93; 95% CI, 2.27-21.1) and higher BMI at diagnosis (HR, 10.3; 95% CI, 2.56-41.5) were independent predictors of poor overall survival (OS). In contrast, race or income were not predictors of OS in the UChicago cohort. Analysis of the national SEER database (2010-2020) demonstrated worse survival outcomes in Hispanic and NHB patients than in NHW patients among adolescent and young adults (AYAs) but not in older adults (aged >40 years). Both AYA and older adult patients with higher median household income had better OS than those with lower income. Therefore, multidisciplinary medical care coupled with essential supportive care services offered at centers experienced in ALL care may alleviate the socioeconomic disparities in ALL outcomes in the United States.
Introduction
Implementation of pediatric-inspired chemotherapy regimens for acute lymphoblastic leukemia (ALL) in the adolescent and young adult (AYA) population has markedly improved survival outcomes.1 Previous work demonstrated that non-Hispanic White (NHW) patients had better survival outcomes in the real-world AYA setting than Hispanic and non-Hispanic Black (NHB) patients.2-4 However, this effect was not observed in the pivotal Cancer and Leukemia Group B (CALGB) 10403 clinical trial, in which Hispanic patients had similar overall survival (OS) outcomes compared with NHW patients.5 Various socioeconomic and biologic factors potentially affect cancer health disparities and differences in health outcomes, including race/ethnicity, body mass index (BMI), education, and annual household income.6,7 The element and degree of social deprivation is a modifiable, extrinsic factor that can be affected at the community, institutional, or individual level.7-9 To better characterize the socioeconomic vs biologic determinants of ALL outcomes, we conducted a single-institution, retrospective analysis of adult patients with ALL treated at the University of Chicago and compared our outcomes with the US national data obtained through the Surveillance, Epidemiology, and End Results (SEER) program.10 We sought to investigate the impact of socioeconomic factors on ALL outcomes when patients receive care at a tertiary care center with a multidisciplinary team geared toward the care of patients with ALL.
Methods
Study cohort
Adult patients with ALL treated at the University of Chicago between 2010 and 2022 were studied. Informed consent was obtained from patients according to the institutionally approved protocols in accordance with the Declaration of Helsinki. Diagnosis, relapse, and disease status were confirmed and assigned according to World Health Organization criteria.11 AYAs with ALL (aged 18-40 years) were largely treated with CALGB 10403–based pediatric-inspired regimen.1 Older adults (aged >40 years) were treated with lower-intensity approaches, such as chemotherapy or combinations of targeted therapeutic approaches on a clinical trial basis (summarized in Table 1). All patients with BCR::ABL1-positive B-cell ALL (B-ALL) received tyrosine kinase inhibitors. Because of treatment differences, outcomes of AYA and older patients were analyzed separately. For definition of self-reported race, we followed the guidelines from the National Cancer Institute: (1) NHW, a person having origins in any of the original peoples of Europe, the Middle East, or North Africa; (2) NHB or African American, a person having origins in any of the Black racial groups of Africa; (3) Hispanic or Latino, a person of Cuban, Mexican, Puerto Rican, South or Central American, or other Spanish culture or origin, regardless of race; and (4) Asian, a person having origins in any of the original peoples of the Far East, Southeast Asia, or the Indian subcontinent. BMI was recorded at diagnosis. Annual median income was determined based on the zone improvement plan code and the Illinois household income data from 2010 to 2022 using Federal Reserve Economic Database. Based on these data, we categorized income as high (>$90 000), middle ($50 000-$90 000), and low (<$50 000).
Demographic characteristics of the University of Chicago ALL cohort (n = 221)
| . | N (%) . |
|---|---|
| Age, median (range), y | 43 (18-88) |
| Female sex, n (%) | 105 (48) |
| BMI, n (%) | |
| <30 | 150 (68) |
| 30-40 | 54 (24) |
| >40 | 17 (8) |
| Race/ethnicity, n (%) | |
| NHW | 131 (59) |
| Hispanic | 48 (22) |
| NHB | 33 (15) |
| Asian | 7 (3) |
| >1 race | 2 (1) |
| Median income, n (%) | |
| High | 129 (59) |
| Middle | 73 (33) |
| Low | 17 (8) |
| Immunophenotype, n (%) | |
| B-ALL | 185 (84) |
| Pre–T-ALL | 25 (11) |
| ETP-ALL | 11 (5) |
| ALL subtype, n (%) | |
| B-ALL | |
| Ph+ | 50 (23) |
| Ph-like | 26 (12) |
| Low hypodiploid | 17 (8) |
| KMT2A-rearranged | 13 (6) |
| High hyperdiploid | 8 (4) |
| T-ALL | |
| HOXA-dysregulated | 10 (5) |
| TAL1-rearranged | 5 (3) |
| Firstline therapy | |
| CALGB 10403 based | 104 (47) |
| HyperCVAD based | 41 (19) |
| CALGB 10701 | 25 (11) |
| Lower-intensity chemotherapy | 12 (5) |
| TKI + antibody | 11 (5) |
| A41703 | 7 (3) |
| Mini-hyperCVD + venetoclax | 7 (3) |
| Inotuzumab | 5 (2) |
| TKI | 4 (2) |
| Asciminib + dasatinib | 3 (1) |
| Blinatumomab | 2 (1) |
| Allogeneic HCT, n (%) | 49 (22) |
CVAD, cyclophosphamide, vincristine, adriamycin, dexamethasone; ETP, early T precursor; HCT, hematopoietic cell transplant; Ph, Philadelphia chromosome; T-ALL, T-cell ALL; TKI, tyrosine kinase inhibitor.
We extracted data from the public-use US population–based cancer registries of the SEER program in order to estimate the OS of patients with ALL diagnosed between 2010 and 2020. This program collects cancer incidence and survival data from a diverse population of patients in the United States with efforts to include historically excluded populations.10 ALL was identified by International Classification of Diseases for Oncology histology codes 9811 to 9818, 9826, and 9835 to 9837.
Genomic profiling and molecular subtyping
Subtype classification of 221 ALL cases was based on the use of multiple assays, including chromosome analysis (karyotype), fluorescence in-situ hybridization, polymerase chain reaction for known fusions, RNA-sequencing, and single nucleotide polymorphism chromosome microarray analysis for copy number abnormalities and copy-neutral loos of heterozygosity. These assays were performed as part of routine clinical care in College of American Pathologists-accredited and Clinical Laboratory Improvement Amendments-certified laboratories. Diagnostic hematopoietic samples underwent high-throughput genetic sequencing with a targeted deep sequencing assay of 178 genes (OncoPlus).12 In addition to analyzing DNA sequencing data for copy number abnormalities, we performed single nucleotide polymorphism chromosome microarray analysis for patients with aneuploidy, including patients with suspected masked hypodiploidy. This was performed using Affymetrix CytoScan HD Array kit. Concomitantly, a hybrid capture–based RNA-sequencing assay was used to detect known and novel fusions. BCR::ABL1-like gene signature was assessed by fluorescence in-situ hybridization for common fusions (CRLF2, ABL1, ABL2, JAK2, CSF1R, and PDGFRB) and RNA-sequencing for these fusions.
Statistical analysis
All statistical analyses were performed using John's Macintosh Project version 17.0 software (Statistical Analysis System Institute, Cary, NC) and GraphPad Prism version 8 (GraphPad Software, La Jolla, CA). Descriptive statistics were used to compare baseline patient and leukemia characteristics as per the ethnicity, BMI, and median income. Categorical outcomes were compared using the Kruskal-Wallis test. OS was defined as the time from diagnosis until death or last follow-up. OS was calculated using the Kaplan-Meier method, and differences between the curves were assessed using the log-rank test. Univariable and multivariable Cox regression analyses were used to identify the impact of potential factors on OS. Odds ratios (ORs) and hazard ratios (HRs) were presented with their 95% confidence intervals (CIs).
Results
Associations of socioeconomic variables in adult patients with ALL
Demographic characteristics of 221 adult patients with ALL treated at the University of Chicago are summarized in Table 1. Median age at diagnosis was 43 years, and 93 patients (42%) were in the AYA cohort. At ALL diagnosis, 32% of patients were obese (BMI ≥ 30 kg/m2). When grouped based on ethnicity, 59% were NHW, 22% were Hispanic, 15% were NHB, 3% were Asian, and 1% reported >1 ethnicity. T-cell ALL was more frequent in NHB patients (33%) than in NHW (14%) and Hispanic patients (8%; P = .007). The frequencies of cellular therapies (allogeneic hematopoietic cell transplant or chimeric antigen receptor T-cell therapy) were not significantly different between different ethnicities of patients with BCR::ABL1-negative B-ALL: 3 of 15 (20%) in NHB patients, 23 of 90 (25%) in NHW patients, and 11 of 37 (29%) in Hispanic patients (P = .75). The frequencies of novel therapies between racial groups are summarized in supplemental Table 1.
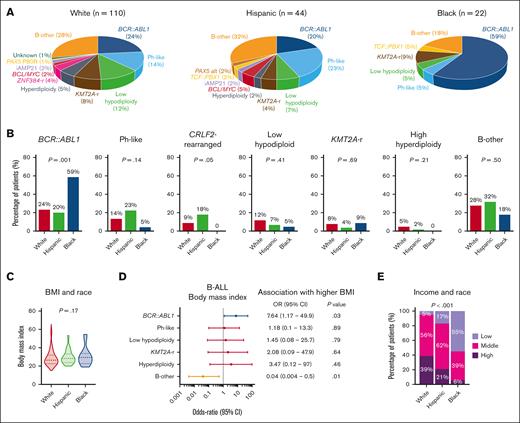
We investigated the distribution of World Health Organization 2022 classification–defined B-ALL subtypes among 185 patients who underwent comprehensive genomic profiling as part of clinical evaluation at diagnosis (Figure 1A). BCR::ABL1 was more frequently found in NHB patients with ALL than in NHW and Hispanic patients (59% vs 24% and 20%, respectively; P = .001; Figure 1B). CRLF2-rearranged BCR::ABL1-like B-ALL was more frequently seen in Hispanic patients than in NHW and NHB patients (18% vs 9% and 0%, respectively; P = .05). The distribution of BMI at diagnosis was similar between different race groups (Figure 1C). We further investigated the relationship between high BMI and B-ALL subtypes and found that obesity was often associated with BCR::ABL1–positive disease (Figure 1D). Relative to NHW patients with ALL, both Hispanic and NHB patients had significantly lower annual household income, with 17% and 55% of Hispanic and NHB patients reporting <$50 000, respectively (P < .001; Figure 1E).
Socioeconomic determinants of ALL biology. (A) Pie charts depicting the frequencies of B-ALL subtypes in patients stratified by race. (B) Bar graphs showing racial distribution of common B-ALL subtypes. (C) Violin plots showing the distribution of BMI in patients with ALL stratified by race. (D) Forest plot showing the OR for the association between B-ALL genetic subtypes and BMI at diagnosis. (E) Bar graph showing the association between median income and race in adult patients with ALL.
Socioeconomic determinants of ALL biology. (A) Pie charts depicting the frequencies of B-ALL subtypes in patients stratified by race. (B) Bar graphs showing racial distribution of common B-ALL subtypes. (C) Violin plots showing the distribution of BMI in patients with ALL stratified by race. (D) Forest plot showing the OR for the association between B-ALL genetic subtypes and BMI at diagnosis. (E) Bar graph showing the association between median income and race in adult patients with ALL.
Impact of race, obesity, and median household income on survival outcomes of adults with ALL
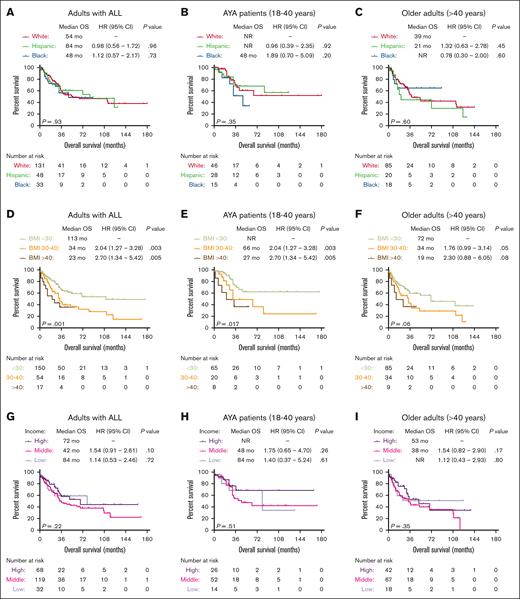
Among patients with ALL in the University of Chicago, we did not observe a significant difference in OS outcomes of patients from different race/ethnicity groups (Figure 2A). Similar OS outcomes were seen among the 3 most common race/ethnicity groups (NHW, Hispanic, and NHB) when patients were stratified based on age groups (AYA vs older adults aged >40 years) (Figure 2B,C), B- vs T-lineage phenotype (supplemental Figure 1A,B), or BCR::ABL1 status (supplemental Figure 1C,D). However, obesity at ALL diagnosis was associated with adverse OS, and median OS for patients with BMI <30, 30 to 40, and >40 kg/m2 were 113 months, 34 months (HR, 2.04; 95% CI, 1.27-3.28; P = .003), and 23 months (HR, 2.70; 95% CI, 1.34-5.42; P = .005), respectively (Figure 2D). The adverse prognostic impact of obesity was seen in both AYA and older adult cohorts (Figure 2E-F). Finally, we did not observe significant OS differences when patients were stratified based on their annual household income (Figure 2G-I).
Socioeconomic predictors of survival in patients with ALL treated at the University of Chicago. Kaplan-Meier OS curves for adult patients with ALL, stratified based on race (A), race and age groups (B-C), BMI at diagnosis (D), BMI and age groups (E-F), median income (G), median income, and age groups (H-I).
Socioeconomic predictors of survival in patients with ALL treated at the University of Chicago. Kaplan-Meier OS curves for adult patients with ALL, stratified based on race (A), race and age groups (B-C), BMI at diagnosis (D), BMI and age groups (E-F), median income (G), median income, and age groups (H-I).
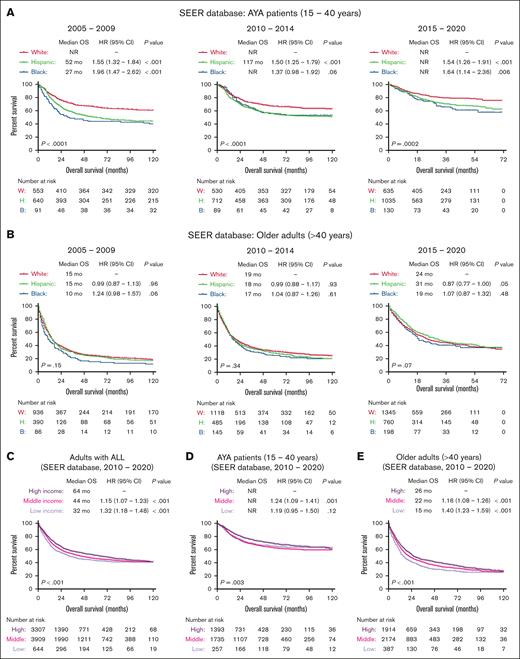
The University of Chicago is an ALL center of excellence with a dedicated AYA clinic offering critical resources to support patients throughout their long pediatric-inspired therapies. It also offers several clinical trials for AYA and older adults. Therefore, we further examined the impact of socioeconomic factors on ALL outcomes in the SEER population–based cohort of US patients. Between 2010 and 2020, OS outcomes of patients in the University of Chicago were better than the national average reported in the SEER database for older adults (supplemental Figure 2). Nationally, outcomes of ALL improved in the most recent 5-year period (2015-2020) for all age and race/ethnicity groups. Among AYA patients in SEER, Hispanic and NHB patients had significantly worse OS outcomes than NHW patients with ALL across all 3 time periods (2005-2009, 2010-2014, and 2015-2020; Figure 3A). However, among older adults, OS outcomes were worse, and race/ethnicity did not affect OS at all 3 time points (2005-2009, 2010-2014, and 2015-2020; Figure 3B). Patients who reported higher median household income had better OS than patients with lower income (Figure 3C), and this effect was more pronounced for older adults in SEER database than for the AYA group (Figure 3D-E).
Socioeconomic predictors of survival in patients with ALL registered in the SEER database. Kaplan-Meier OS curves for adult patients with ALL, stratified based on race and year of diagnosis in AYA patients (A), older adults (B), and further stratified based on median income (C) and age groups (D-E) for patients treated between 2010 and 2020.
Socioeconomic predictors of survival in patients with ALL registered in the SEER database. Kaplan-Meier OS curves for adult patients with ALL, stratified based on race and year of diagnosis in AYA patients (A), older adults (B), and further stratified based on median income (C) and age groups (D-E) for patients treated between 2010 and 2020.
Multivariable analysis
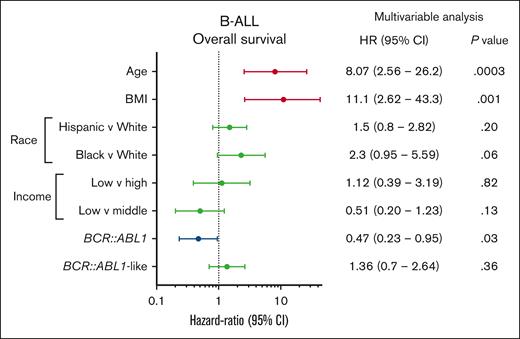
We performed a multivariable Cox proportional regression analysis to investigate the impact of socioeconomic and other prognostic variables on OS in the University of Chicago B-ALL cohort (Figure 4). Factors that were independently associated with adverse OS were age (HR, 6.93; 95% CI, 2.27-21.1; P = .0007) and BMI at diagnosis (HR, 10.3; 95% CI, 2.56-41.5; P = .001), whereas BCR::ABL1 positivity predicted favorable OS (HR, 0.41; 95% CI, 0.20-0.87).
Multivariable Cox proportional hazards analysis of OS in patients with B-ALL treated at the University of Chicago, investigating the impact of age, BMI, race, income, and genetic subtype.
Multivariable Cox proportional hazards analysis of OS in patients with B-ALL treated at the University of Chicago, investigating the impact of age, BMI, race, income, and genetic subtype.
Discussion
The results of our analyses suggest that certain elements of a patient’s socioeconomic status, including race/ethnicity and median household income, do not affect OS when patients have access to and are treated at a referral center with specialized ALL care, including clinical trials, novel agents, and a comprehensive clinical approach to outpatient care. Therefore, certain components of a patient’s socioeconomic makeup could potentially be modifiable risk factors that can be mitigated when they have access to ALL care centers offering multidisciplinary care. At a population level, SEER data contain the largest collection of demographic and cancer informatics in the United States, and the population covered by SEER is comparable with the general US population. Efforts to include historically excluded populations, such as Hispanic patients, have contributed to the generalizability of these data. The difference in OS based on race/ethnicity or ALL subtype (B vs T lineage) previously seen in population-based SEER data was not evident in the CALGB 10403 clinical trial.5 Hispanic patients had survival outcomes comparable with NHW patients when CALGB 10403 OS data were stratified based on race; however, NHB patients fared significantly worse. In contrast, in our own cohort at the University of Chicago, race/ethnicity was not a predictor of poor outcomes. This is likely because of the higher treatment adherence and higher frequency of BCR::ABL1 positivity among NHB patients. Annual household income was a predictor of survival in SEER data, yet it was not associated with worse outcomes in the University of Chicago cohort.
Compared with the population-based SEER data, the cohort at the University of Chicago differs, given our status as a referral center for the treatment of ALL. We had a lower percentage of Hispanic patients than the overall high percentage of Hispanic patients with ALL in the United States. Additionally, given the higher volume of referred patients, our population likely contains more patients at high risk in terms of disease status or treatment complexities. Overall, with improvements in outcomes for all racial/ethnic and socioeconomic groups, patients with ALL outcomes in the University of Chicago cohort were superior to what has been reported in SEER. This is likely due to access to experienced care teams and clinical trials offered for patients at high risk. The impact of access to clinical trials that use newer, more targeted agents (eg, tyrosine kinase inhibitors, bispecific T-cell engagers, and antibody-drug conjugates) for disease-specific subsets have become commonplace in frontline therapy over the last 5 to 7 years, with less intensive use of heavily myelosuppressive agents, likely contributed to improved outcomes in the University of Chicago cohort.
Racial differences in ALL genetics have previously been recognized, including high prevalence of CRLF2-rearrangements in Hispanic patients and T-cell ALL in African American patients.13 Our data validate these earlier observations. Notably, we observed a higher incidence of BCR::ABL1–positive B-ALL in African Americans, and availability of potent tyrosine kinase inhibitor therapies might have contributed to the improved outcomes of this group in our results.
Institutions with dedicated ALL care centers offer resources and supportive measures for patients and their families, including intensive psychosocial and outpatient clinical PharmD support that are critical for toxicity management, adherence, and treatment continuity. Located in a historically Black and low-income neighborhood, the University of Chicago plays a critical role in addressing socioeconomic disparities in ALL care for the South Side Chicago community. Specifically, the University of Chicago AYA center combines psychologists, physical therapists, social workers, and other critical ancillary support at each clinic visit, thus limiting the frequency of constant office visits and increasing the multidisciplinary support for patients and families.
Further studies should be directed toward investigation of the prognostic implications of obesity in patients with ALL. Other studies also pointed to the negative impact of obesity on survival and treatment toxicities in patients with ALL.14 Preclinical work suggests that obesity drives chemoresistance in patients with ALL via upregulation of galectin-9 in adipocytes, which may be leveraged as a therapeutic target.15 Overall, obesity was an independent predictor of adverse outcomes in our cohort, and efforts to improve this modifiable risk factor may positively affect survival outcomes of patients with ALL.
In conclusion, our findings suggest that certain baseline patient socioeconomic factors including race/ethnicity and household income may not affect OS outcomes when patients have access to dedicated ALL care at tertiary medical centers. With supportive care measures in place within a multidisciplinary care team, patients with ALL are better equipped to tackle the complexities of their long and tedious therapy regimens. Extrapolating these elements of the ALL care model to all ALL programs in both community and academic settings can positively affect the outcomes of patients while overcoming health care disparities that exist in the United States.
Acknowledgments
This study is supported by the Leukemia and Lymphoma Society Special Fellow Award, Prevent Cancer Foundation Fellowship, Cancer Research Foundation, and Elsa Pardee Foundation grants (C.S.).
Authorship
Contribution: H.J. and C.S. designed the study; A.A.P., A.D., P. Wang, P. Wanjari, J.S., G.V., J.X.C., S.G., A.L., C.F., M.N., H.L., M.D., M.T., O.O., R.L., and W.S. collected data; W.S. and C.S. provided leadership and managed the study team; H.J. and C.S. wrote the manuscript; and all authors read and approved the manuscript.
Conflict-of-interest disclosure: A.A.P. reports research funding (institutional) from Kronos Bio and Pfizer and honoraria from AbbVie. The remaining authors declare no competing financial interests.
Correspondence: Caner Saygin, Department of Medicine, Section of Hematology/Oncology, University of Chicago, Knapp Center for Biomedical Discovery, 900 E 57th St, Room 7150, Chicago, IL 60637; email: caner.saygin@bsd.uchicago.edu.
References
Author notes
Data are available on request from the corresponding author, Caner Saygin (caner.saygin@bsd.uchicago.edu).
The full-text version of this article contains a data supplement.

