Key Points
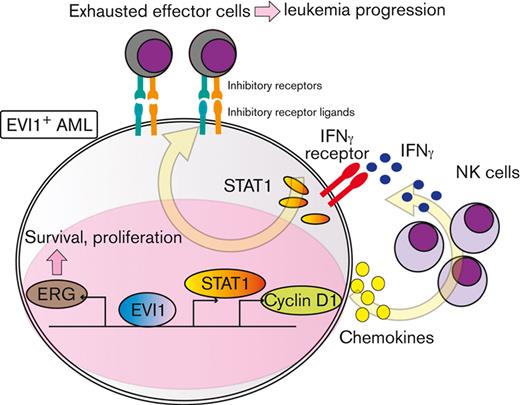
EVI1 exerts distinct roles in AML, including resistance, pathogenicity of aggressive diseases independent of stemness, and immune evasion.
ERG and cyclin D1 are leukemia-specific targets of EVI1, providing potential therapeutic vulnerability of EVI1-associated AML.
Abstract
Aberrant expression of ecotropic viral integration site-1 (EVI1+) is associated with very poor outcomes in acute myeloid leukemia (AML), mechanisms of which are only partially understood. Using the green fluorescent protein reporter system to monitor EVI1 promoter activity, we demonstrated that Evi1high KMT2A-MLLT1–transformed AML cells possess distinct features from Evi1low cells: the potential for aggressive disease independent of stem cell activity and resistance to cytotoxic chemotherapy, along with the consistent gene expression profiles. RNA sequencing and chromatin immunoprecipitation sequencing in EVI1-transformed AML cells and normal hematopoietic cells combined with functional screening by cell proliferation–related short hairpin RNAs revealed that the erythroblast transformation–specific transcription factor ERG (E26 transformation-specific [ETS]-related gene) and cyclin D1 were downstream targets and therapeutic vulnerabilities of EVI1+ AML. Silencing Erg in murine EVI1+ AML models severely impaired cell proliferation, chemoresistance, and leukemogenic capacity. Cyclin D1 is also requisite for efficient EVI1-AML development, associated with gene expression profiles related to chemokine production and interferon signature, and T- and natural killer–cell exhaustion phenotype, depending on the interferon gamma (IFN-γ)/STAT1 pathway but not on CDK4/CDK6. Inhibiting the IFN-γ/STAT1 pathway alleviated immune exhaustion and impaired EVI1-AML development. Overexpression of EVI1 and cyclin D1 was associated with IFN-γ signature and increased expression of chemokines, with increased exhaustion molecules in T cells also in human AML data sets. These data collectively suggest that ERG and cyclin D1 play pivotal roles in the biology of EVI1+ AML, where ERG contributes to aggressive disease nature and chemoresistance, and cyclin D1 leads to IFN-γ signature and exhausted T-cell phenotypes, which could potentially be targeted.
Introduction
Acute myeloid leukemia (AML) represents a heterogeneous group of neoplasms.1 Although molecular-targeted therapy has been realized for some disease types with targetable gene mutations,2-4 many refractory subtypes of AML still remain.
Ecotropic viral integration site-1 (EVI1) is encoded by the MDS1 and EVI1 complex locus (MECOM).5 In mice, aberrant expression of EVI1 causes myelodysplasia-like conditions or AML.6-8 Increased expression of EVI1, found in approximately 8% of de novo AML, has been related to very poor clinical outcomes.9,10 In EVI1high (EVI1+) AML, inv(3)(q21q26) or t(3;3)(q21;q26) are recurrently identified, both of which result in translocation of a distal enhancer of GATA2 gene to MECOM,11,12 leading to overexpression of EVI1 and decreased GATA2 expression.13,14 Other mechanisms of EVI1 overexpression in AML include atypical translocation of 3q26 and translocations affecting KMT2A on 11q23, whereas not all mechanisms have been clarified.15 Despite the need for specific targeting measures against EVI1+ AML, they have not yet been achieved, mainly owing to a lack of knowledge about its downstream targets,16,17 whereas some metabolic vulnerabilities have been reported.18,19
ERG (E26 transformation-specific [ETS]-related gene) is a member of the erythroblast transformation–specific (ETS) transcription factor family, implicated in the function of the hematopoietic stem cells (HSCs).20,21 ERG has also been reported as an oncogene in multiple malignancies.22-25 Despite numerous studies, the mechanisms by which ERG is upregulated in each subtype of AML, the molecular action by which ERG contributes to leukemogenesis, and the potential of ERG as a therapeutic target remains only partially understood.26-28
Cyclin D, a major oncogenic driver in many tumors, is an allosteric regulator of CDK4/CDK6 kinases, controlling cell cycle progression from G1 to S phase.29,30 Recent studies have demonstrated various oncogenic functions of cyclin D1 besides cell cycle regulation, including transcriptional regulation.31,32 Cyclin D1 and associated kinases have multifaceted functions, including antitumor immunity.33-36 Despite rapidly expanding knowledge of cyclin D1 in cancer biology, the role of cyclin D1 in AML remains poorly understood.37-40
Recently, immune escape of AML cells has been receiving increasing attention.41 Despite advances in anti-AML treatments, only a limited proportion can be cured without allogeneic HSC transplantation, underscoring the potential efficacy of immunotherapies. However, complex mechanisms of AML immune escape have hampered the development of immunotherapies. In addition to cell-intrinsic factors, the importance of altered immunologic milieu has been reported,42 as shown mainly in solid tumors.43,44 Interferon gamma (IFN-γ)-related gene expression profiles have recently been associated with resistance in AML,45 which is of great interest because much attention has lately been paid to the role of IFN-γ in promoting immune exhaustion through the expression of inhibitory molecules that limits antitumor immunity,46,47 although IFN-γ was initially thought to be an antitumor cytokine.48,49 However, the mechanisms by which the tumor microenvironment leads to the refractoriness of AML and the role of IFN-γ in shaping this microenvironment are still unclear.
In this study, we comprehensively investigated the potential downstream targets of EVI1 and examined the role of ERG and cyclin D1 in an EVI1+ AML model as possible candidate genes.
Methods
Mice
All experiments were approved by The University of Tokyo Ethics Committee for Animal Experiments and strictly adhered to the guidelines for animal experiments.
Retrovirus production, transduction, and cell selection
The production of retroviruses and transduction was performed as previously described with a slight modification.8
Flow cytometry
The list of antibodies used is provided in supplemental Table 1. Stained samples were sorted with FACS Aria II, Aria III, or analyzed with FACSCelesta (BD).
Chromatin immunoprecipitation sequencing (ChIP-seq) analysis
ChIP experiments were carried out as previously described.8 The list of primers used in quantitative polymerase chain reaction (qPCR) is provided in supplemental Table 2. Sequencing libraries were prepared using NEBNext Ultra II DNA library kit for Illumina (NEB) according to the instruction manual, and sequenced, single-end 65-bp reads, on the Illumina HiSeq2500 system. The data were analyzed as previously described.19
RNA sequencing (RNA-seq) analysis
RNA-seq for green fluorescent protein–high (GFPhigh) and –low (GFPlow) cells from KMT2A-MLLT1 AML mice were performed using freshly isolated 2 × 10⁵ leukemic granulocyte-monocyte progenitor (L-GMP) cells (n = 2 for GFPhigh and GFPlow, each). The top 5% and bottom 5% of cells were collected based on GFP intensity. To obtain each sample, 2 different AML mice were used.
RNA-seq for shErg and shCcnd1 was performed using 2 × 10⁶ puromycin-selected EVI1-AML cells (n = 2). RNA-seq for shCcnd1 was performed using freshly isolated 2 × 10⁶ EVI1-AML GFP+ c-kit+ bone marrow (BM) cells (n = 5-6). TPMCalculator was used to calculate the transcript per million value of a gene in each sample with the default parameters.50
Data analysis using publicly available genetic data
CIBERSORTx analysis
CIBERSORTx analysis was performed according to the authors’ instructions.55 Signature matrix files publicly provided by the authors were used.
Statistical analysis
Statistical significance of differences was assessed using a two-tailed unpaired Student t test. For the survival analysis, a log-rank test was used on the R software (version 4.0.5).
Results
Evi1high cells show distinct features in murine AML models
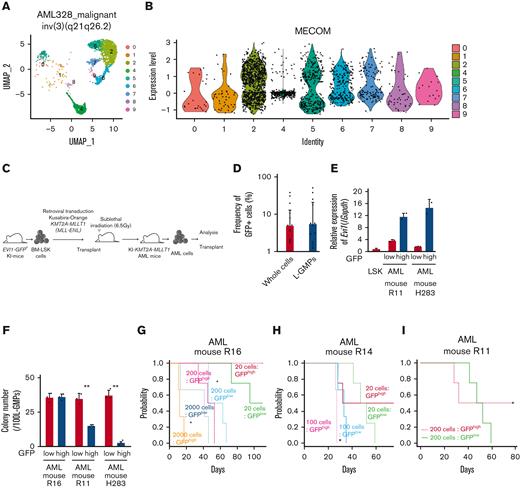
To investigate the expression pattern of EVI1 in AML, we used human AML single-cell RNA-seq data.56 In patients with EVI1+ AML with inv(3)(q21.3q26.2) and t(9;11)(p21;q23), EVI1 expression in AML cells was heterogeneous (Figure 1A-B and supplemental Figure 1A-B). We generated an AML mice model using lineage− Sca-1+ c-kit+ (LSK) cells from Evi1-GFP KI mice, in which the Evi1-IRES-GFP allele was inserted into the MECOM locus to allow monitoring of Evi1 expression by GFP intensity.57 Oncogenic fusion gene KMT2A-MLLT1, known to upregulate Evi1,58 was transduced into KI LSK cells with Kusabira-Orange (KuO) and transplanted into syngeneic mice (Figure 1C). Each AML mouse showed heterogeneous positivity of GFP, whereas GFPhigh cells were not enriched in L-GMPs with high leukemia stem cell activity (Figure 1D and supplemental Figure 1C). GFPhigh L-GMPs demonstrated higher expression of Evi1 than GFPlow L-GMPs with comparable KuO levels (Figure 1E and supplemental Figure 1D).
Evi1high cells show distinct features in murine AML models. (A) Uniform manifold approximation and projection (UMAP) plot of single-cell RNA-seq (scRNA-seq) data of AML cells from patient AML328 with inv(3)(q21.3q26.2), showing 9 clusters. (B) Violin plot of MECOM expression in the 9 clusters. (C) The scheme of the experimental model of EVI1-GFP KMT2A-MLLT1 AML mice. (D) Frequency of GFP+ cells in the whole live KuO+ AML cells and L-GMPs from the BM of EVI1-GFP KMT2A-MLLT1 AML mice. (E) qPCR showing the relative expression of Evi1 in GFPhigh and GFPlow AML cells compared with normal LSKs. (F) Colony-forming units of GFPhigh and GFPlow L-GMPs from 3 independent AML mice. (G-I) A Kaplan-Meier survival curve for secondary recipient mice that underwent transplantation with an indicated number of GFPhigh or GFPlow L-GMPs, after exposure to 6.5 Gy total body irradiation (TBI). Significance between the same number of cells was examined by a log-rank test. (J) Frequency of GFP+ cells in L-GMPs in secondary recipient mice intravenously treated with vehicle (phosphate-buffered saline ) or cytarabine (AraC; 100 mg/kg) for 5 days through days 15 and 19 after transplant. Mice were analyzed on day 19. (K) Top-ranked differentially expressed genes between GFPhigh and GFPlow L-GMPs. (L) Top-ranked pathways enriched in GFPhigh L-GMPs. (M-N) Gene set enrichment analysis (GSEA) showing that downregulated genes in leukemia stem cells (M) and multiple drug-resistant–related genes (N) are upregulated in GFPhigh L-GMPs. (O) Colony-forming units of 200 KMT2A-MLLT1 AML cells with or without exogenous EVI1 expression from 3 independent primary recipients (supplemental Figure 1K). Mean ± standard deviation (SD). ∗P < .05, ∗∗P < .01, ∗∗∗P < .001. FDR, false discovery rate (q value); NES, normalized enrichment score.
Evi1high cells show distinct features in murine AML models. (A) Uniform manifold approximation and projection (UMAP) plot of single-cell RNA-seq (scRNA-seq) data of AML cells from patient AML328 with inv(3)(q21.3q26.2), showing 9 clusters. (B) Violin plot of MECOM expression in the 9 clusters. (C) The scheme of the experimental model of EVI1-GFP KMT2A-MLLT1 AML mice. (D) Frequency of GFP+ cells in the whole live KuO+ AML cells and L-GMPs from the BM of EVI1-GFP KMT2A-MLLT1 AML mice. (E) qPCR showing the relative expression of Evi1 in GFPhigh and GFPlow AML cells compared with normal LSKs. (F) Colony-forming units of GFPhigh and GFPlow L-GMPs from 3 independent AML mice. (G-I) A Kaplan-Meier survival curve for secondary recipient mice that underwent transplantation with an indicated number of GFPhigh or GFPlow L-GMPs, after exposure to 6.5 Gy total body irradiation (TBI). Significance between the same number of cells was examined by a log-rank test. (J) Frequency of GFP+ cells in L-GMPs in secondary recipient mice intravenously treated with vehicle (phosphate-buffered saline ) or cytarabine (AraC; 100 mg/kg) for 5 days through days 15 and 19 after transplant. Mice were analyzed on day 19. (K) Top-ranked differentially expressed genes between GFPhigh and GFPlow L-GMPs. (L) Top-ranked pathways enriched in GFPhigh L-GMPs. (M-N) Gene set enrichment analysis (GSEA) showing that downregulated genes in leukemia stem cells (M) and multiple drug-resistant–related genes (N) are upregulated in GFPhigh L-GMPs. (O) Colony-forming units of 200 KMT2A-MLLT1 AML cells with or without exogenous EVI1 expression from 3 independent primary recipients (supplemental Figure 1K). Mean ± standard deviation (SD). ∗P < .05, ∗∗P < .01, ∗∗∗P < .001. FDR, false discovery rate (q value); NES, normalized enrichment score.
Because Evi1high cells were associated with high stem cell activity in normal hematopoiesis,57 we investigated the hierarchical structure of KMT2A-MLLT1 AML. Both GFPhigh and GFPlow cells can generate both GFPhigh and GFPlow L-GMPs in secondary recipients (supplemental Figure 1E). The colony-forming activity of GFPhigh L-GMPs differed between individual mice, whereas GFPlow L-GMPs showed consistently high activity (Figure 1F). Similarly, when GFPhigh and GFPlow L-GMPs were transplanted into recipient mice, the leukemogenic potential of GFPhigh L-GMPs was variable. When GFPhigh L-GMPs reconstituted AML, the recipient mice succumbed more rapidly than those engrafted with GFPlow L-GMPs (Figure 1G-H and supplemental Figure 1F). These results are independent of low stem cell activity, indicated by the low frequency of mice showing AML engraftment followed by the development of fatal AML after infusion of GFPhigh L-GMPs (Figure 1I and supplemental Figure 1G-H). When we administered cytarabine to mice with KMT2A-MLLT1 AML harboring the Evi1-KI allele, GFPhigh cells were enriched in the BM live cells of cytarabine-treated mice (Figure 1J).
When we performed RNA-seq of freshly isolated GFPhigh and GFPlow L-GMPs within the same KMT2A-MLLT1 primary AML mice to characterize GFPhigh cells, gene set enrichment analysis showed enrichment of several pathways (Figure 1K-L). Intriguingly, GFPhigh L-GMPs showed an opposite expression pattern to leukemic stem cells (Figure 1M and supplemental Figure 1I). Gene sets associated with resistance to chemotherapeutic drugs are upregulated in GFPhigh L-GMPs (Figure 1N and supplemental Figure 1J). Consistently, additive retroviral overexpression of EVI1 in established KMT2A-MLLT1 AML cells led to decreased colony-forming and leukemogenic capacity (Figure 1O and supplemental Figure 1K-L). These findings suggest that EVI1high L-GMPs are associated with aggressive disease features and chemoresistance rather than stem cell activity.
EVI1 binds to promoter regions of ERG and CCND1 in AML cells
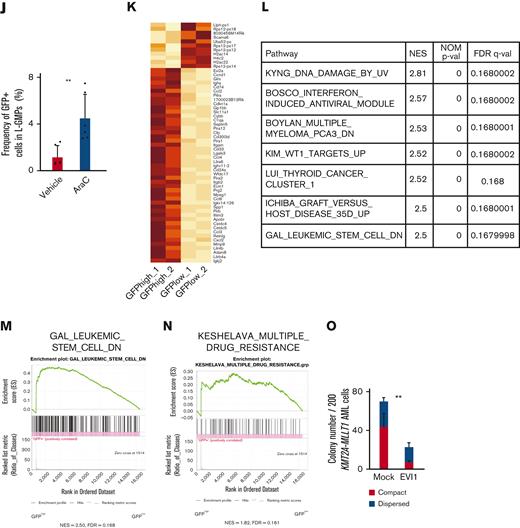
To identify the target genes of EVI1 in AML, we performed ChIP-seq analysis using EVI1-transformed AML (EVI1-AML) cells generated by transduction of 3× FLAG-tagged EVI1 into murine HSCs and progenitor cells followed by transplant.8 In this model, AML develops after a long period of myelodysplastic syndrome or myeloproliferative neoplasm-like disease. EVI1-AML cells demonstrated approximately 8 times Evi1 mRNA compared with normal LSKs (supplemental Figure 2A). After confirming the enrichment of previously reported EVI1-binding regions in the anti-FLAG ChIP samples (supplemental Figure 2B), these samples were applied to sequencing.19 EVI1-binding regions tended to cluster around gene promoters (supplemental Figure 2C). To identify AML-specific regions, the results were compared with a murine myeloid progenitor cell line 32D-cl3, where a 3× FLAG-tag was inserted at the 3′-end of the Evi1 locus (A.C., Y.M., H.M., M.B., K.S., and M.K., unpublished data, October 2022). They shared a relatively small number of binding regions (Figure 2A). Database for annotation, visualization and integrated discovery analysis revealed that AML-specific regions were enriched in genes involved in immune-related processes (Figure 2B).
A combination of multimodal screening showed potential targets of EVI1 in AML cells. (A) Venn diagram of ChIP-seq data using anti-FLAG antibody, showing FLAG-EVI1 binding regions. Two 3× FLAG-tagged EVI1-AML samples and a sample from 32D-cl3 murine hematopoietic progenitor cells where FLAG-tag was knocked in to the 3′-end of the Mecom locus. (B) Database for Annotation, Visualization and Integrated Discovery (DAVID) analysis showing AML-specific EVI1-binding regions. (C) A model of RNA-seq experiments. Genes upregulated at both early and late points after EVI1 introduction were chosen for further analysis. (D) Venn diagram of genes with EVI1-binding (ChIP-seq), upregulation after EVI1 transduction (RNA-seq), and positive correlation between EVI1 expression (microarray). (E) The list of genes in the common population of Figure 2D. (F) A scheme of the screening assay using DsRed. (G) Relative enrichment of DsRed+ cells expressing shRNA against each gene through days 3 and 10, adjusted by the shLuciferase control. Significance was examined in comparison with the shLuciferase control. (H) qPCR showing the relative expression of Evi1, Erg, and Ccnd1 in GFPhigh and GFPlow AML cells. Mean ± SD. ∗P < .05.
A combination of multimodal screening showed potential targets of EVI1 in AML cells. (A) Venn diagram of ChIP-seq data using anti-FLAG antibody, showing FLAG-EVI1 binding regions. Two 3× FLAG-tagged EVI1-AML samples and a sample from 32D-cl3 murine hematopoietic progenitor cells where FLAG-tag was knocked in to the 3′-end of the Mecom locus. (B) Database for Annotation, Visualization and Integrated Discovery (DAVID) analysis showing AML-specific EVI1-binding regions. (C) A model of RNA-seq experiments. Genes upregulated at both early and late points after EVI1 introduction were chosen for further analysis. (D) Venn diagram of genes with EVI1-binding (ChIP-seq), upregulation after EVI1 transduction (RNA-seq), and positive correlation between EVI1 expression (microarray). (E) The list of genes in the common population of Figure 2D. (F) A scheme of the screening assay using DsRed. (G) Relative enrichment of DsRed+ cells expressing shRNA against each gene through days 3 and 10, adjusted by the shLuciferase control. Significance was examined in comparison with the shLuciferase control. (H) qPCR showing the relative expression of Evi1, Erg, and Ccnd1 in GFPhigh and GFPlow AML cells. Mean ± SD. ∗P < .05.
To further narrow the list, we utilized RNA-seq data obtained from BM cells transduced with EVI119 (Figure 2C) and human transcriptome data.9 We chose the common genes as candidates: binding of EVI1, upregulation by EVI1 transduction, and positive correlation with EVI1 in human AML (Figure 2D-E). Short hairpin RNAs (shRNAs) against these candidate genes were transduced into EVI1-AML cells, along with fluorescent protein DsRed. Genes of which shRNA resulted in a continuous decrease in the frequency of DsRed+ cells, were considered positive (Figure 2F). Silencing of Erg and Ccnd1 decreased DsRed+ cell populations, leading us to focus on ERG and cyclin D1 (Figure 2G). Importantly, EVI1-GFPhigh L-GMPs in the KMT2A-MLLT1 AML mice showed high expression of Erg and Ccnd1, suggesting the possibility that these factors act as mediators of EVI1 (Figure 2H).
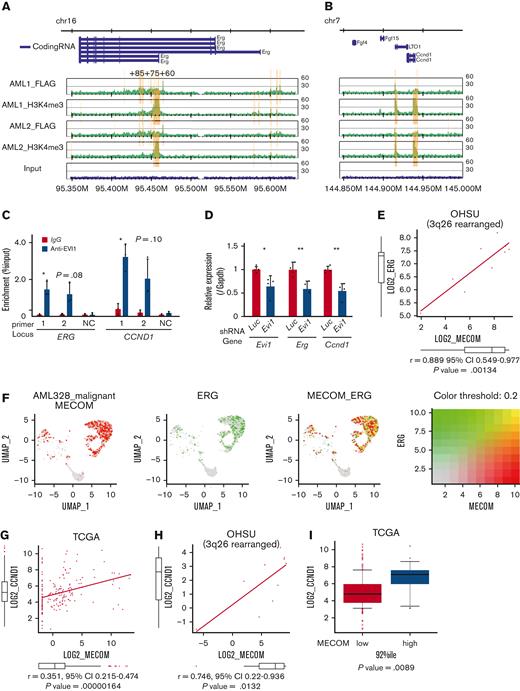
The ChIP-seq analysis showed that FLAG-EVI1 bound to the regulatory regions of Erg and Ccnd1, confirmed by ChIP-qPCR (Figure 3A-B and supplemental Figure 2D). Among them, a known cis-regulatory region of Erg, 85 kb downstream from the transcription start site (ERG+85) and a putative cis-regulatory region 4 kb downstream from the Ccnd1 transcription start site (both to which multiple major HSC-regulating transcription factors bind), were activated by EVI1 in a luciferase reporter assay, whereas the EVI1 binding motif was not required for the activation (supplemental Figure 3A-F).59-61 The corresponding regions in humans are DNase I sensitive in primary human AML cells with inv(3) and are bound by EVI1 in HNT-34, a human EVI1+ AML cell line (Figure 3C and supplemental Figure 3G-H). shRNAs against transduced EVI1 decreased the expression of Erg and Ccnd1, suggesting the role of EVI1 in activating these genes (Figure 3D). Although the correlation between MECOM and ERG was not significant in the public expression data of human AML as a whole, there was a strong correlation in patients with 3q26 abnormalities (Figure 3E). The single-cell RNA-seq data from a patient with inv(3)(q21.3q26.2) AML demonstrated concordant expression between MECOM and ERG also at the cell level56 (Figure 3F). GFPhigh L-GMPs showed upregulation of ERG-fusion–associated as well as EWS/ETS-fusion–associated genes (supplemental Figure 3I-J). As for CCND1, the correlation with MECOM was confirmed in the whole cohort and patients with 3q26 rearrangement (Figure 3G-H).51 Patients with EVI1+ AML expressed a higher level of CCND1 (Figure 3I). The decreased colony-forming activity of Evi1-silenced c-kit+ normal hematopoietic progenitors did not seem to be mediated by Erg or Ccnd1 (supplemental Figure 3K). These findings collectively indicate the promise of ERG and cyclin D1 as candidates for potential specific targets in EVI1-AML.
ERG and CCND1 are targets of EVI1 in Evi1high AML cells. (A-B) Illustration of anti-FLAG and anti-H3K4me3 ChIP-seq results for FLAG-tagged EVI1 in the murine Erg locus around the alternative transcription start site (A) and the murine Ccnd1 promoter region (B). Yellow bars represent significantly enriched regions. (C) ChIP-qPCR analysis using anti-EVI1 antibody and HNT-34 AML cells showing the binding of EVI1 to the corresponding human regions identified in the ChIP-seq of the murine EVI1-AML samples. Neighborhood sequences without enrichment in the ChIP-seq were used as a negative control. (D) qPCR showing the relative expression of Evi1, Erg, and Ccnd1 in EVI1-AML cells expressing shRNA against Evi1. (E) Gene expression correlation analysis between MECOM and ERG in Oregon Health Sciences University (OHSU) AML cohorts with 3q26 abnormalities. (F) A 2-color dot plot showing coexpression of MECOM and ERG in the scRNA-seq data from a patient with AML (AML328). (G) Gene expression correlation analysis between MECOM and CCND1 in The Cancer Genome Atlas (TCGA) AML cohorts. (H) Gene expression correlation analysis between MECOM and CCND1 in OHSU AML cohorts with 3q26 abnormalities. (I) A box plot showing CCND1 expression in TCGA EVI1+ and EVI1− AML cohorts. Mean ± SD. ∗P < .05, ∗∗P < .01.
ERG and CCND1 are targets of EVI1 in Evi1high AML cells. (A-B) Illustration of anti-FLAG and anti-H3K4me3 ChIP-seq results for FLAG-tagged EVI1 in the murine Erg locus around the alternative transcription start site (A) and the murine Ccnd1 promoter region (B). Yellow bars represent significantly enriched regions. (C) ChIP-qPCR analysis using anti-EVI1 antibody and HNT-34 AML cells showing the binding of EVI1 to the corresponding human regions identified in the ChIP-seq of the murine EVI1-AML samples. Neighborhood sequences without enrichment in the ChIP-seq were used as a negative control. (D) qPCR showing the relative expression of Evi1, Erg, and Ccnd1 in EVI1-AML cells expressing shRNA against Evi1. (E) Gene expression correlation analysis between MECOM and ERG in Oregon Health Sciences University (OHSU) AML cohorts with 3q26 abnormalities. (F) A 2-color dot plot showing coexpression of MECOM and ERG in the scRNA-seq data from a patient with AML (AML328). (G) Gene expression correlation analysis between MECOM and CCND1 in The Cancer Genome Atlas (TCGA) AML cohorts. (H) Gene expression correlation analysis between MECOM and CCND1 in OHSU AML cohorts with 3q26 abnormalities. (I) A box plot showing CCND1 expression in TCGA EVI1+ and EVI1− AML cohorts. Mean ± SD. ∗P < .05, ∗∗P < .01.
Evi1high AML cells are dependent on ERG
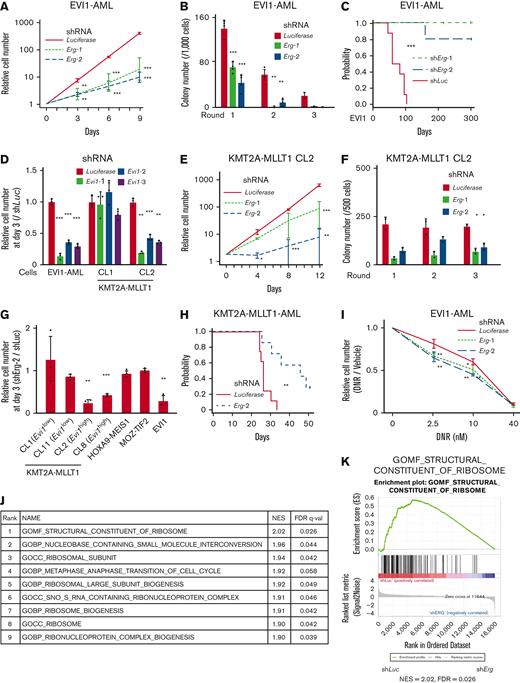
The proliferation of EVI1-AML cells was susceptible to Erg silencing (Figure 4A and supplemental Figure 4A-B). EVI1-AML cells expressing shErg demonstrated diminished clonogenic activity (Figure 4B). Knockdown of Erg led to cell cycle arrest and apoptosis (supplemental Figure 4C-D). Silencing of Erg dramatically abrogated the leukemogenic potential of EVI1-AML cells in vivo (Figure 4C and supplemental Figure 4E).
Evi1high AML cells are dependent on ERG. (A) Relative cell proliferation of EVI1-AML cells expressing shRNAs against Luciferase and Erg in vitro. (B) Colony-forming units of EVI1-AML cells expressing shRNAs against Luciferase and Erg. (C) A Kaplan-Meier survival curve for recipient mice that underwent transplantation with 1 × 10⁶ EVI1-AML cells expressing shRNAs against Luciferase and Erg after being exposed to 6.5 Gy TBI. P value was examined by a log-rank test. (D) Relative cell proliferation of EVI1-AML and KMT2A-MLLT1 clone 1 (CL1) and CL2 cells expressing shRNAs against Luciferase and Evi1 in vitro, showing EVI1-dependency of these cells. (E) Relative cell proliferation of KMT2A-MLLT1 CL2 cells expressing shRNAs against Luciferase and Erg in vitro. (F) Colony-forming units of KMT2A-MLLT1 CL2 cells expressing shRNAs against Luciferase and Erg. (G) Relative cell proliferation of several AML cells and KMT2A-MLLT1-transformed cell lines with shErg compared with those with shLuciferase, through days 0 to 3. A comparison was made within the same original cell between shLuciferase and shErg. (H) A Kaplan-Meier survival curve for recipient mice that underwent transplantation with 1 × 10⁴ KMT2A-MLLT1 AML cells expressing shRNAs against Luciferase and Erg after being exposed to 6.5 Gy TBI. (I) Relative live cell numbers of EVI1-AML cells with shRNAs against Luciferase or Erg treated with daunomycin, compared with those cultured in media without daunomycin. (J) A list of top-ranked gene sets with decreased expression in shErg-transduced EVI1-AML cells. (K) GSEA showing structural constituent of the ribosome is downregulated in shErg. Mean ± SD; ∗P < .05, ∗∗P < .01, ∗∗∗P < .001.
Evi1high AML cells are dependent on ERG. (A) Relative cell proliferation of EVI1-AML cells expressing shRNAs against Luciferase and Erg in vitro. (B) Colony-forming units of EVI1-AML cells expressing shRNAs against Luciferase and Erg. (C) A Kaplan-Meier survival curve for recipient mice that underwent transplantation with 1 × 10⁶ EVI1-AML cells expressing shRNAs against Luciferase and Erg after being exposed to 6.5 Gy TBI. P value was examined by a log-rank test. (D) Relative cell proliferation of EVI1-AML and KMT2A-MLLT1 clone 1 (CL1) and CL2 cells expressing shRNAs against Luciferase and Evi1 in vitro, showing EVI1-dependency of these cells. (E) Relative cell proliferation of KMT2A-MLLT1 CL2 cells expressing shRNAs against Luciferase and Erg in vitro. (F) Colony-forming units of KMT2A-MLLT1 CL2 cells expressing shRNAs against Luciferase and Erg. (G) Relative cell proliferation of several AML cells and KMT2A-MLLT1-transformed cell lines with shErg compared with those with shLuciferase, through days 0 to 3. A comparison was made within the same original cell between shLuciferase and shErg. (H) A Kaplan-Meier survival curve for recipient mice that underwent transplantation with 1 × 10⁴ KMT2A-MLLT1 AML cells expressing shRNAs against Luciferase and Erg after being exposed to 6.5 Gy TBI. (I) Relative live cell numbers of EVI1-AML cells with shRNAs against Luciferase or Erg treated with daunomycin, compared with those cultured in media without daunomycin. (J) A list of top-ranked gene sets with decreased expression in shErg-transduced EVI1-AML cells. (K) GSEA showing structural constituent of the ribosome is downregulated in shErg. Mean ± SD; ∗P < .05, ∗∗P < .01, ∗∗∗P < .001.
To elucidate the functional relationship between EVI1 expression and dependency on ERG, we established immortalized cell lines by introducing KMT2A-MLLT1 into Evi1-GFP KI c-kit+ cells, followed by single-cell isolation (supplemental Figure 4F-G); an Evi1high clone (CL2) with high GFP expression and dependency on EVI1, and an Evi1low clone (CL1) without EVI1-dependency (Figure 4D and supplemental Figure 4H) was produced. The differential effect of Erg silencing was analyzed by using these lines. Knockdown of Erg in CL1 led to a marginal decrease in proliferation and no change in clonogenic ability (supplemental Figure 4I-J). In contrast, when Erg was silenced in CL2, substantial inhibition in cell growth and colony-forming activity was observed (Figure 4E-F). To assess the role of ERG in various AML models, we established MOZ-TIF2 and HOXA9-MEIS1 AML mice by retroviral transduction, both of which did not express Evi1.62,63 Silencing of Erg did not affect the proliferation of MOZ-TIF2 and HOXA9-MEIS1 AML cells, like Evi1low KMT2A-MLLT1-transformed cells (Figure 4G).
Knockdown of Erg significantly retarded Evi1-expressing KMT2A-MLLT1 AML development (Figure 4H). Corresponding to the persistence of Evi1high cells after cytotoxic chemotherapy, we analyzed the effect of ERG on cell growth of EVI1-AML cells under daunomycin treatment in vitro. Although Erg knockdown significantly inhibited basal cell proliferation, it further enhanced sensitivity to daunomycin (Figure 4I). In contrast, the development of HOXA9-MEIS1 AML was not affected by Erg silencing (supplemental Figure 4K). These findings suggest that ERG is necessary to maintain a transformed phenotype of EVI1+ AML.
Genes involved in the ribosomal process are enriched in genes associated with ERG
We performed RNA-seq using EVI1-AML cells after the transduction of shErg. When we compared the differentially regulated genes in our AML models with those in normal HSCs after deletion of Erg,21 there was no apparent correlation (supplemental Figure 4L). In addition, the fact that a relatively small number of genes were differentially expressed in our AML model and that MYC target genes were downregulated after Erg knockdown, in contrast to the upregulation after Erg deletion in normal HSCs,21 led us to search for genes regulated by ERG in an AML-specific manner (supplemental Figure 4M-N). The RNA-seq revealed that ribosome-related processes are enriched in downregulated genes upon Erg knockdown (Figure 4J-K). Using publicly available anti-ERG ChIP-seq data of human hematopoietic cells,27,64-66 we identified genes involved in translation and ribosomal formation as possible differentially binding regions of ERG between normal cells and AML cell lines (supplemental Figure 4O). Along with these findings, gene expression correlation analysis using the human AML data set revealed that gene sets associated with ribosomes and translation were also identified as genes whose expression levels correlate with ERG (supplemental Figure 4P).
Cyclin D1 plays a key role in murine EVI1+ AML models
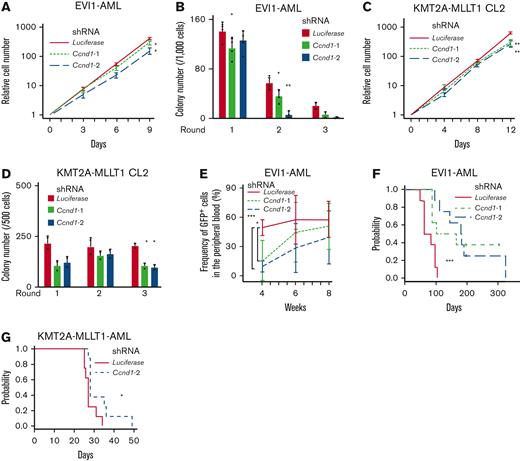
Despite the established multihued functions of cyclin D1 in several malignancies,67 its role in AML is poorly understood. Silencing of Ccnd1 in EVI1-AML cells decreased in vitro proliferation with marginal cell cycle delay (Figure 5A and supplemental Figure 5A-C). Knockdown of Ccnd1 also inhibited the colony-forming activity, indicating the functional needs in EVI1-AML (Figure 5B). KMT2A-MLLT1 CL2 cells were mildly dependent on cyclin D1, whereas CL1 was not (Figure 5C-D and supplemental Figure 5D-E). Ccnd1 silencing did not affect MOZ-TIF2 and HOXA9-MEIS1 AML cells (supplemental Figure 5F). These cells also showed different sensitivity to pharmacological inhibition of CDK4/CDK6 with palbociclib and fascaplysin (supplemental Figure 5G-I).
Cyclin D1 is necessary for the efficient development of EVI1-AML in vivo. (A) Relative cell proliferation of EVI1-AML cells expressing shRNAs against Luciferase and Ccnd1 in vitro. The data for shLuciferase are common to those in Figure 4A. (B) Colony-forming units of EVI1-AML cells expressing shRNAs against Luciferase and Ccnd1. The data for shLuciferase are common to those in Figure 4B. (C) Relative cell proliferation of KMT2A-MLLT1 CL2 cells expressing shRNAs against Luciferase and Ccnd1 in vitro. The data for shLuciferase are common to Figure 4E. (D) Colony-forming units of KMT2A-MLLT1 CL2 cells expressing shRNAs against Luciferase and Ccnd1. The data for shLuciferase are common to Figure 4F. (E) Frequency of GFP+ AML cells in the peripheral blood in recipient mice that underwent transplantation with EVI1-AML cells expressing indicated shRNAs. (F) A Kaplan-Meier survival curve for recipient mice that underwent transplantation with 1 × 10⁶ EVI1-AML cells expressing shRNAs against Luciferase and Ccnd1, after being exposed to 6.5 Gy TBI. P value was examined by a log-rank test. The data for shLuciferase are common to Figure 4C. (G) A Kaplan-Meier survival curve for recipient mice that underwent transplantation with 1 × 10⁴ KMT2A-MLLT1-AML cells expressing shRNAs against Luciferase and Ccnd1, after being exposed to 6.5 Gy TBI. P value was examined by a log-rank test. The data for shLuciferase are common to Figure 4H. Mean ± SD. ∗P < .05, ∗∗P < .01, ∗∗∗P < .001.
Cyclin D1 is necessary for the efficient development of EVI1-AML in vivo. (A) Relative cell proliferation of EVI1-AML cells expressing shRNAs against Luciferase and Ccnd1 in vitro. The data for shLuciferase are common to those in Figure 4A. (B) Colony-forming units of EVI1-AML cells expressing shRNAs against Luciferase and Ccnd1. The data for shLuciferase are common to those in Figure 4B. (C) Relative cell proliferation of KMT2A-MLLT1 CL2 cells expressing shRNAs against Luciferase and Ccnd1 in vitro. The data for shLuciferase are common to Figure 4E. (D) Colony-forming units of KMT2A-MLLT1 CL2 cells expressing shRNAs against Luciferase and Ccnd1. The data for shLuciferase are common to Figure 4F. (E) Frequency of GFP+ AML cells in the peripheral blood in recipient mice that underwent transplantation with EVI1-AML cells expressing indicated shRNAs. (F) A Kaplan-Meier survival curve for recipient mice that underwent transplantation with 1 × 10⁶ EVI1-AML cells expressing shRNAs against Luciferase and Ccnd1, after being exposed to 6.5 Gy TBI. P value was examined by a log-rank test. The data for shLuciferase are common to Figure 4C. (G) A Kaplan-Meier survival curve for recipient mice that underwent transplantation with 1 × 10⁴ KMT2A-MLLT1-AML cells expressing shRNAs against Luciferase and Ccnd1, after being exposed to 6.5 Gy TBI. P value was examined by a log-rank test. The data for shLuciferase are common to Figure 4H. Mean ± SD. ∗P < .05, ∗∗P < .01, ∗∗∗P < .001.
We assessed the effect of Ccnd1 silencing on the leukemogenic potential of EVI1-AML cells in vivo. Although homing to the BM was not affected by Ccnd1 silencing, the frequency of GFP+ EVI1-AML cells in the peripheral blood expressing shRNAs against Ccnd1 was lower 4 weeks after transplantation (Figure 5E and supplemental Figure 5J). Development of EVI1 and KMT2A-MLLT1 AML was hampered by Ccnd1 knockdown (Figure 5F-G). These data suggest that cyclin D1 plays a vital role in AML development in murine EVI1+ AML models.
Cyclin D1 is associated with IFN signatures and immune exhaustion in EVI1-AML
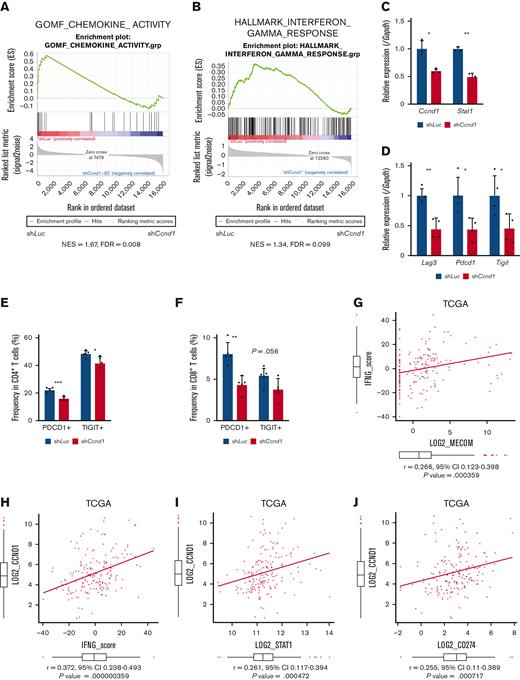
To explore downstream processes of cyclin D1, RNA-seq analysis using EVI1-AML cells was performed after transduction of shCcnd1. Surprisingly, silencing of Ccnd1 led to downregulation of genes associated with chemokine production and response to IFN instead of cell cycle–related genes (Figure 6A and supplemental Figure 6A-C). In RNA-seq of the c-kit+ fraction of AML cells freshly isolated from EVI1-AML mice expressing shRNAs, gene set enrichment analysis also demonstrated that gene sets associated with chemokine and IFN were downregulated in shCcnd1 cells (Figure 6B and supplemental Figure 6D). The expression of Stat1, the primary signaling mediator for type I and II IFN, was decreased in cells with shCcnd1 (Figure 6C). Intriguingly, it has been suggested that EVI1 may directly upregulate STAT1.68 In addition to the decrease in Stat1 mRNA after Evi1 knockdown, the reporter assay suggested that EVI1 upregulates STAT1 through direct mechanisms as well (supplemental Figure 6E-G). As IFN-γ has been implicated in promoting the immunosuppressive tumor microenvironment, T cells from shCcnd1 EVI1-AML mice were analyzed for expression of exhaustion markers. Spleen T cells from the secondary EVI1-AML recipients on day 19, engrafted with freshly isolated shCcnd1 EVI1-AML cells, showed decreased expression of molecules associated with exhaustion, including Lag3, Pdcd1, and Tigit (Figure 6D and supplemental Figure 6H). CD4 and CD8 T cells infiltrating the liver from shCcnd1 EVI1-AML mice also demonstrated lower positivity of PDCD1 and TIGIT, suggesting a role of cyclin D1 expressed by AML cells in T-cell exhaustion (Figure 6E-F and supplemental Figure 6I). To confirm the validity of our findings, we assessed whether the relationship found in our murine AML models was also observed in human AML by utilizing public gene expression data.51,52 IFN-γ score, as a substitute indicator for IFN-γ level,44 was positively correlated with MECOM and CCND1, whereas CCND1 was more strongly correlated (Figure 6G-H and supplemental Figure 6J-K). The expressions of STAT1 and CD274, an immune checkpoint molecule regulated by the IFN pathway and also known as PD-L1, were also positively correlated to those of MECOM and CCND1 (Figure 6I-J and supplemental Figure 6L-N).
Cyclin D1 is associated with IFN signatures and immune exhaustion in EVI1-AML. (A) GSEA showing that gene sets associated with chemokine activity are downregulated after silencing Ccnd1 in vitro. (B) GSEA showing that gene sets associated with IFN-γ signaling are upregulated by silencing Ccnd1 in vivo. (C) qPCR showing the relative expression of Stat1 in EVI1-AML cells with Ccnd1 silencing. (D) qPCR showing the relative expression of exhaustion-related genes in the spleen T cells from shLuc- or shCcnd1-EVI1-AML mice before the development of full-blown AML. Freshly isolated AML cells (1 × 10⁶) from shLuc- or shCcnd1-EVI1-AML mice were injected into the secondary recipient mice without TBI, followed by T-cell isolation from the spleen 19 days after transplant. Please see supplemental Figure 6H. (E) Frequency of cellular subsets of CD4 T cells infiltrating the liver of EVI1-AML mice with frank leukemia. Please see supplemental Figure 6I. (F) Frequency of cellular subsets of CD8 T cells infiltrating the liver of EVI1-AML mice with indicated shRNA after exposure to 4.5 Gy TBI. Please see supplemental Figure 6I. (G-H) Pearson correlation analysis between IFN-γ score and MECOM/CCND1 expression in TCGA samples. (I) Pearson correlation analysis between STAT1 and CCND1 expression in TCGA samples. (J) Pearson correlation analysis between CD274 and CCND1 expression in TCGA samples. Mean ± SD. ∗P < .05, ∗∗P < .01, ∗∗∗P < .001.
Cyclin D1 is associated with IFN signatures and immune exhaustion in EVI1-AML. (A) GSEA showing that gene sets associated with chemokine activity are downregulated after silencing Ccnd1 in vitro. (B) GSEA showing that gene sets associated with IFN-γ signaling are upregulated by silencing Ccnd1 in vivo. (C) qPCR showing the relative expression of Stat1 in EVI1-AML cells with Ccnd1 silencing. (D) qPCR showing the relative expression of exhaustion-related genes in the spleen T cells from shLuc- or shCcnd1-EVI1-AML mice before the development of full-blown AML. Freshly isolated AML cells (1 × 10⁶) from shLuc- or shCcnd1-EVI1-AML mice were injected into the secondary recipient mice without TBI, followed by T-cell isolation from the spleen 19 days after transplant. Please see supplemental Figure 6H. (E) Frequency of cellular subsets of CD4 T cells infiltrating the liver of EVI1-AML mice with frank leukemia. Please see supplemental Figure 6I. (F) Frequency of cellular subsets of CD8 T cells infiltrating the liver of EVI1-AML mice with indicated shRNA after exposure to 4.5 Gy TBI. Please see supplemental Figure 6I. (G-H) Pearson correlation analysis between IFN-γ score and MECOM/CCND1 expression in TCGA samples. (I) Pearson correlation analysis between STAT1 and CCND1 expression in TCGA samples. (J) Pearson correlation analysis between CD274 and CCND1 expression in TCGA samples. Mean ± SD. ∗P < .05, ∗∗P < .01, ∗∗∗P < .001.
IFN-γ and STAT1 axis plays a crucial role in the development of EVI1-AML
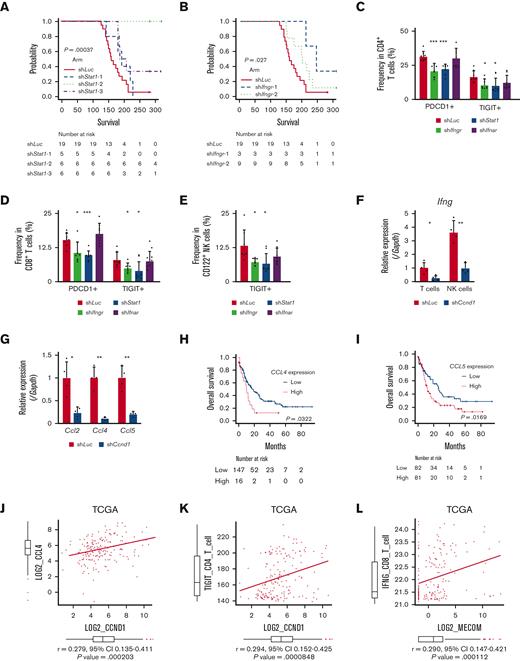
In agreement with the reported antitumor activity of STAT1 as a general rule,69 silencing of Stat1 in EVI1-AML cells did not affect in vitro proliferation (supplemental Figure 7A-B). However, knockdown of Stat1 or Ifngr, the receptor of IFN-γ, substantially impaired the leukemogenic capacity of EVI1-AML in vivo (Figure 7A-B), whereas silencing of Ifnar, the receptor of IFN-α/β, had no effect (supplemental Figure 7C-E). Knockdown of Ifngr and Stat1, but not Ifnar, also decreased the expression of exhaustion-related molecules such as PDCD1 and TIGIT on T and natural killer (NK) cells (Figure 7C-E). In other AML models, including HOXA9-MEIS1 and KMT2A-MLLT1 without EVI1 expression, silencing of Ifngr and Stat1 did not affect exhaustion phenotype or survival (data not shown), suggesting the specificity of EVI1-AML. These results collectively suggest the vital role of the IFN-γ/STAT1 pathway in the immunosuppressive tumor microenvironment and the development of EVI1-AML.
Overexpression of CCND1 is associated with type II IFN signature in human AML. (A-B) A Kaplan-Meier survival curve for recipient mice that underwent transplantation with 1 × 10⁶ EVI1-AML cells expressing shRNAs against indicated genes, after exposure to 4.5 Gy TBI. The data for shLuciferase are common in Figure 7A-B and supplemental Figure 7E. (C-E) Frequency of cellular subsets of CD4 T (C), CD8 T (D), and CD122+ NK (E) cells infiltrating the spleen of EVI1-AML mice with indicated shRNA after exposure to 6.5 Gy TBI. Please see supplemental Figure 6H. (F) qPCR showing the relative expression of Ifng in the spleen T and NK cells from shLuc- or shCcnd1-EVI1-AML mice, used in Figure 6D. (G) qPCR showing the relative expression of chemokines in the EVI1-AML cells 72 hours after transduction of shLuc or shCcnd1. (H) An overall survival of TCGA cohorts according to CCL4 expression divided at 90th percentile. (I) Overall survival of TCGA cohorts according to CCL5 expression divided at 50th percentile. (J) Pearson correlation analysis between CCL4 and CCND1 expression in TCGA samples. (K) Pearson correlation analysis between estimated expression of TIGIT in CD4 T cells calculated using CIBERSORTx and CCND1 expression in TCGA samples. (L-M) Pearson correlation analysis between estimated expression of IFNG in CD8 T cells calculated using CIBERSORTx and MECOM/CCND1 expressions in TCGA samples. (N) Pearson correlation analysis between estimated expression of ICOS in CD8 T cells calculated using CIBERSORTx and CCND1 expression in TCGA samples. (O) Pearson correlation analysis between estimated expression of LAG3 in NK cells calculated using CIBERSORTx and CCND1 expression in TCGA samples. Mean ± SD. ∗P < .05, ∗∗P < .01, ∗∗∗P < .001.
Overexpression of CCND1 is associated with type II IFN signature in human AML. (A-B) A Kaplan-Meier survival curve for recipient mice that underwent transplantation with 1 × 10⁶ EVI1-AML cells expressing shRNAs against indicated genes, after exposure to 4.5 Gy TBI. The data for shLuciferase are common in Figure 7A-B and supplemental Figure 7E. (C-E) Frequency of cellular subsets of CD4 T (C), CD8 T (D), and CD122+ NK (E) cells infiltrating the spleen of EVI1-AML mice with indicated shRNA after exposure to 6.5 Gy TBI. Please see supplemental Figure 6H. (F) qPCR showing the relative expression of Ifng in the spleen T and NK cells from shLuc- or shCcnd1-EVI1-AML mice, used in Figure 6D. (G) qPCR showing the relative expression of chemokines in the EVI1-AML cells 72 hours after transduction of shLuc or shCcnd1. (H) An overall survival of TCGA cohorts according to CCL4 expression divided at 90th percentile. (I) Overall survival of TCGA cohorts according to CCL5 expression divided at 50th percentile. (J) Pearson correlation analysis between CCL4 and CCND1 expression in TCGA samples. (K) Pearson correlation analysis between estimated expression of TIGIT in CD4 T cells calculated using CIBERSORTx and CCND1 expression in TCGA samples. (L-M) Pearson correlation analysis between estimated expression of IFNG in CD8 T cells calculated using CIBERSORTx and MECOM/CCND1 expressions in TCGA samples. (N) Pearson correlation analysis between estimated expression of ICOS in CD8 T cells calculated using CIBERSORTx and CCND1 expression in TCGA samples. (O) Pearson correlation analysis between estimated expression of LAG3 in NK cells calculated using CIBERSORTx and CCND1 expression in TCGA samples. Mean ± SD. ∗P < .05, ∗∗P < .01, ∗∗∗P < .001.
Because AML cells do not express Ifng, we collected CD3+ T and CD49b+ NK cells from the spleen and found that the expression of Ifng in T cells and NK cells was reduced in mice engrafted with shCcnd1-EVI1-AML cells (Figure 7F). As Ccnd1 silencing was associated with decreased cytokine production in EVI1-AML cells (Figure 6A) and various chemokines have been implicated in the recruitment of IFN-γ–producing effector cells to the tumor microenvironment,70,71 we determined the expression of specific chemokines reported to be involved in the process. qPCR, after silencing Ccnd1 in EVI1-AML cells, also demonstrated markedly reduced expression of chemokines, including Ccl2, Ccl4, and Ccl5 (Figure 7G). Intriguingly, in vitro treatment of EVI1-AML cells by palbociclib, where the proliferation was inhibited as much as genetic silencing of Ccnd1, the expression of chemokines and Stat1 was not affected (supplemental Figure 7F). Together with the modest difference in the sensitivity to CDK4/6 inhibitors between cells with different EVI1 expression in vitro (supplemental Figure 5G-I), the only partial recapitulation of the effect of silencing Ccnd1 by pharmacological inhibition of CDK4/6 might suggest the multifaceted roles of cyclin D1, including both CDK4/CDK6-dependent and independent ones.
We validated our findings using human AML data sets to find that high expressions of CCL4 and CCL5 were associated with inferior survival, indicating the functional importance of these chemokines (Figure 7H-I). The expression of CCL2 and CCL4 was also positively correlated to those of MECOM and CCND1 (Figure 7J and supplemental Figure 7G-I). Using CIBERSORTx on these data, a computational framework to infer cell-type–specific gene expression,55 we estimated the association between specific gene expressions in immune cells and bulk expressions of MECOM and CCND1. Positive correlations were seen with TIGIT in CD4 and CD8 T cells, a checkpoint receptor involved in T-cell exhaustion, and IFNG in CD8 T cells as expected (Figure 7K-M and supplemental Figure 7J-L). The expression of costimulatory receptor ICOS in CD8 T cells was negatively related to those of MECOM and CCND1 (Figure 7N and supplemental Figure 7M). LAG3 in NK cells was also positively correlated with MECOM and CCND1 (Figure 7O and supplemental Figure 7N). These data were consistent with the immunoinhibitory functions of MECOM and cyclin D1 in human AML.
Discussion
This study identified ERG and cyclin D1 as potential targets of EVI1 by using murine EVI1+ AML models. EVI1+ AML is known to be highly resistant to cytotoxic chemotherapy and associated with a very poor prognosis. The results of this study may provide potential therapeutic targets for this type of disease.
Given the intercellular heterogeneity of EVI1 expression, we compared the properties of EVI1-GFP-high and -low cells. The aggressive behavior of Evi1high cells is consistent with the results of previous studies.72,73 Although the diversity of GFPhigh cells in their clonogenic ability may reflect the heterogeneity of the LSK fraction used to generate the model, it is of particular interest that EVI1-GFPhigh cells were not associated with stemness. Furthermore, our analysis showed that the Evi1 expression was associated with differences in the properties of AML cells on a cell basis, including leukemogenic potential and persistence after chemotherapy. Evi1high cells expressed a higher level of Erg and associated gene expression profiles, and EVI1-AML cells became more sensitive to chemotherapy upon Erg knockdown, suggesting the functional involvement of EVI1 and ERG in EVI1+ AML.
This study showed that ERG was requisite in murine EVI1+ AML, like HSCs.21 There was, however, little overlap in genes regulated by ERG between normal HSCs and EVI1-AML cells, collectively suggesting that ERG plays a distinct role in AML. Supporting our findings, a complementary article by Schmöllerl et al has identified ERG as an important transcriptional target of EVI1 through characterizing chromatin binding of Evi1 and transcriptional profiling in a human AML model.74 The role of ERG in regulating the ribosomal process and its implication in EVI1-AML should be investigated in future studies.
In this study, we present a novel mechanism of immune exhaustion mediated by cyclin D1. Although analysis of the direct transcriptional regulation by cyclin D1 has only just begun,31,32 the binding of cyclin D1 to multiple chemokine loci including CCL4 and upregulation of CCL2 has been demonstrated,75 in agreement with our data. Because the expression of multiple chemokines seems to be controlled in parallel by cyclin D1, and it has been known to be activated by IFN-signaling itself, further studies are needed to determine what role chemokines play in the formation of IFN signature. Silencing Ccnd1 in EVI1-AML cells in vitro also attenuated IFN-signature, suggesting additional mechanisms might be working to regulate IFN signaling, such as a direct, cell-intrinsic effect. In addition, pharmacological inhibition of CDK4/6 only partially recapitulated the effect of silencing Ccnd1, suggesting a CDK4/6-independent role for cyclin D1. Considering that CDK4/6 inhibition enhances antitumor immunity in solid cancers via multiple mechanisms,34-36,52 the function of cyclin D1 seems diverse. In addition, given that EVI1 has different effects on the IFN pathway and that it has been suggested that EVI1 may be a direct target of STAT1 in a previous report and our ChIP-seq, further studies are needed to elucidate the full picture of the relationship between EVI1, CCND1, and the IFN-γ pathway.68,76
The impact of immune biology on the pathogenesis of AML has received increasing attention. In AML with immune cell infiltration, IFN-γ–related transcriptional profiles are associated with immune exhaustion and chemoresistance, of which the molecular bases are unclear.45 TP53 mutations are associated with immune cell infiltration,77 and ASXL1 mutations induce T-cell exhaustion.78 Although there might be a role of immune evasion as the basis for refractoriness, the mechanisms might be different between subtypes. Our study provides a possible mechanism of immune evasion in EVI1+ AML through cyclin D1.
Although model-dependent differences in EVI1 expression levels might affect the results, this work demonstrated that EVI1 confers AML cells with dependency on ETS transcription factor ERG and immunoregulatory capacity in the tumor microenvironment through cyclin D1, both of which can be therapeutic vulnerabilities of EVI1+ AML cells.
Acknowledgments
The authors thank T. Kitamura for PLAT-E packaging cells and K. Ono, K. Higa, and M. Ebisawa for expert technical assistance. The authors thank Johannes Zuber and Johannes Schmolellerl for their scientific discussions and for sharing unpublished data and manuscripts.
This work was partly supported by the Japan Society for the Promotion of Science KAKENHI (JP20H03708 and JP21H04805) and a scholarship from Kyowa Kirin.
Authorship
Contribution: Y.M., A.C., and M.K. conceptualized the study; Y.M. and M.K. developed the study methodology; Y.M., A.C., H.M., and M.B. performed investigation; Y.M., T.S., and M.K. provided resources; Y.M. wrote the original draft; Y.M., A.C., H.M., T.H., H.H., T.S., M.B., K.S., and M.K. wrote, reviewed, and edited the manuscript; Y.M. and M.K. acquired funding; and M.K. performed study supervision.
Conflict-of-interest disclosure: The authors declare no competing financial interest.
Correspondence: Mineo Kurokawa, Department of Hematology & Oncology, Graduate School of Medicine, The University of Tokyo, 7-3-1 Hongo, Bunkyo-Ku, Tokyo 113-8655, Japan; e-mail: kurokawa@m.u-tokyo.ac.jp.
References
Author notes
Anti-FLAG ChIP-seq and RNA-seq data are available through Sequence Read Archive (accession numbers PRJNA615776 and DRA014515).
Data are available on request from the corresponding author, Mineo Kurokawa (kurokawa@m.u-tokyo.ac.jp).
The full-text version of this article contains a data supplement.

