TO THE EDITOR:
Antibody-based therapies have shown remarkable activity in patients with relapsed/refractory B-cell acute lymphoblastic leukemia ALL (R/R B-ALL).1,2 Inotuzumab ozogamicin (InO) is an antibody drug-conjugate with anti-CD22 monoclonal antibody bound to calicheamicin.3 Clinical trials showed impressive activity in adult phase 2/3 trials, leading to approval by both the US Food and Drug Administration and the European Medicines Agency for use in adults with R/R B-ALL.1,4-6
Pediatric experience also shows promising efficacy, with a complete remission (CR) rate of 67% reported in a retrospective analysis of 51 children with R/R B-ALL treated with InO.7 A phase 1 study reported an 85% overall response rate among 25 pediatric patients with R/R ALL.8 Data from Children’s Oncology Group (COG) AALL1621 (#NCT02981628), a phase 2 trial for patients with R/R-B-ALL, reported a CR rate of 58% in 48 patients, with 65% of responders achieving minimal residual disease (MRD) <0.01%.9 Data from AALL1621 confirmed previous reports7 that CD22 downregulation could be a mechanism of resistance, as lower CD22 site density expression correlated with poor InO response.10
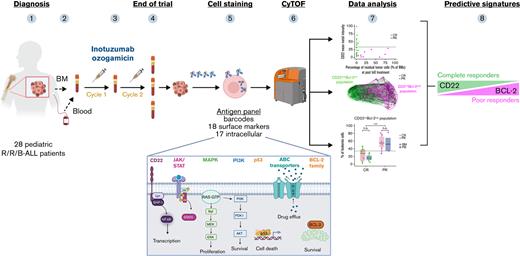
The focus of the current study was to prospectively identify biomarkers distinguishing favorable responders from poor responders to InO among pediatric patients with R/R-B-ALL treated on the COG AALL1621 trial. Predictive signatures would allow clinicians to identify potential responders while pursuing alternative therapies for predicted nonresponders, as well as to develop rational combinations with InO to overcome resistance mechanisms. For tumor sample phenotypic characterization, we implemented CyTOF, a mass cytometry technique to simultaneously assess >30 extracellular and intracellular antigens at a single-cell level. Our customized antibody panel allowed us to investigate B-ALL heterogeneity via surface markers and intracellular molecule expression11 pretreatment and posttreatment, and it enabled identification of leukemia profiles predictive of response/nonresponse to InO.
Detailed methods are presented in the supplemental Methods. In brief, 28 of 48 pediatric patients with R/R CD22+ B-ALL treated on COG AALL1621 (supplemental Table 1) had available samples and were included (supplemental Table 2). Sixty-eight samples were collected pretreatment and posttreatment (n = 28 and n = 40, respectively) for CyTOF analysis (supplemental Table 3). Patients were categorized as good responders, defined as CR or CR with incomplete count recovery (CR/CRi), or poor responders not achieving CR/CRi (non-CR/CRi), at the end of cycle 1 (cycle 2 if sampled). The training cohort included data from 9 patients (clinical outcomes are presented in supplemental Table 4); the inferred predictive algorithm was applied to the remaining 19 patients (supplemental Table 5). The study was approved by the National Cancer Institute Pediatric Central Institutional Review Board and local institutional review boards according to institutional policy. All participants or legally authorized guardians provided consent in accordance with the Declaration of Helsinki.
We first examined the predictive value of CD22 as a single marker of response to InO using outcome data of the training cohort (n = 9). Although differences between CR/CRi and non-CR/CRi patients were best reflected by differential expression of CD22 (supplemental Figure 1), low CD22 alone was not adequate to distinguish a responder from a nonresponder. Thus, although all non-CR/CRi patients exhibited low CD22 expression, some CR/CRi patients also displayed low CD22 expression (supplemental Figure 2). Conversely, patients with high CD22 expression achieved CR/CRi regardless of tumor burden.
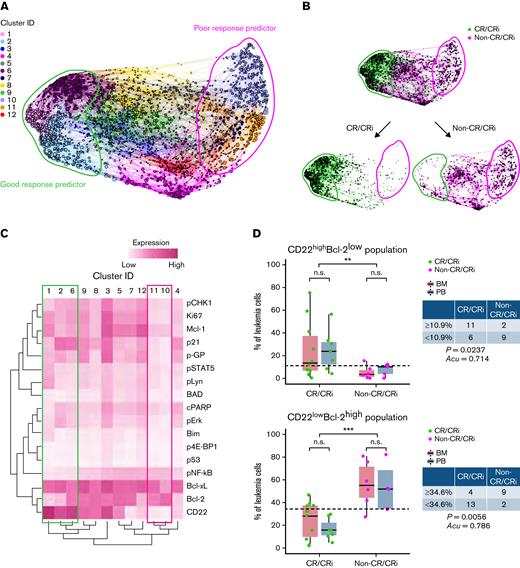
Tumor heterogeneity was reflected by the diversity of individual marker distribution (supplemental Figure 3); we therefore undertook high-dimensional cell community analysis12 profiling to explore predictor candidates of InO response. In the training cohort, pretreatment samples exhibited a clustering plot of 12 unique clusters (Figure 1A), showing differential distribution and tumor profiles between non-CR/CRi patients and CR/CRi patients (Figure 1B-C; supplemental Figure 4).
High-dimensional CyTOF profiling identifies leukemic cell population that could predict InO therapeutic response. (A) Force-directed clustering plot shows the relationships between leukemia cell communities identified according to multidimensional analysis (pretreatment data compiled from 6 CR/CRi patients and 3 non-CR/CRi patients in the training cohort). Each node is an aggregation of similar phenotypic cells resulting from downsampling of data and collection of similar nodes from 12 distinct leukemia cell clusters, showing distance indicative of phenotypic similarities among clusters. (B) Clustering plots of the pretreatment samples colored according to response outcomes: CR/CRi patients (green) and non-CR/CRi patients (pink). Bulk plots (top) and extracted plots of CR/CRi and non-CR/CRi patients (bottom) are depicted. For panels A and B, colored shapes delineate potential leukemia cell clusters of good response predictor (green) and poor response predictor (pink). (C) Heatmap showing the differential expression of CD22 and intracellular molecules used for clustering and community identification in the multidimensional analysis in panel A. Colored boxes indicate the leukemia profile of good (green) and poor (pink) response predictors identified in panel A. (D) Frequencies of CD22highBcl-2low cells and CD22lowBcl-2high cells at pretreatment in CR/CRi (n = 17) and non-CR/CRi patients (n = 11) are shown. Boxplots reflect whether samples were obtained from bone marrow (BM) (red) or peripheral blood (PB) (blue). Table data insets indicate the number of patients within each therapeutic response category above or below the threshold set by the application of the prediction tool. Application of predictive values was analyzed by using Fisher’s exact test. Statistical significance was analyzed by using a t test. ∗∗P < .01, ∗∗∗P < .001. n.s., not significant.
High-dimensional CyTOF profiling identifies leukemic cell population that could predict InO therapeutic response. (A) Force-directed clustering plot shows the relationships between leukemia cell communities identified according to multidimensional analysis (pretreatment data compiled from 6 CR/CRi patients and 3 non-CR/CRi patients in the training cohort). Each node is an aggregation of similar phenotypic cells resulting from downsampling of data and collection of similar nodes from 12 distinct leukemia cell clusters, showing distance indicative of phenotypic similarities among clusters. (B) Clustering plots of the pretreatment samples colored according to response outcomes: CR/CRi patients (green) and non-CR/CRi patients (pink). Bulk plots (top) and extracted plots of CR/CRi and non-CR/CRi patients (bottom) are depicted. For panels A and B, colored shapes delineate potential leukemia cell clusters of good response predictor (green) and poor response predictor (pink). (C) Heatmap showing the differential expression of CD22 and intracellular molecules used for clustering and community identification in the multidimensional analysis in panel A. Colored boxes indicate the leukemia profile of good (green) and poor (pink) response predictors identified in panel A. (D) Frequencies of CD22highBcl-2low cells and CD22lowBcl-2high cells at pretreatment in CR/CRi (n = 17) and non-CR/CRi patients (n = 11) are shown. Boxplots reflect whether samples were obtained from bone marrow (BM) (red) or peripheral blood (PB) (blue). Table data insets indicate the number of patients within each therapeutic response category above or below the threshold set by the application of the prediction tool. Application of predictive values was analyzed by using Fisher’s exact test. Statistical significance was analyzed by using a t test. ∗∗P < .01, ∗∗∗P < .001. n.s., not significant.
From high-dimensional clustering, we further identified an inverse correlation between CD22 and Bcl-2 expression that defined CR/CRi and non-CR/CRi leukemia profiles in pretreatment samples from the training cohort (Figure 1C). CD22 and Bcl-2 expression levels were defined according to their bimodal distribution (supplemental Figure 5A), with bimodal cutoffs used to discern frequencies of cells with positive vs negative protein levels. Non-CR/CRi samples strikingly presented higher frequency of CD22lowBcl-2high cells, whereas CR/CRi samples exhibited higher frequency of CD22highBcl-2low cells (supplemental Figure 5B). Moreover, longitudinal analysis showed that CD22lowBcl-2high cells persisted or increased over cycles in non-CR/CRi patients, whereas CD22highBcl-2low cells dynamically contracted in CR/CRi patients (supplemental Figure 5C; supplemental Figure 6).
We then assessed predictive frequencies of CD22highBcl-2low cells or CD22lowBcl-2high cells compared with solo markers (CD22high and Bcl-2high) in the validation cohort (n = 19) (supplemental Figure 7A). As in the training cohort, the frequency of pretreatment CD22highBcl-2low cells and CD22high cells was significantly higher in CR/CRi vs non-CR/CRi patients (Figure 1D; supplemental Figure 7B). Importantly, frequencies of CD22lowBcl-2high and Bcl-2high cells were significantly higher in non-CR/CRi patients in the validation cohort, suggesting a biomarker signature of poor response. Notably, receiver-operating curves showed that the area under the curve of CD22lowBcl-2high frequency was significantly superior to that of Bcl-2high alone in predicting non-CR/CRi (supplemental Figure 8). However, CD22high frequency alone was a superior favorable response predictor than CD22highBcl-2low. Cell-community clustering analysis further validated these observations (supplemental Figure 9).
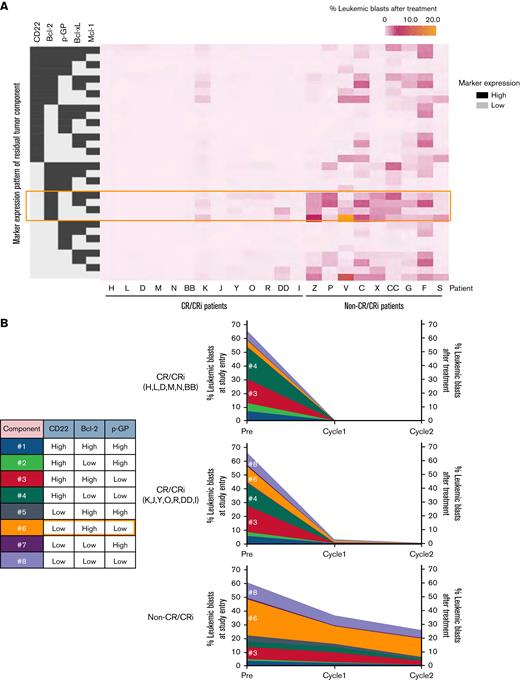
We next visualized longitudinal changes of leukemia cell profiles during InO therapy on the clustering plot from the training cohort in non-CR/CRi patients, which showed that CD22lowBcl-2high blasts persist at the end of cycle 1 or 2 (supplemental Figure 10). Notably, CD22lowBcl-2high blasts after treatment in both non-CR/CRi and MRD-positive CR/CRi patients express Bcl-2, Bcl-xL, and/or Mcl-1 (Figure 2A). Regarding p-GP, a drug efflux pump and a resistance modulator, CD22lowBcl-2highp-GPlow (#6, orange) cells dominated the blast population before and after therapy in non-CR/CRi patients, indicating that this population is a poor response marker and is minimally affected by InO treatment (Figure 2B). p-GP expression was stable over time in non-CR/CRi patients (supplemental Figure 11), suggesting that p-GP modulation did not contribute to InO resistance.
Residual leukemia cell profiling. (A) Heatmap data display residual leukemia cell composition after InO treatment. Tumor composition by expression patterns of 5 markers (from a total of 35 markers) are described by using grayscale (high expression, dark gray; low expression, light gray). The orange-colored outline highlights CD22lowBcl-2highp-GPlow cells. Data represent CR/CRi patients (n = 13) and non-CR/CRi patients (n = 9) with MRD ≥0.1% in marrow cells. (B) Longitudinal change of leukemia cell composition characterized by CD22, Bcl-2, and p-GP expression at each time point. Numbers in the table inset indicate the blasts with a unique composition of the 3 markers represented. CR/CRi patients were divided into 2 groups based on the absence or presence of persisting blasts as per the heatmap data in panel A and listed. Data represent the average frequency of cells with the CD22/Bcl-2/p-GP composition as described in the table for CR/CRi patients without residual blasts (n = 6, top), CR/CRi patients with residual blasts (n = 7, middle), and non-CR/CRi patients (n = 9, bottom). The scale of residual blasts at the end of cycle 1 and cycle 2 is displayed on the right side.
Residual leukemia cell profiling. (A) Heatmap data display residual leukemia cell composition after InO treatment. Tumor composition by expression patterns of 5 markers (from a total of 35 markers) are described by using grayscale (high expression, dark gray; low expression, light gray). The orange-colored outline highlights CD22lowBcl-2highp-GPlow cells. Data represent CR/CRi patients (n = 13) and non-CR/CRi patients (n = 9) with MRD ≥0.1% in marrow cells. (B) Longitudinal change of leukemia cell composition characterized by CD22, Bcl-2, and p-GP expression at each time point. Numbers in the table inset indicate the blasts with a unique composition of the 3 markers represented. CR/CRi patients were divided into 2 groups based on the absence or presence of persisting blasts as per the heatmap data in panel A and listed. Data represent the average frequency of cells with the CD22/Bcl-2/p-GP composition as described in the table for CR/CRi patients without residual blasts (n = 6, top), CR/CRi patients with residual blasts (n = 7, middle), and non-CR/CRi patients (n = 9, bottom). The scale of residual blasts at the end of cycle 1 and cycle 2 is displayed on the right side.
InO may improve outcome in patients with R/R B-ALL if used in the most sensitive leukemic populations. In our study, we identified a signature in pretreatment leukemic blasts that predicts response to InO therapy.
In line with prior reports,2,4,9,10 our predictive analysis indicates that patients with CD22high leukemia cells are more likely to achieve CR/CRi. Importantly, however, we also found that some patients with CD22low/intermediate leukemia cells can achieve CR/CRi, making CD22 unreliable as a single marker response predictor.
Accordingly, the most relevant finding was the identification of a predominant CD22low/Bcl-2high tumor profile at baseline as a predictive signature of poor response to InO. Longitudinal analysis of non-CR/CRi patients confirms that the CD22lowBcl-2high population is refractory to InO, and persists throughout treatment.
These findings indicate that InO combined with Bcl-2 family inhibitors may be therapeutically effective for patients with tumor cells highly expressing Bcl-2 family members,13,14 which is strengthened by the finding that CD22highBcl-2high blasts are more persistent than CD22highBcl-2low blasts after InO in this study. Combining InO and venetoclax, a BH3-mimetic approved by the US Food and Drug Administration, has been suggested by Kirchhoff et al13 and is currently under investigation in adult patients with R/R B-ALL (#NCT05016947).
Furthermore, no significant differences were observed between leukemic blasts from peripheral blood or bone marrow, allowing us to determine predictive profiles from a simple blood draw without requiring invasive bone marrow aspirates; this could be performed on a clinically accessible flow cytometer.
In summary, we identify CD22low/Bcl-2high as a dual-marker signature that reliably predicts poor response to InO. Furthermore, this approach also identifies dynamic changes of tumor composition after InO and suggests venetoclax as a promising drug with the potential for synergistic clinical efficacy, suggesting a patient-stratified approach for InO combinatorial treatments.
Acknowledgments: This work was supported by NCTN Operations Center Grant U10CA180886, NCTN Statistics & Data Center Grant U10CA180899, the St. Baldrick’s Foundation (M.L.L.), Cookies for Kids’ Cancer Award and Team Connor Award (E.D.-F.), a Pfizer ASPIRE award (M.L.L., E.D.-F., A.W., M.M.O., S.Z., and A.T.), the German Cancer Aid (A.W.), and the Uehara Memorial Foundation (K.I.).
The content is solely the responsibility of the authors and does not necessarily represent the official views of the National Institutes of Health.
Contribution: A.W. performed experiments and analyzed data; K.I. analyzed data and prepared the figures; S.T. and J.F. helped with data acquisition and S.T. conjugated antibodies; C.T., B.L.W., and N.N.S. helped with data analysis; L.J. helped with statistical analysis; C.M.Y. provided correlative data validating the findings; M.M.O., M.L.L., and E.D.-F. designed and oversaw the study; A.W., K.I., M.L.L., and E.D.-F. wrote the manuscript; and all authors approved the final manuscript submission.
Conflict-of-interest disclosure: M.M.O. received honoraria from Pfizer and Jazz Pharmaceuticals. The remaining authors declare no competing financial interests.
Correspondence: Ernesto Diaz-Flores, University California San Francisco, 1450 3rd St, HD230, Box 0519, San Francisco, CA 94158; e-mail: ernesto.diaz-flores@ucsf.edu; and Mignon Loh, Seattle Children's Hospital, 4800 Sand Point Way NE, MB.8.501, Seattle, WA 98105; e-mail: mignon.loh@seattlechildrens.org.
References
Author notes
The authors are committed to the timely dissemination of the data in the manuscript that may be requested. Although these data will include patient samples, all information about subjects has been de-identified. Data will be shared via e-mail or secure sharing providers (eg, Box). Requests for data sharing may be submitted to corresponding author, Ernesto Diaz-Flores (ernesto.diaz-flores@ucsf.edu).
The full-text version of this article contains a data supplement.
A.W. and K.I. contributed equally as first authors to this work.
M.L.L. and E.D.-F. contributed equally as senior authors to this work.


