Key Points
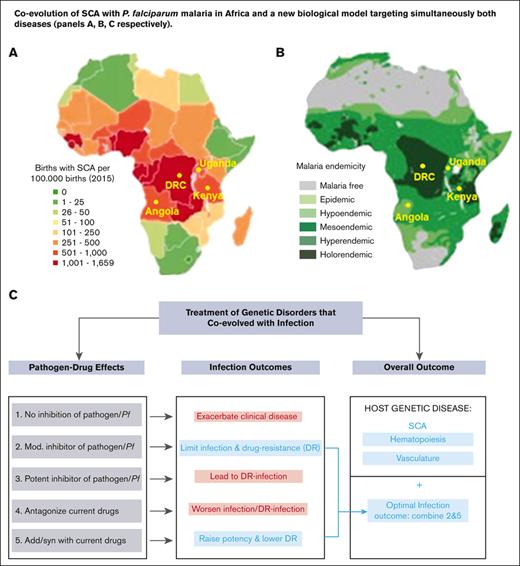
Pharmacodynamic exposures of HU used to treat patients with SCA directly kill malaria parasites at schizont stages.
A new biological model is presented for the global health treatments of major hemoglobinopathies that coevolved with malaria.
Abstract
Effective treatments for genetic disorders that coevolved with pathogens require simultaneous betterment of both conditions. Hydroxyurea (HU) offers safe and efficacious treatment for sickle cell anemia (SCA) by reducing clinical complications, transfusions, and death rates. Despite concerns that the HU treatment for SCA would increase infection risk by the human malaria Plasmodium falciparum, (the genetic driver of the sickle mutation), HU instead reduced clinical malaria. We used physiologically relevant drug exposures that mimic in vivo pharmacokinetics in humans. Under these conditions, we showed that HU and other ribonucleotide reductase (RNR) inhibitors have significant, intrinsic killing activity in vitro against schizont stages of P falciparum in both normal and sickle red blood cells. Long-term in vitro selection with HU increased the expression of Pfrnr genes but showed a low risk of eliciting stably resistant parasites or compromising the potency of current antimalarial drugs. Additive activity devoid of antagonism by HU was observed with a wide spectrum of commonly used antimalarial treatments. These data endorse broad, safe, and long-term use of HU for SCA in malaria-endemic countries and provide a novel biological model for the treatment of a genetic disorder with simultaneous, adjunct therapy of a life-threatening infection needed in a global health setting.
Introduction
Inherited genetic diseases such as hemoglobinopathies are recognized as a major global health priority.1 They cause a significant burden on health care,2 and therapies to treat them are receiving renewed attention.3 For the management of genetic disorders that coevolved with pathogens, it is imperative that new treatments also reduce associated infections, but a model for their evaluation is not established. Sickle cell anemia (SCA) is an autosomal recessive hemoglobinopathy and 1 of the most commonly inherited hematological disorders worldwide. SCA is a major global health concern, particularly in sub-Saharan Africa and India where more than 300 000 affected infants are born annually.4 Recent epidemiological data suggest that more than one-third of affected children in sub-Saharan Africa die before their fifth birthday,5 often without an established diagnosis. SCA is caused by a 17G>T substitution in the β-globin (HBB) gene, which leads to a G6V missense mutation and abnormal polymerization of the resulting sickle hemoglobin (HbS) under deoxygenation conditions, which in turn causes erythrocyte sickling and life-threatening clinical manifestations of severe hemolytic anemia, vaso-occlusive painful crises, stroke, and renal disease.6
The effective cure of SCA by stem cell transplantation is neither available nor affordable in countries with low resources. However, decades of controlled clinical research have shown that HU, a potent ribonucleotide reductase inhibitor, is both safe and efficacious for SCA and leads to reduced morbidity and mortality, leading to its increasing use to treat both children and adults with SCA in high-resource countries as well as Africa and India.4,7-12 Long-term administration of HU for patients with SCA induces the production of fetal hemoglobin (HbF), which inhibits erythrocyte sickling, improves red cell rheology, and increases red blood cell lifespan.13 The regions of sub-Saharan Africa and India with a high incidence of SCA are also associated with the highest malaria burden.14 This coevolution has occurred because a single copy of the HBB mutation leads to the sickle trait (HbAS) and confers substantial protection against severe malaria and death owing to malaria.15 However, individuals who inherit 2 copies have SCA (HbSS), are potentially more susceptible to severe malaria disease and death,16 at least in part, owing to baseline anemia and impaired splenic function.17
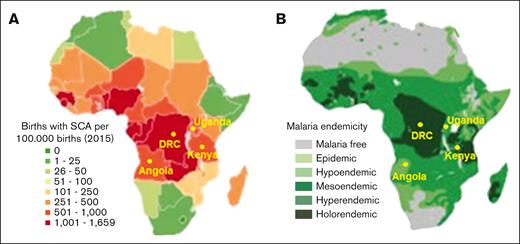
Two large recent clinical trials in different African countries that administered a single daily oral dose of HU to confirm the clinical benefits and safety o SCA also evaluated the effects of HU treatment on malaria.18,19 The NOHARM study12 and a later dose-escalation study19 reported low but similar levels in Plasmodium falciparum malaria in both the treated and placebo group, but all patients received antimalarial prophylaxis with good adherence. Remarkably the original REACH study18 with many more cases and no antimalarial treatment documented ∼50% reduction in malaria infections among children while receiving hydroxyurea, relative to their pretreatment rate. The 4 countries where the REACH trial was conducted, namely the Democratic Republic of Congo, Angola, Uganda, and Kenya show a strong coassociation between the geographic distribution of SCA and historic P falciparum malaria (ranging from holoendemic to hyperendemic; Figure 1A-B). The findings from the REACH studies are particularly important because they dispel concerns that the long-term administration of HU even in the absence of antimalarials may worsen malaria in children with SCA.21-23 Additional recent data from the REACH trial (with variable antimalarial treatment) documented a significantly greater reduction in malaria rates at higher daily hydroxyurea doses.24
Coevolution of SCA with P falciparum malaria in Africa. (A-B) Geographical distribution of (A) SCA and (B) P falciparum malaria in Africa (adapted from Kato et al20 and Piel et al14). Locations of the Democratic Republic of Congo, Uganda, Angola, and Kenya, countries where the REACH trial is conducted, are shown.
Coevolution of SCA with P falciparum malaria in Africa. (A-B) Geographical distribution of (A) SCA and (B) P falciparum malaria in Africa (adapted from Kato et al20 and Piel et al14). Locations of the Democratic Republic of Congo, Uganda, Angola, and Kenya, countries where the REACH trial is conducted, are shown.
Because the REACH trial shows substantially reduced clinical malaria incidence and mortality, we wanted to investigate whether HU had direct antiplasmodial activity. Orthologs of ribonucleotide reductase (RNR) are encoded by Plasmodium species. Therefore, we explored the intrinsic antiparasite effects of HU and other RNR inhibitors against laboratory malaria infections. We also queried the effects of HU action on the antiparasitic activity of antimalarials currently used in sub-Saharan Africa and the efficacy of major antimalarial drugs on HU-tolerant parasites for their long-term implications of potential decades of SCA treatment. Our findings provide a mechanistic understanding by which HU administration directly protects children with SCA against acute and severe malaria, which informs the drug management of SCA and malaria without the risk of eliciting parasite drug resistance. They also yield a novel model with the potential to be applicable to the treatment of infectious disease like malaria and genetic hematological disorders. This model is also important for the treatment of hematological disorders in the global health setting.
Materials and Methods
Plasmodium falciparum culture
Asexual blood stages of 3 different P falciparum strains 3D7 (Pf3D7), NF54 (PfNF54), and Dd2 (PfDd2) were propagated in A+ or O+ human erythrocytes (refer to supplemental Information).
In vitro drug assays
72 hours in vitro antimalarial drug assay
In vitro effective concentration values were determined by incubating parasites with a starting parasitemia of 0.2% or 0.5% and 1.5% hematocrit with a range of drug concentrations at 37°C for 72 hours. Parasite growth was assessed after 72 hours using flow cytometry25 (refer to supplemental Information) in either normal (HbAA) or sickle (HbSS) erythrocytes.
Checkerboard method
Ring Pf3D7 (age <9 hours) was exposed to a fixed concentration of hydroxyurea (20.6-329 μM) plus varied concentrations of primaquine ranging from 0 to 10 μM in a classical 72-hour in vitro antimalarial drug assay (refer to supplemental Information).
Pulsed method
Highly-synchronized parasites were pulsed for 3 or 6 hours at 37°C with 329 μM hydroxyurea or 0.1% dimethyl sulfoxide (DMSO), then washed with warm RPMI-1640 and incubated in complete media with or without drug or with 0.1% DMSO for 69 or 66 hours. At the end of the incubation time, the parasitemia was quantified using flow cytometry (refer to supplemental Information).
Fixed-ratio method
Drug interaction studies were performed using a modification of the fixed-ratio method26 (refer to supplemental Information).
In vivo drug assay
The effect of hydroxyurea on the antiplasmodial activity of primaquine or tafenoquine was tested in a mouse model of P berghei infection using the 4-day suppressive test27 (refer to supplemental Information).
In vitro selection of P falciparum resistant to HU
We adapted well-established methods with 2 strains Pf3D7 and PfDd228 (refer to supplemental Information).
Quantitation of P falciparum RNR and mdr1 gene expression and copy number using real-time PCR
Gene expression was analyzed using reverse transcription polymerase chain reaction (RT-PCR) and pfmdr1 copy number was assessed using TaqMan real-time PCR as previously described29 (refer to supplemental Information).
Results
HU and additional RNR inhibitors inhibit P falciparum growth in vitro
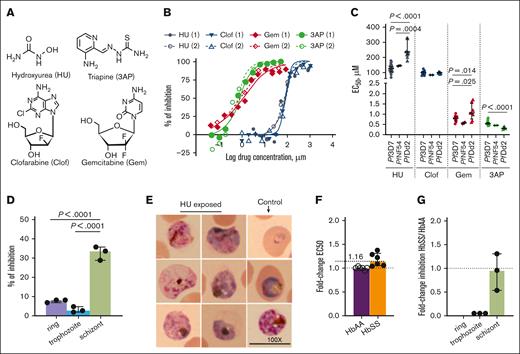
Because SCA and malaria have coevolved, drugs used to treat SCA in malaria-endemic regions should be evaluated to ensure they do not promote the proliferation of malaria parasites. We investigated the effects of HU exposure on the growth of P falciparum in an in vitro culture system. Because HU inhibits RNR, we also evaluated the following 3 additional known RNR inhibitors: clofarabine (Clof), gemcitabine (Gem), and triapine (3AP) (Figure 2A). In a standard 72-hour treatment, HU inhibited the parasite strain Pf3D7, with a half maximal effective concentration (EC50) of 127.6 μM (Figure 2B; Table 1). Clof showed a comparable EC50 of 100.1 μM but Gem and 3AP were more potent with EC50 of 0.8 μM and 0.55 μM, respectively. Similar effects were detected in 2 additional parasite strains PfNF54 and PfDd2 (Figure 2C; Table 1; supplemental Figure 1). The EC50 of HU and Gem was higher (1.6-1.8-fold) in PfDd2 (Figure 2C; Table 1). 3AP was more potent against PfDd2, whereas Clof was equally effective against all 3 strains. HU’s inhibitory effect was the most modest but it was still active across multiple genetic backgrounds. It might have been slightly less effective against the PfDd2 strain (which is chloroquine [CQ] resistant; but this was not shared across all RNR inhibitors).
HU and additional RNR inhibitors inhibit P falciparum growth in vitro in a stage-specific manner. (A) Chemical structure of HU and 3 additional RNR inhibitors (3AP, clof, and gem). (B) One representative inhibitory dose-response curve (with 2 technical replicates) of Pf3D7 strain exposed to indicated drugs for 72 hours (in a standard EC50 assay). (C) EC50 of HU (Pf3D7 n = 35; pfnf54 n = 2; pfdd2 n = 14), 3AP (Pf3D7 n = 15; pfnf54 n = 2; pfdd2 n = 7), clof (Pf3D7 n = 13; pfnf54 n = 2; pfdd2 n = 8), and gem (Pf3D7 n = 15; pfnf54 n = 2; pfdd2 n = 8) as shown. (D) Exposure of Pf3D7 ring, trophozoite, and schizont stages by a 3-hour pulse of 329 μm HU and assessment of their development to subsequent stages (n = 3 each with 3 technical replicates). (E) Morphological analyses of maturation of rings exposed 72 hours to 394.8 μm of HU, as detected by Giemsa staining data shown from 1 representative experiment (from n = 3, each with technical replicates). (F-G) Fold change in HU activity against Pf3D7 infection of sickle (HbSS) compared with normal (HbAA) red cells in (F) EC50 and (G) parasite stage assays. In panels D,F-G, each dot represents an independent biological experiment (with triplicate technical replicates). Detailed information on biological and technical replicates of experiments conducted in HbSS and HbAA blood samples are provided in the legend of supplemental Figure 2B-G. In panels C-D, F-G, the horizontal bar represents the median and the vertical bar represents the interquartile range. For the mean comparisons in panels C-D, 1-way analysis of variance (ANOVA) with a Tukey post hoc analysis was used. EC, effective concentration.
HU and additional RNR inhibitors inhibit P falciparum growth in vitro in a stage-specific manner. (A) Chemical structure of HU and 3 additional RNR inhibitors (3AP, clof, and gem). (B) One representative inhibitory dose-response curve (with 2 technical replicates) of Pf3D7 strain exposed to indicated drugs for 72 hours (in a standard EC50 assay). (C) EC50 of HU (Pf3D7 n = 35; pfnf54 n = 2; pfdd2 n = 14), 3AP (Pf3D7 n = 15; pfnf54 n = 2; pfdd2 n = 7), clof (Pf3D7 n = 13; pfnf54 n = 2; pfdd2 n = 8), and gem (Pf3D7 n = 15; pfnf54 n = 2; pfdd2 n = 8) as shown. (D) Exposure of Pf3D7 ring, trophozoite, and schizont stages by a 3-hour pulse of 329 μm HU and assessment of their development to subsequent stages (n = 3 each with 3 technical replicates). (E) Morphological analyses of maturation of rings exposed 72 hours to 394.8 μm of HU, as detected by Giemsa staining data shown from 1 representative experiment (from n = 3, each with technical replicates). (F-G) Fold change in HU activity against Pf3D7 infection of sickle (HbSS) compared with normal (HbAA) red cells in (F) EC50 and (G) parasite stage assays. In panels D,F-G, each dot represents an independent biological experiment (with triplicate technical replicates). Detailed information on biological and technical replicates of experiments conducted in HbSS and HbAA blood samples are provided in the legend of supplemental Figure 2B-G. In panels C-D, F-G, the horizontal bar represents the median and the vertical bar represents the interquartile range. For the mean comparisons in panels C-D, 1-way analysis of variance (ANOVA) with a Tukey post hoc analysis was used. EC, effective concentration.
EC of HU or other RNR inhibitors, and ACT’s partner drugs or active metabolite of ART against Pf3D7, PfNF54, and PfDd2 asexual blood stages in vitro
| Molecule . | Pf3D7 . | PfNF54 . | PfDd2 . | |||||
|---|---|---|---|---|---|---|---|---|
| EC50, μM . | EC90, μM . | EC50, μM . | EC90, μM . | ∗Fold difference . | EC50, μM . | EC90, μM . | †Fold difference . | |
| RNR inhibitor | ||||||||
| HU | 127.6 (105.8-140.8) | 471.5 (376.8-592.8) | 144.8 (142.3-147.4) | 344.1 (302.6-459.3) | 1.13 | 225.9 (201.5-235.6) | 759 (499-1043) | 1.77 |
| 3AP | 0.55 (0.54-0.60) | 2.30 (1.7-3.0) | 0.46 (0.45-0.46) | 0.89 (0.81-0.99) | 0.84 | 0.32 (0.28-0.39) | 0.50 (0.46-0.78) | 0.58 |
| Gem | 0.80 (0.67-0.90) | 13.1 (10.4-19.7) | 0.57 (0.52-0.62) | 12.7 (11.1-14.2) | 0.71 | 1.07 (0.77-1.52) | 54.96 (34.64-86.25) | 1.33 |
| Clof | 100.1 (86.8-110) | 189.2 (168-227.2) | 85.2 (84.4-86.0) | 156.4 (148.5-162.1) | 0.85 | 99.8 (96.21-104.08) | 259.4 (227.85-289.4) | 1.00 |
| Antimalarial drug | ||||||||
| LUM × 10-3 | 13.1 (5.3-26.8) | 82.1 (31.7-165.4) | ND | ND | — | 15.63 (13.32-17.93) | 57.52 (45.12-69.91) | 1.19 |
| AQ × 10-3 | 12.9 (9.3-17.4) | 21.6 (15.6-24.1) | ND | ND | — | 14.76 (12.54-16.97) | 32.14 (19.62-44.66) | 1.14 |
| CQ × 10-3 | 13.6 (11.8-16.7) | 20.3 (18.4-23.4) | ND | ND | — | 100.8 | 193.2 | 7.41 |
| PQ | 0.37 (0.29-0.44) | 2.2 (1.9-2.7) | ND | ND | — | 0.67 (0.55-0.78) | 1.58 (1.20-1.95) | 1.81 |
| TQ | 0.06 (0.04-0.09) | 0.61 (0.32-1.84) | ND | ND | — | ND | ND | — |
| DHA × 10-3 | 4.1 (3.0-5.2) | 17.2 (9.5-25.3) | ND | ND | — | 4.94 (3.57-6.30) | 11.3 (9.15-13.45) | 1.20 |
EC data are presented as median (interquartile range).
ART, artemisinin; EC, effective concentration; ND, not done.
PfNF54/Pf3D7 ratio of EC50.
PfDd2/Pf3D7 ratio of EC50.
During the blood stage of growth, P falciparum progresses through morphologically distinct stages, namely rings (formed immediately after the parasite entry in the red cell), then trophozoites (that develop after 17-24 hours), followed by the multinucleated schizont stage. To determine which parasite stages were targeted by HU, each stage was separately exposed to a drug. Furthermore, the parasites were treated with a bolus of HU to better mimic its limited daily pharmacological exposure at high micromolar levels in patients with SCA. Based on human pharmacokinetic studies,30,31 we used 329 μM of HU for 3 hours, after which the drug was washed out and parasites were allowed to mature for additional 69 hours. As shown in Figure 2D, ring and trophozoite stage parasites were inhibited by <10%. However, the growth and proliferation of schizonts was more substantially blocked by more than 30%. Together, these data confirmed that HU (and additional RNR inhibitors) had intrinsic activity against P falciparum principally by blocking schizonts (Figure 2E), which is consistent with the requirement of RNR and high levels of DNA synthesis at this stage of parasite development. HU showed closely comparable parasite inhibition in red cells from both normal individuals (HbAA) and patients with sickle cell (HbSS) (Figure 2F-G; supplemental Figure 2). Notably, peak blood concentrations of HU achieved in children with SCA often exceed 300 μM,30 suggesting daily exposure to HU alone may be detrimental to parasites.
Evaluation of the interaction of HU and additional RNR inhibitors with existing antimalarial drugs
A second key consideration about the potential wider use of HU is its potential interaction with currently used antimalarials. ACTs are the leading antimalarials that reduce parasite burden as well as death owing to malaria and are central to malaria elimination worldwide. They are composed of fast-acting artemisinins as well as a slow-acting partner drug. Artemisinins potently inhibit ring as well as later trophozoite and schizont parasite stages. However, they are also rapidly cleared in vivo (t1/2 < 30 minutes) and must be administered multiple times even during a short 3-day antimalarial treatment course. In contrast, the partner drugs can remain in circulation for months. Long-lived drugs are more likely to have greater interactions with HU administered daily for months to years.
Therefore, we analyzed the interactions of HU with a wide range of antimalarials. We conducted a standardized, fixed-ratio method used to study drug-drug interactions of combinations.26 Our drugs of choice included lumefantrine (LUM) and amodiaquine (AQ), the most widely used ACT partner drugs in Africa, as well as CQ, primaquine (PQ), and tafenoquine (TQ) used in the treatment of P vivax, a second malaria parasite that is on the rise. More recently, PQ has been used in the treatment of P falciparum to block gametocytes (the sexual stage in the blood that is, transmitted to the mosquito32). We also assessed dihydroartemisinin (DHA), the active metabolite of all artemisinin drugs that is used to treat both P falciparum and P vivax.
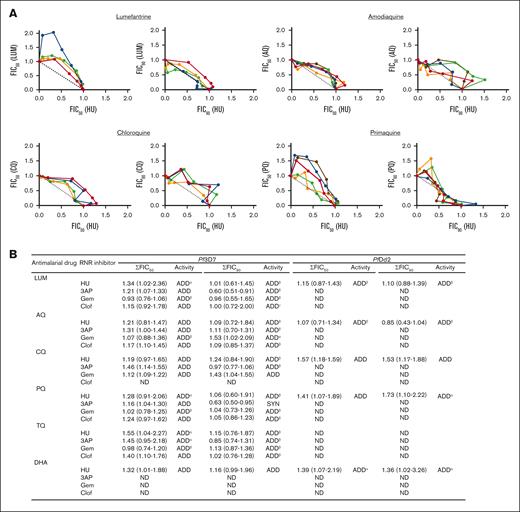
EC50 data for all antimalarial drugs needed to deploy the fixed-ratio method are summarized in Table 1. Briefly, the ring stage of Pf3D7 and PfDd2 strains were cultured for 72 hours in the presence of different concentrations and proportions of 2 test combinations (HU and an antimalarial) over the indicated times. We additionally tested the effects of other RNR inhibitors, Gem, Clof, and 3AP (in place of HU). The observed values for EC50 and EC90 were analyzed in relation to the data obtained with a single combination.26 The fractional inhibitory concentrations (FICs) of HU, other RNR inhibitors, and the currently used antimalarial drug at the EC50 and EC90 were then calculated and plotted in isobolograms. Sums of the FICs (∑FICs) of the drug combinations were calculated to evaluate the different degrees of inhibition at EC50 and EC90 and used to infer drug-drug interactions as previously described33: ∑FIC <0.5 indicates substantial synergism, ∑FIC <1 indicates moderate synergism, ∑FIC ≥1 and <2 indicates additive interaction, ∑FIC ≥2 and <4 indicates slight antagonism, and ∑FIC >4 indicates marked antagonism. As shown in Figure 3A-B; supplemental Figure 3, the median ∑FICs predict the additive effects of HU with LUM, AQ, CQ, PQ, TQ, and DHA. The range associated with ∑FICs suggest that there may be trends toward synergy or slight antagonism with LUM, PQ, and TQ, but these are expected to be minor (Figure 3B, refer to footnote). Based on the median ∑FICs, the additive effects are also predicted for other RNR inhibitors with these antimalarials (supplemental Figure 3). This was observed in the Pf3D7 strain as well as the CQ-resistant PfDd2 strain, suggesting conservation across strains.
Analyses of the interactions between HU and antimalarial drugs. (A) Isobologram analyses of the interaction between HU and indicated antimalarial drugs against Pf3D7: lumefantrine (LUM), amodiaquine (AQ), chloroquine (CQ), and primaquine (PQ). FIC of HU vs FIC of antimalarial drugs were plotted. Isobolograms were constructed from EC50 or EC90 values. For each drug combination, the FIC was calculated by dividing the measured “apparent” EC values for individual drugs in the different combinations of HU and antimalarial drugs EC values obtained when the drugs were used alone. Colors represent independent experiments. (B) Sum of 50% and 90% fractional inhibitory concentration (∑FIC50, 90) of the interaction of HU and indicated antimalarial drugs against Pf3D7 and PfDd2 strains, carried out in 2 to 5 independent experiments. In panel B, ∑FIC values are presented as median (range). α, ADD-SLANT; β, ADD-SYN; γ, ADD-SYN-SLANT. ADD, additive; ND, not determine; SLANT, slightly antagonistic; SYN, synergistic, based on well-established criteria of ∑FIC <0.5, substantial synergism, ∑FIC <1 moderate synergism, ∑FIC ≥1 and <2 additive interaction; ∑FIC ≥2 and <4 slight antagonism and ∑FIC >4 marked antagonism.33
Analyses of the interactions between HU and antimalarial drugs. (A) Isobologram analyses of the interaction between HU and indicated antimalarial drugs against Pf3D7: lumefantrine (LUM), amodiaquine (AQ), chloroquine (CQ), and primaquine (PQ). FIC of HU vs FIC of antimalarial drugs were plotted. Isobolograms were constructed from EC50 or EC90 values. For each drug combination, the FIC was calculated by dividing the measured “apparent” EC values for individual drugs in the different combinations of HU and antimalarial drugs EC values obtained when the drugs were used alone. Colors represent independent experiments. (B) Sum of 50% and 90% fractional inhibitory concentration (∑FIC50, 90) of the interaction of HU and indicated antimalarial drugs against Pf3D7 and PfDd2 strains, carried out in 2 to 5 independent experiments. In panel B, ∑FIC values are presented as median (range). α, ADD-SLANT; β, ADD-SYN; γ, ADD-SYN-SLANT. ADD, additive; ND, not determine; SLANT, slightly antagonistic; SYN, synergistic, based on well-established criteria of ∑FIC <0.5, substantial synergism, ∑FIC <1 moderate synergism, ∑FIC ≥1 and <2 additive interaction; ∑FIC ≥2 and <4 slight antagonism and ∑FIC >4 marked antagonism.33
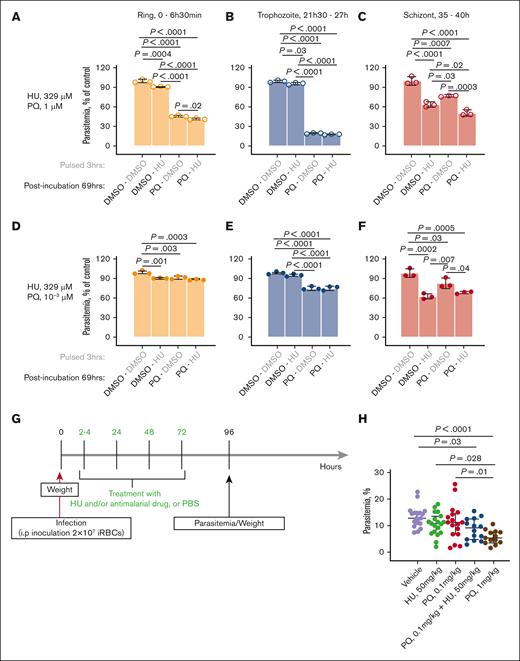
LUM, AQ, CQ, and DHA kill parasites at all blood stages. Hence, the additive effect of HU with these drugs is likely because of its added effect on schizonts. However, little is understood about the killing effects of 8-aminoquinolines. We were particularly interested in PQ, which remains of high value in targeting both P falciparum and P vivax species and stages that are not blocked by other antimalarials. Therefore, we reevaluated the dose-response curves of PQ + HU starting at an early ring stage (supplemental Figure 4A) and their stage-dependent action in short “pulsed” treatments with 1 or both drugs followed by a longer chase with 1 or both (supplemental Figure 4B). Because HU preferentially targets schizonts, we separately treated ring, trophozoite, and schizont stages with a pulse of HU, followed by HU alone or PQ alone (Figure 4A-F). PQ was less effective at the schizont stage (Figure 4A-F; supplemental Figure 4D). In contrast, but as expected, HU showed better activity against schizonts (Figure 4A-F; supplemental Figure 4C). Therefore, we inferred that HU and PQ act at different stages to induce the highest parasitic killing.
Extended analyses of the antiplasmodial activity of HU and PQ in vitro and in vivo. (A-F) Inhibition rate of PQ and/or HU according to the age of asexual blood stage parasites. Parasites (ring, 0-6.5 hours (h); trophozoite, 21.5-27 h; schizont, 35-40 h) were pulsed for 3 hours with 329 μM HU or 0.1% DMSO, then extensively washed and incubated 69 hours in media containing 1% DMSO or 329 μM HU or 1 μM (panels A-C) or 10-3 μM (panels D-F) of PQ. In panels A-F, DMSO-treated parasites were used as controls. (G-H) Additive activity of HU and PQ in P berghei Anka-infected mice. (G) Schematic representation of P berghei Anka (PbA) infection, drug treatment, body weight, and tail blood (for parasitemia) collections. (H) Parasitemia after 4 days of treatment. In panels A-F, H, the horizontal bar represents the median and the vertical bar represents the interquartile range. For the mean comparisons in panels A-F, H, 1-way ANOVA with a Tukey post hoc analysis was used.
Extended analyses of the antiplasmodial activity of HU and PQ in vitro and in vivo. (A-F) Inhibition rate of PQ and/or HU according to the age of asexual blood stage parasites. Parasites (ring, 0-6.5 hours (h); trophozoite, 21.5-27 h; schizont, 35-40 h) were pulsed for 3 hours with 329 μM HU or 0.1% DMSO, then extensively washed and incubated 69 hours in media containing 1% DMSO or 329 μM HU or 1 μM (panels A-C) or 10-3 μM (panels D-F) of PQ. In panels A-F, DMSO-treated parasites were used as controls. (G-H) Additive activity of HU and PQ in P berghei Anka-infected mice. (G) Schematic representation of P berghei Anka (PbA) infection, drug treatment, body weight, and tail blood (for parasitemia) collections. (H) Parasitemia after 4 days of treatment. In panels A-F, H, the horizontal bar represents the median and the vertical bar represents the interquartile range. For the mean comparisons in panels A-F, H, 1-way ANOVA with a Tukey post hoc analysis was used.
To assess whether the observed in vitro additive effects of HU and PQ could be observed in vivo, we used the P berghei Anka (PbA) infection model in C57BL/6 mice (as summarized in Figure 4G; supplemental Figure 5). Briefly, mice were treated with HU (50 mg/kg) and/or PQ (0.1 or 1 mg/kg), initiated 2 to 4 hours after the infection. Drugs were administered every 24 hours for additional 3 consecutive days and, parasitemia was determined at the indicated time points. As shown in Figure 4G, a combination of HU and PQ (0.1 mg/kg) reduced parasite growth relative to vehicle treatment. However, neither drug alone had a significant effect although raising the dose of PQ (to 1 mg/kg) was suppressive. In contrast to PQ, the action of TQ in single or multiple doses was not affected by HU (supplemental Figure 5A-B), presumably owing to the greater plasma exposure of TQ. At the doses used, HU did not induce weight loss in mice (which was used as the first indication of overt toxicity; supplemental Figure 5C-D).
Together these data suggest that HU can contribute additive antiparasite effects in vivo that may help dose management, particularly for antimalarials with lower plasma exposure. The additive effect of HU is likely because of its efficacy in blocking schizonts. Furthermore, HU is additive across multiple broad classes of antimalarials with different chemical scaffolds as well as different P falciparum strains.
Selection and characterization of HU-resistant P falciparum
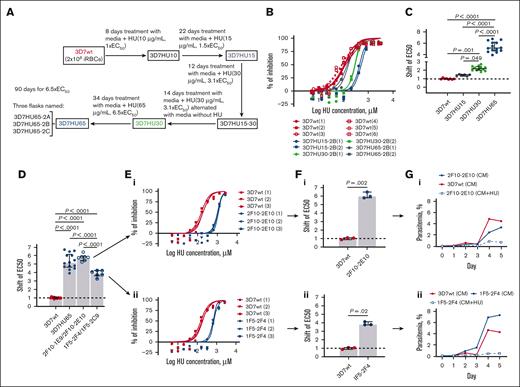
To identify targets of HU in P falciparum, we selected parasites resistant to the drug. We performed single-step in vitro resistance selections by exposing Pf3D7 and PfDd2 parasites to HU in 1 step of selections at 5× or 3× EC50 (Materials and Methods). Both failed to yield resistant parasites after 60 days (data not shown) suggesting neither strain was likely to readily become resistant to HU. However, a slow increase of HU over 90 days in 4 gradual, sequential steps of drug concentrations at 1, 1.5, 3.1, and 6.7 × EC50, led to a selection of Pf3D7 parasites with EC50 greater than 850 μM (3D7HU65, as compared with the starting parasites with EC50 of 131 μM; Figure 5A-C). Under the same chemoselection scheme for more than 90 days, PfDd2 showed a shift of <2 × EC50. (supplemental Figure 6). Because PfDd2 parasites showed such a low propensity to develop resistance, subsequent experiments were limited to the Pf3D7 strain. Several independent clones derived from 3D7HU65 in the presence of HU, showed EC50 is comparable to the bulk population (Figure 5D-F). Two clones were expanded in drug-free media, 1 was with the highest EC50, and the second was with the lowest EC50. Both were then exposed to 850 μM HU. Both failed to proliferate (Figure 5G), suggesting that the gain of resistance in the presence of HU was likely transient (owing to plasmid-based amplification of putative resistance genes) rather than stable resistance owing to the mutation or duplication of the parasite’s chromosomal copy of the target gene.
In vitro selection of HU-resistant Pf3D7 strain. (A) Diagram of selection schemes. Stepwise selections: 3 independent parasite cultures were exposed to stepwise increasing concentrations of HU (131.5-854.65 μM) as indicated. (B) A representative dose-response curves of HU against parental strain (3D7wt) and bulk-selected HU-resistant parasite populations at different time points of the selection (3D7HU15, 3D7HU30, and 3D7HU65). (C) Shift in EC50 of bulk-selected HU–exposed parasite populations at different time points of the selection (3D7HU15, 3D7HU30, and 3D7HU65). (D) Shift in EC50 of the bulk-selected 3D7HU65 parasite populations and 4 clones with higher (2F10-1E9, 2F10-2E10) or lower (1F5-2F4 and 1F5-2C9) EC50. (E) Dose-response curves of clones 2F10-2E10 (i) and 1F5-2F4 (ii) and parental Pf3D7 (3D7wt). (F) Shift in EC50 of clones 2F10-2E10 (i) and 1F5-2F4 (ii). (G) Growth response of clones 2F10-2E10 (i) and 1F5-2F4 (ii) maintained in media without HU (CM) or with HU at 6.5× EC50 (CM+HU65). Parental Pf3D7 strain (3D7wt) is also shown. In panels C-D, F, the horizontal bar represents the median and the vertical bar the interquartile range. For the mean comparisons, 1-way ANOVA with a Tukey post hoc analysis was used in panels C-D, and the Mann-Whitney test was used in panel F.
In vitro selection of HU-resistant Pf3D7 strain. (A) Diagram of selection schemes. Stepwise selections: 3 independent parasite cultures were exposed to stepwise increasing concentrations of HU (131.5-854.65 μM) as indicated. (B) A representative dose-response curves of HU against parental strain (3D7wt) and bulk-selected HU-resistant parasite populations at different time points of the selection (3D7HU15, 3D7HU30, and 3D7HU65). (C) Shift in EC50 of bulk-selected HU–exposed parasite populations at different time points of the selection (3D7HU15, 3D7HU30, and 3D7HU65). (D) Shift in EC50 of the bulk-selected 3D7HU65 parasite populations and 4 clones with higher (2F10-1E9, 2F10-2E10) or lower (1F5-2F4 and 1F5-2C9) EC50. (E) Dose-response curves of clones 2F10-2E10 (i) and 1F5-2F4 (ii) and parental Pf3D7 (3D7wt). (F) Shift in EC50 of clones 2F10-2E10 (i) and 1F5-2F4 (ii). (G) Growth response of clones 2F10-2E10 (i) and 1F5-2F4 (ii) maintained in media without HU (CM) or with HU at 6.5× EC50 (CM+HU65). Parental Pf3D7 strain (3D7wt) is also shown. In panels C-D, F, the horizontal bar represents the median and the vertical bar the interquartile range. For the mean comparisons, 1-way ANOVA with a Tukey post hoc analysis was used in panels C-D, and the Mann-Whitney test was used in panel F.
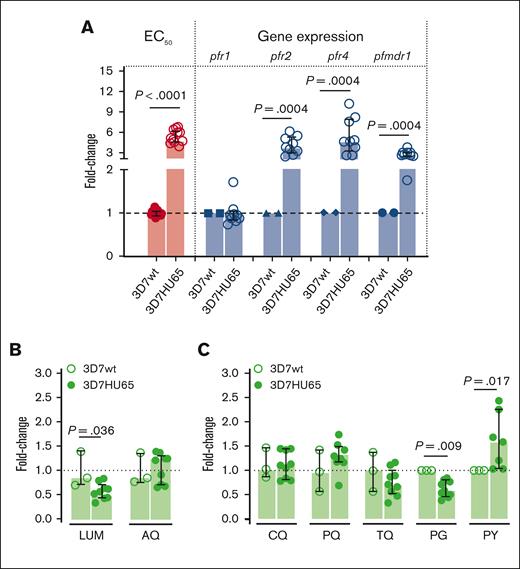
Because HU inhibits RNRs,34 the most likely target in P falciparum is RNR class I which is a complex of homodimers of 2 large (PfR1, chain α) and 2 small (PfR2, chain β) subunits.35 The α chain is encoded by pfr1 gene located in chromosome 14, whereas the β chain is encoded by 2 genes pfr2 and pfr4 located in chromosomes 14 and 10, respectively.35,36 Both large and small subunits are required for activity.37 The α chain accommodates the allosteric regulatory sites and the catalytic sites, whereas the β chain houses the diferric-tyrosyl radical that is essential for catalysis.36,37 Therefore, we examined the effects of HU on the pfr1, pfr2, and pfr4 genes. We also investigated the multidrug resistance 1 gene (pfmdr1) known to be involved in the mechanisms of resistance to a variety of drugs. Analyses were conducted with the trophozoite stage. As shown in Figure 6A, qPCR analyses suggest no change in the expression of pfr1 in HU-resistant Pf3D7 (Figure 6A). In contrast, the genetic coding for the small subunit of RNR enzyme (pfr2 and pfr4) and pfmdr1 was significantly increased in HU-resistant parasites compared with the Pf3D7 parent line (Figure 6A). The level of HU resistance of 3D7HU65 (median [interquartile range], 5.2 [4.7-6.2]) was better correlated with the expression of pfr2 (3.8 [3.0-5.3]) and pfr4 (4.7 [3.3-7.9]) genes compared with the pfmdr1 gene (2.7 [2.5-3.0]) (Figure 6A), suggesting that the overexpression of pfr2 and pfr4 genes may contribute to HU resistance of 3D7HU65 parasites.
Correlation between HU-resistance–gene-expression profile for bulk-selected, HU-tolerant 3D7HU65 parasites and the efficacy of ACT partner drugs against HU-tolerant strains. (A) Correlation between change in EC50 and levels of gene expression of RNR (pfr1, pfr2 and pfr4) and multidrug resistance marker 1 (pfmdr1) genes of HU-tolerant 3D7HU65 parasites analyzed using qRT-PCR. Parental Pf3D7 line (3D7wt) was used as baseline. (B-C) Antiplasmodial activity of current, major antimalarial drugs against 3D7HU65 HU-tolerant parasites. The horizontal bar represents the median and the vertical bar the interquartile range. For the mean comparisons, the Mann-Whitney test was used for the fold-change of EC50 in panels A-C, and Wilcoxon signed rank test for the fold-change of gene expression in panel A.
Correlation between HU-resistance–gene-expression profile for bulk-selected, HU-tolerant 3D7HU65 parasites and the efficacy of ACT partner drugs against HU-tolerant strains. (A) Correlation between change in EC50 and levels of gene expression of RNR (pfr1, pfr2 and pfr4) and multidrug resistance marker 1 (pfmdr1) genes of HU-tolerant 3D7HU65 parasites analyzed using qRT-PCR. Parental Pf3D7 line (3D7wt) was used as baseline. (B-C) Antiplasmodial activity of current, major antimalarial drugs against 3D7HU65 HU-tolerant parasites. The horizontal bar represents the median and the vertical bar the interquartile range. For the mean comparisons, the Mann-Whitney test was used for the fold-change of EC50 in panels A-C, and Wilcoxon signed rank test for the fold-change of gene expression in panel A.
Although we were unable to select P falciparum stably resistant to HU, we used 3D7HU65 parasites that were tolerant of the drug to test their killing by 7 antimalarial drugs including key partner drugs used in ACTs, namely LUM, AQ, as well as CQ, PQ, TQ, proguanil (PG), sulfadoxine (SD), and pyrimethamine (PY). As shown in Figure 6B-C, LUM and AQ effectively killed HU-tolerant parasites, as did CQ, PQ, TQ, PG, and PY (although PY may be slightly less effective against HU-resistant parasites compared with the parental Pf3D7 line). We were unable to evaluate SD. This was because HU-tolerant parasites showed poor growth in media depleted of folic acid (FA) and para- aminobenzoic acid (PABA; not shown) needed to test SD (because both FA and PABA antagonize the drug). However, poor growth of HU-tolerant parasites in the depleted media suggests they have a greater need for FA and PABA and are therefore likely to be even more susceptible to SD.
Taken together, these data suggest that P falciparum is refractory to developing resistance to HU. Moreover, current major antimalarials remain effective against HU-tolerant parasites (and 1 LUM, the most widely used ACT partner drug is significantly more active against HU-tolerant parasites), confirming that chronic exposure to HU does not result in resistance to antimalarials but may increase susceptibility to an important ACT partner drug.
A model for simultaneous treatment of a genetic disorder that coevolved with a pathogen
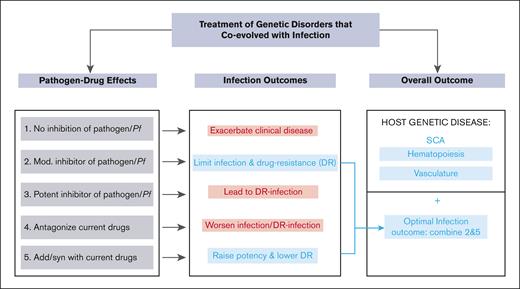
Our data strongly support the expanding long-term use of HU in malaria-endemic countries to treat SCA and enhance malaria elimination. They also suggest a generalizable model for the simultaneous treatment of genetic disorders that coevolved with human pathogens. As summarized in Figure 7, if treatment for a genetic disorder like SCA did not antagonize malaria infection (Figure 7, treatment 1), the affected individuals would remain highly susceptible to severe malaria and death and thereby possibly compromise even short-term gains made with the treatment of SCA. A treatment with a modest antipathogen activity that bypasses resistance and effects long-term reduction of the pathogenic load presents a strategy of choice (Figure 7, treatment 2). A treatment that was potent against infection (Figure 7, treatment 3) would expectedly lead to resistant parasites proliferating in patients with infection and preclude long-term treatment (of months to years) needed for the genetic disorder. Interactions with current drugs for the infection would also be important. Antagonist interactions present challenges (Figure 7 treatment 4), whereas favorable drug-drug interactions combined with modest antiinfection activity as seen between HU and antimalarials, present the optimal path (Figure 7, treatments 3 and 5). This in conjunction with the improvement of the host genetic disorder (which in the case of SCA is through stimulation of hematopoiesis and reduction of vasculature inflammation) yields a safe long-term treatment that can be deployed in global health.
A biological model for the treatment of a genetic disorder that coevolved with infection. In this model, infection outcomes are assessed for the treatments of the host genetic disorder. Treatment 1, which has no effect on malaria, would leave patients with SCA highly susceptible to severe malaria and death. Treatment 2 with modest antiinfection activity that bypasses resistance, presents a strategy of choice. Treatment 3, which is potent against infection is expected to select resistant parasites given long-term treatment (of months to years) needed to treat the genetic disorder. Treatment 4 with antagonist interactions with antimalarial drugs are undesirable, whereas favorable drug interactions (treatment 5) combined with modest antiinfection activity as seen between HU and antimalarials (treatment 2), present the optimal path. This in conjunction with the improvement of the host genetic disorder (which in the case of SCA is through stimulation of hematopoiesis and reduction of vasculature inflammation) yields a safe long-term treatment that can be deployed in global health.
A biological model for the treatment of a genetic disorder that coevolved with infection. In this model, infection outcomes are assessed for the treatments of the host genetic disorder. Treatment 1, which has no effect on malaria, would leave patients with SCA highly susceptible to severe malaria and death. Treatment 2 with modest antiinfection activity that bypasses resistance, presents a strategy of choice. Treatment 3, which is potent against infection is expected to select resistant parasites given long-term treatment (of months to years) needed to treat the genetic disorder. Treatment 4 with antagonist interactions with antimalarial drugs are undesirable, whereas favorable drug interactions (treatment 5) combined with modest antiinfection activity as seen between HU and antimalarials (treatment 2), present the optimal path. This in conjunction with the improvement of the host genetic disorder (which in the case of SCA is through stimulation of hematopoiesis and reduction of vasculature inflammation) yields a safe long-term treatment that can be deployed in global health.
Discussion
Infectious diseases are hypothesized to play a critical role in the selection and maintenance of defective genetic alleles within the human gene pool. Malaria has played a profound role in the development of multiple genetic disorders affecting the red blood cells but especially for inherited hemoglobinopathies; the protective effects of sickle trait against severe malaria and death owing to malaria are well established. Patients with SCA have lower levels of parasite burden than those with normal hemoglobin levels,38,39 suggesting that the induction of hemoglobin F would not provide a mechanism to reduce parasitemia. In this setting, how effective HU treatment of individuals with homozygous SCA, who are more susceptible to severe malaria disease and death, also had significantly reduced P falciparum malaria in the REACH trial, is not understood. Furthermore, the potential interactions of HU with widely used antimalarials, particularly ACTs that have played an important role in malaria elimination, remained unexplored. Our findings suggest that repeated daily exposure to HU alone, at levels achieved in human plasma (even in the absence of specific antimalarial treatment) administered over months to years, may be sufficient to kill P falciparum malaria and reduce clinical malaria infections in children with SCA.
Previous studies have reported results on the effects of continued exposure to HU on parasite-induced cerebral malaria in mouse models40 and minor killing activity of P falciparum in vitro.41 However, these previous studies did not use a pulse method to mimic pharmacologic HU exposure in patients with SCA, nor did they show HU’s stage-specific mechanism of targeting schizonts. The high concentrations (>100 μM) needed for HU contrasts the EC50 of current antimalarials in the low to midnanomolar range. This, along with HU’s preferred killing of schizonts and median ∑FICs achieved in drug-drug interactions, support the hypothesis that HU acts additively with antimalarials rather than changing their intrinsic potency. Importantly, HU fails to antagonize a broad range of effective antimalarials and multiple parasite strains, further suggesting that its deployment would not hinder malaria elimination in patients with SCA across multiple countries and continents, despite country-specific differences in the use of antimalarials.
Prolonged exposure to potent antimalarials (acting at low nanomolar concentrations) has led to the emergence of P falciparum resistant to major antimalarials both in vivo and in vitro. The relatively high EC50 for HU of >100 μM is the likely reason underlying our observations that P falciparum parasites are refractory to developing stable resistance to HU, even after exposure at concentrations and times that vastly exceed those achieved by the drug in human plasma. We were able to detect HU-tolerant parasites that arise in association with the amplification of RNR, mdr, and possibly other unidentified genes. However, even if such HU-tolerant parasites were to transiently appear in vivo, our findings suggest that they would be rapidly killed by a wide range of antimalarials that are partner drugs of ACTs. Because LUM is slightly more active against HU-tolerant parasites, the tolerance may come at a cost to the parasite, a hypothesis that is further strengthened by our data that stable resistance could not be established.
Simultaneous drug-action on both the infection and its coevolved disease is novel and may be unique for malaria and SCA. However, as summarized in Figure 7, the paradigm may conceptually be generalized to guide the deployment of a broader range of genetic treatments that also improve infection control in the global health setting. SCA and α- and β-thalassemia are very common hemoglobinopathies worldwide. There is emerging evidence that HU may be beneficial for the treatment of β-thalassemia,42 which is present in the Mediterranean region, Southeast Asia, and South Asia. Therefore, deployment of HU in these regions may also provide adjunct therapy of malaria in patients with β-thalassemi. All major hemoglobinopathies have coevolved with malaria and thus emerging treatments for these diseases must be evaluated for their effects on plasmodial infection. There is no data yet for other genetic diseases coevolved with infection, such as cystic fibrosis-cholera, Tay-Sachs-tuberculosis, as well as phenylketonuria-mycotic abortions.43 Nonetheless the model in Figure 7 should be applicable to a broad range of erythrocyte disorders that have coevolved with malaria, including other common qualitative (HbC and HbE) and quantitative (α, β thalassemia) hemoglobinopathies.
Finally, the clear additive effects of HU with PQ suggest the need to evaluate the potential adjunctive effects of HU on P vivax, a second major human malaria parasite species that is on the rise in Africa and worldwide. This would be important for patients with SCA but also would lead to more broad management of PQ, which is contraindicated in humans with glucose-6-phosphate deficiency, a common enzymopathy affecting 400 million people44 that also has coevolved with malaria.
Acknowledgments
This work was supported by National Institutes of Health grant R01 HL 1330330 (K.H.). R.E.W. receives relevant grant funding from the National Institutes of Health (U01 HL133883) and Doris Duke Charitable Foundation (2019163).
Authorship
Contribution: I.S. was responsible for the conceptualization, study design, execution of all experimental studies, curation and analyses of all data, including statistical analyses, and visualization of results; R.E.W. was responsible for the conceptualization and study design, data curation and analyses, and visualization of results; N.M. was responsible for the conceptualization and study design, data curation and analyses, and visualization of results; K.H. was the principal investigator, was responsible for the overall conceptualization and project supervision and design, curation and analyses of all data, and visualization of results; and all authors were responsible for drafting and editing the manuscript.
Conflict-of-interest disclosure: The authors declare no competing financial interests.
Correspondence: Innocent Safeukui, Department of Biological Sciences, Boler-Parseghian Center for Rare and Neglected Diseases, Eck Institute of Global Health, University of Notre Dame, Notre Dame, IN 46556; e-mail: innocent.safeukui@nd.edu; and Kasturi Haldar, Department of Biological Sciences, Boler-Parseghian Center for Rare and Neglected Diseases, Eck Institute of Global Health, University of Notre Dame, Notre Dame, IN 46556; e-mail: khaldar@nd.edu.
References
Author notes
Accession numbers for primers are indicated as follows: pfr1 (GenBank accession no. U01323.1), pfr2 (GenBank accession no. U01322.1), and pfr4 (GenBank accession no. AY669809.1). The authors declare that all data supporting the findings of this study are available within the article and its supplemental Information. Requests for resources and reagents should be directed to the corresponding author, Kasturi Haldar (khaldar@nd.edu).
Data are available on request from the corresponding author, Kasturi Haldar (khaldar@nd.edu).
The full-text version of this article contains a data supplement.

