

Key Points
HDAC1 is recruited at SEs to transcriptionally activate driver genes in CLL. In the absence of SEs, HDAC1 silences gene expression.
The transcriptional activator and repressor functions of HDACs cooperate to establish transcriptional dependencies in CLL.

Abstract
Chronic lymphocytic leukemia (CLL) is a quiescent B-cell malignancy that depends on transcriptional dysregulation for survival. The histone deacetylases are transcriptional regulators whose role within the regulatory chromatin and consequence on the CLL transcriptome is poorly characterized. Here, we profiled and integrated the genome-wide occupancy of HDAC1, BRD4, H3K27Ac, and H3K9Ac signals with chromatin accessibility, Pol2 occupancy, and target expression signatures in CLL cells. We identified that when HDAC1 was recruited within super-enhancers (SEs) marked by acetylated H3K27 and BRD4, it functioned as a transcriptional activator that drove the de novo expression of select genes to facilitate survival and progression in CLL. Targeting HDACs reduced BRD4 and Pol2 engagement to downregulate the transcript and proteins levels of specific oncogenic driver genes in CLL such as BLK, a key mediator of the B-cell receptor pathway, core transcription factors such as PAX5 and IKZF3, and the antiapoptotic gene, BCL2. Concurrently, HDAC1, when recruited in the absence of SEs, repressed target gene expression. HDAC inhibition reversed silencing of a defined set of protein-coding and noncoding RNA genes. We focused on a specific set of microRNA genes and showed that their upregulation was inversely correlated with the expression of CLL-specific survival, transcription factor, and signaling genes. Our findings identify that the transcriptional activator and repressor functions of HDACs cooperate within the same tumor to establish the transcriptional dependencies essential for survival in CLL.
Introduction
Patients with chronic lymphocytic leukemia (CLL) express a common transcriptional signature exemplified by high de novo expression of the B-cell receptor (BCR) pathway kinases, BTK and BLK,1,2 the antiapoptotic protein, BCL2,3 the chemokine receptor CXCR4 that drives T-cell defects,4 and silencing of microRNA such as miR15a-16.5,6 The importance of these proteins for CLL survival was validated in clinical trials where BTK and BCL2 inhibitors produced durable responses in chemo-naïve and relapsed patients to become the standard of care in CLL.7-11 Despite the dependence of CLL on a deregulated transcriptome for survival, the regulatory mechanisms that establish these cancer-specific transcriptional dependencies are poorly elucidated.
The histone deacetylases HDAC1 and HDAC2 form the catalytic core of numerous regulatory complexes.12,13 In CLL, high HDAC activity is linked to inferior survival.14 We demonstrated that HDAC1 and HDAC2 drive the silencing of several microRNA genes (miRs) (miR-210, miR15-a, miR16, and miR-29), resulting in the reciprocal overexpression of CLL survival genes.1,13 Paradoxically, high levels of HDAC1 become bound at super-enhancers (SEs) in proliferating solid tumor cell lines to facilitate transcription.15,16 SEs are regulatory elements marked by acetylated histones (H3K27Ac) that promote oncogenic transcription to which cancer cells become addicted.17 HDAC inhibition in these lines disrupted enhancer activity to decrease enhancer-driven transcription.15,16 However, the recruitment of HDACs to SEs and the dependence of SE-driven oncogenic transcription on HDACs in quiescent tumors such as CLL is unknown.
To understand the role of HDACs in regulating the CLL transcriptome, we conducted chromatin immunoprecipitation (ChIP) and integrated the genome-wide recruitment of HDAC1, with BRD4, H3K27Ac, H3K9Ac, chromatin accessibility signatures, Pol2 occupancy, and target expression signatures. HDAC1 was recruited to a small number of enhancers that overlap with BRD4 and are linked to the overexpression of a select set of genes important to survival, BCR signaling, and immune dysfunction. HDAC inhibition at these loci decreased BRD4 loads at enhancers and reduced RNA Pol2 occupancy to selectively halt the expression of B-cell–specific transcription factors, immune regulators, survival, and signaling proteins, thereby establishing that HDAC1 functioned as a transcriptional activator of driver genes in CLL. Concurrently, HDAC1 was also widely recruited to target genes without BRD4 or enhancer marks. HDAC inhibition largely induced expression at these loci. Within this group, we focused on a select group of microRNAs that became upregulated to reciprocally target the expression of critical B-cell drivers, such as IKZF3, BCL2, BTK, and SYK. Thus, we demonstrate that HDAC inhibition abolishes both the transcriptional activator and repressor functions of the HDACs to disrupt transcriptional dependencies in CLL tumor cells.
Methods
Primary samples
Peripheral blood samples from patients with CLL were collected under an institutional review board–approved protocol at the Ohio State University. The study was performed according to the Declaration of Helsinki. CLL cells with >90% CD5/CD19 positivity or those enriched for CD19/CD5 using the Easy Sep Human B cell Enrichment Kit (StemCell Technologies Inc, Cat # 17963) (antibodies: BV421 mouse anti-human CD5, #562646 and HIB19 APC mouse anti-human CD19, #555415, both from BD Pharmingen) were used. Gender, age of diagnosis, and relevant genetic/immunophenotypic features of each sample are included in supplemental Table 1. Normal B-cell samples were purified from discarded material from healthy adults through the Red Cross. Peripheral blood mononuclear cells were purified using a Ficoll density gradient, and B cells were enriched using the Easy Sep Human B cell Enrichment Kit (StemCell Technologies Inc, Cat # 17963) according to the manufacturer’s instructions.
Cell culture and drug treatment
RPMI-1640 medium supplemented with 100U/mL penicillin, 100μg/mL streptomycin, and 10% fetal bovine serum was used for CLL cell cultures. Cells resuspended in 10% fetal bovine serum RPMI-1640 media were exposed to dimethyl sulfoxide (DMSO) or 0.4 μM Abexinostat (Selleckchem, Houston, TX) and used for downstream analysis.
ChIP and assay for transposase-accessible chromatin seq
Cells were treated with vehicle (DMSO) or with abexinostat (0.4 μM) for 6 hours before being harvested, fixed with 1% formaldehyde for 15 minutes, and quenched with 0.125 M glycine. Chromatin (15 μg) was immunoprecipitated per sample using antibodies against HDAC1 (Active Motif # 40967), BRD4 (Active Motif # 91301, 4 μL), H3K9Ac (Active Motif # 39917), H3K27Ac (Active Motif # 39133), and RNA Pol II (Active Motif # 91151) (supplemental Table 14) (Key resources). DNA was purified, and Illumina sequencing libraries were prepared as described.18
For ATAC seq, 105 cells were incubated in the transposase reaction mix (12.5 μL 2 × TD buffer, 2 μL transposase (Illumina), and 10.5 μL nuclease-free water) for 30 minutes at 37°C. After DNA purification with the MinElute kit, 1 μL of the eluted DNA was used to prepare libraries using custom Nextera primers as described.
RNA seq
RNA was isolated with Qiagen RNeasy columns according to the manufacturer’s protocol and 1000 ng of RNA were used to prepare a sequencing library for each sample using a Stranded RNA-seq kit with Ribo-Erase (KAPA Biosystems) (supplemental Table 14) (Key resources). Libraries were sequenced on a HiSeq4000, generating 100-bp reads.
Immunoblots
Freshly isolated cells from patients with CLL treated with abexinostat or DMSO were collected and analyzed by sodium dodecyl sulfate polyacrylamide gel electrophoresis (SDS-PAGE). Blots were probed with primary antibodies described in supplemental Table 14 (Key resources) and Alexa Flour TRDye800 or AlexaFlour 700 conjugated secondary antibodies (Thermo Fisher Scientific, Waltham, MA), and then visualized using the LI-COR Odyssey CLx imaging system.
Real-time polymerase chain reaction (RT-PCR)
CLL cells were treated with DMSO or abexinostat ibrutinib for 24 hours before RNA purification via the RNeasy isolation kit (Qiagen, Hilden, Germany). Lysates were analyzed for mRNA expression via RT-PCR for each transcript described in the Gene expression section of Key Resources, supplemental Table 14 (Key resources).
Pharmacodynamic animal studies
C57BL/6 mice were engrafted with spleen lymphocytes derived from an Eμ-TCL1 (TCL1) transgenic mouse. Mice were observed for leukemia development (defined as ≥10% CD5+/CD19+ cells in the leukocyte population) and were randomly assigned to control (50 mmol/L sodium lactate [pH 4.2]) or abexinostat (50 mg/kg for 3 days of each week via tail vein injection) groups and euthanized at 2 weeks for RNA seq and small RNA seq (n = 3).
Statistical analysis
All analyses were performed using SAS/STAT software, version 9.2 (SAS Institute, Inc, Cary, NC). Spearman correlation coefficient between miRNA and mRNA data and their statistical significance was calculated by applying the R stats (v3.6.3) and ggpubr (v0.2) packages. Student t test was used to analyze the difference and calculate the P value of transcripts in normal B cells vs CLL cells and CLL cells vs abexinostat-treated cells.
Results
The composition of the HDAC1-containing chromatin in CLL
Because we previously showed that HDAC1 formed a complex with HDAC2 at gene targets in CLL,1,13 we selected HDAC1 (as a representative HDAC found within transcriptional complexes) for further investigation. We quantitated the expression of HDAC1 and BRD4 (Figure 1A-B) and showed that HDAC1 and BRD4 were overexpressed in CLL cells (patient characteristics listed in supplemental Table 1) compared with CD19+ B cells from healthy subjects. Next, we conducted ChIP linked to deep sequencing to generate the recruitment profiles of HDAC1, BRD4, H3K27Ac, and H3K9Ac across the CLL genome of CLL B cells from 3 patients (CLL251275, CLL251776, and CLL251228) and integrated it with functional measures of transcription such as chromatin accessibility signatures, RNA Pol2 recruitment, and gene expression profiles across all HDAC1-bound gene targets. Clustering of the recruitment patterns for the above proteins identified 3 dominant regulatory signatures. Cluster I consisted of extensive and high levels of HDAC1 at loci that also displayed high levels of H3K27Ac and BRD4. These loci contrarily retained high levels of acetylated H3K9, a HDAC deacetylation target, highly accessible chromatin, and robust RNA Pol2 recruitment (Figure 1C). A Venn diagram common to all 3 primary CLL samples that intersected the recruitment of HDAC1 with BRD4, H3K9Ac, H3K27Ac, and RNA Pol2 identified 4799 peaks close to the transcriptional start sites (TSS) of 4192 protein-coding genes (PCG) and 123 microRNA genes (Figure 1D-E; supplemental Table 2). Cluster II consisted of HDAC1 bound at target loci in the absence of BRD4 and H3K27Ac. They displayed H3K9Ac marks, fewer hyperaccessible chromatin loci, and lower RNA Pol2 recruitment (Figure 1C) at 5909 peaks near the TSS of 4934 PCG and 164 microRNA genes (Figure 1D-E; supplemental Table 2). Cluster III comprised HDAC1 bound at targets in the absence of BRD4 or H3K27Ac, with little or no H3K9Ac, and without discernable open chromatin signatures or RNA Pol2 (Figure 1C) associated at 4626 peaks near the TSS of 927 PCG and 49 microRNA genes (Figure 1D-E; supplemental Table 2).

The functional chromatin landscape of CLL as defined by HDAC1 recruitment. (A) Comparison of HDAC1 and BRD4 levels in whole cell lysates of CLL (n = 8; CLL 1-8 = CLL251228, CLL250401, CLL251776, CLL250063, CLL250112, CLL250383, CLL250384, CLL250746) and independent healthy CD19+ selected B cells (n = 4). Cell lysates were sequentially probed for HDAC1, BRD4, and GAPDH on the same immunoblot. (B) Quantitation of HDAC1 and BRD4 in CLL (n = 16, CLL251228(U, 11q-/13q-), CLL250401(U, 11q-/13q-/17p-), CLL251776(Un, 11q-/13q-/17p-), CLL250063(Un, 13q-), CLL250112(Un, NK), CLL250383(Un, 11q-), CLL250384(U, 11q-), CLL250746(Un, NK), CLL251124(U, 13q-), CLL250776, CLL251275(U, 11q-/13q-), CLL250028 (M, 11q-/13q-), CLL250109(M, 13q-), CLL250146(M, 13q-), CLL250943(U, NK), CLL251456(M, NK)) and healthy CD19+ B-cell samples (n = 8). Expression of HDAC1 and BRD4 in healthy B cells and CLL cells were normalized to GAPDH (used as a loading control) and the statistical significance derived using Student two-tailed t tests; ∗P < .5, ∗∗∗P < .001, Graph pad software. (C) ChIP-seq densities ranked in decreasing order for the genome-wide combined occupancy signals of HDAC1 with BRD4, H3K9Ac, H3K27Ac, open ATAC signatures, and RNA Pol2 engagement (cluster I), HDAC1 corecruited with H3K9Ac, ATAC, and RNA Pol2 (cluster II), and HDAC alone (cluster III) centered ±5 kb of the TSS window in 3 CLL samples (CLL251288, CLL251766, and CLL251275). (D) Venn diagram showing the intersection of HDAC1 with BRD4, H3K9Ac, H3K27Ac, and RNA Pol2 recruitment common to 3 primary CLL samples; cluster I (HDAC-BRD4-H3K9Ac-H3K27Ac-ATAC-RNA Pol2) comprises 4799 (in red) peaks with robust HDAC-BRD4-H3K9Ac-H3K27Ac-ATAC-RNA Pol2 tag densities close to the TSS of 5122 total genes, of which 4192 were PCG and 123 were microRNA genes, cluster II (HDAC1-H3K9Ac-Pol2) comprises 5909 peaks (in blue) peaks with robust HDAC1-H3K9Ac-ATAC- Pol2 tag densities close to the TSS of total 5676 genes, of which 4934 were PCG and 164 microRNA genes, and cluster III (HDAC-low/no H3K9Ac-no Pol2) comprises 4626 peaks (in purple) with discrete HDAC1 tag densities with low or no H3K9Ac and minimal Pol2 tag densities close to the TSS of 1077 total genes, of which 927 were PCG and 49 were microRNA genes. (E) Transcriptional output of genes within the HDAC1-containing chromatin. Cluster I accounted for 25% of the CLL transcriptome with 2724 high expressors, 1625 medium expressors, and 773 low expressors. Cluster II accounted for 29% of the CLL transcriptome with 2165 high expressors, 2421 medium expressors, and 1090 low expressors. Cluster III accounted for 6% of the CLL transcriptome with 154 high expressors, 373 medium expressors, and 550 low expressors. In addition, there were 646 high expressors, 1270 medium expressors, and 3277 low expressors not marked by any of the regulatory chromatin modifiers in our study. Analysis of variance was used to compare values between high, medium, and low expressers in clusters I to III and in the group with none of the marks evaluated in our study; ∗∗∗∗P < .0001. 11q-, del11q, 13q-, del13q; 17p-, del17p; GAPDH, glyceraldehyde-3-phosphate dehydrogenase; M, IgVH mutated; NK, normal karyotype; U, IgVH unmutated; Un, unknown.
The functional chromatin landscape of CLL as defined by HDAC1 recruitment. (A) Comparison of HDAC1 and BRD4 levels in whole cell lysates of CLL (n = 8; CLL 1-8 = CLL251228, CLL250401, CLL251776, CLL250063, CLL250112, CLL250383, CLL250384, CLL250746) and independent healthy CD19+ selected B cells (n = 4). Cell lysates were sequentially probed for HDAC1, BRD4, and GAPDH on the same immunoblot. (B) Quantitation of HDAC1 and BRD4 in CLL (n = 16, CLL251228(U, 11q-/13q-), CLL250401(U, 11q-/13q-/17p-), CLL251776(Un, 11q-/13q-/17p-), CLL250063(Un, 13q-), CLL250112(Un, NK), CLL250383(Un, 11q-), CLL250384(U, 11q-), CLL250746(Un, NK), CLL251124(U, 13q-), CLL250776, CLL251275(U, 11q-/13q-), CLL250028 (M, 11q-/13q-), CLL250109(M, 13q-), CLL250146(M, 13q-), CLL250943(U, NK), CLL251456(M, NK)) and healthy CD19+ B-cell samples (n = 8). Expression of HDAC1 and BRD4 in healthy B cells and CLL cells were normalized to GAPDH (used as a loading control) and the statistical significance derived using Student two-tailed t tests; ∗P < .5, ∗∗∗P < .001, Graph pad software. (C) ChIP-seq densities ranked in decreasing order for the genome-wide combined occupancy signals of HDAC1 with BRD4, H3K9Ac, H3K27Ac, open ATAC signatures, and RNA Pol2 engagement (cluster I), HDAC1 corecruited with H3K9Ac, ATAC, and RNA Pol2 (cluster II), and HDAC alone (cluster III) centered ±5 kb of the TSS window in 3 CLL samples (CLL251288, CLL251766, and CLL251275). (D) Venn diagram showing the intersection of HDAC1 with BRD4, H3K9Ac, H3K27Ac, and RNA Pol2 recruitment common to 3 primary CLL samples; cluster I (HDAC-BRD4-H3K9Ac-H3K27Ac-ATAC-RNA Pol2) comprises 4799 (in red) peaks with robust HDAC-BRD4-H3K9Ac-H3K27Ac-ATAC-RNA Pol2 tag densities close to the TSS of 5122 total genes, of which 4192 were PCG and 123 were microRNA genes, cluster II (HDAC1-H3K9Ac-Pol2) comprises 5909 peaks (in blue) peaks with robust HDAC1-H3K9Ac-ATAC- Pol2 tag densities close to the TSS of total 5676 genes, of which 4934 were PCG and 164 microRNA genes, and cluster III (HDAC-low/no H3K9Ac-no Pol2) comprises 4626 peaks (in purple) with discrete HDAC1 tag densities with low or no H3K9Ac and minimal Pol2 tag densities close to the TSS of 1077 total genes, of which 927 were PCG and 49 were microRNA genes. (E) Transcriptional output of genes within the HDAC1-containing chromatin. Cluster I accounted for 25% of the CLL transcriptome with 2724 high expressors, 1625 medium expressors, and 773 low expressors. Cluster II accounted for 29% of the CLL transcriptome with 2165 high expressors, 2421 medium expressors, and 1090 low expressors. Cluster III accounted for 6% of the CLL transcriptome with 154 high expressors, 373 medium expressors, and 550 low expressors. In addition, there were 646 high expressors, 1270 medium expressors, and 3277 low expressors not marked by any of the regulatory chromatin modifiers in our study. Analysis of variance was used to compare values between high, medium, and low expressers in clusters I to III and in the group with none of the marks evaluated in our study; ∗∗∗∗P < .0001. 11q-, del11q, 13q-, del13q; 17p-, del17p; GAPDH, glyceraldehyde-3-phosphate dehydrogenase; M, IgVH mutated; NK, normal karyotype; U, IgVH unmutated; Un, unknown.
When we related the HDAC1-containing chromatin composition to transcriptional output, we found that cluster I accounted for 25% of the CLL transcriptome, of which the largest fraction represented highly expressed transcripts (63%-2724) and 37% showed moderate (1625) or low expression (773) (Figure 1E). Cluster II accounted for 29% of the CLL transcriptome, of which 42% (2166) of transcripts had robust and 58% had moderate (2421) or low expression (1090) (Figure 1E). Cluster III accounted for 6% of the CLL transcriptome, of which 16% (154) of transcripts had robust and 84% had moderate (373) or low expression (550) (Figure 1E). In addition, transcripts not associated with any of these regulatory marks were also expressed (646 with high, 1270 with moderate, and 3277 with low levels of expression).
The HDAC1-containing regulatory chromatin marks transcriptionally active or inactive genes in CLL
We quantitated transcriptionally active enhancers by determining the enrichment of H3K27Ac across the CLL genome, and identified 11 745 (CLL251228), 13 762 (CLL251766), and 14 293 (CLL251275) peaks in 3 CLL samples. We then found that BRD4 overlapped H3K27Ac marks at 9213 (CLL251228), 7973 (CLL251776), and 4814 (CLL251275) peaks, indicating that 95%, 96%, and 91% of BRD4 was contained within H3K27Ac-marked enhancer regions (supplemental Figure 1). As described before,17,18 a small number of H3K27Ac enhancers, approximately 3% - 382 (CLL251228), 312 (CLL251776), and 245 (CLL251275) out of a total of 11 745 (CLL251228), 13 762 (CLL251766), and 14 293 (CLL251275), carried broader and higher BRD4 loads and were defined as SE.17,18
Surprisingly, most of the BRD4 dense SEs also recruited extensive and dense loads of HDAC1 with an 88% (335/382-CLL251228), 91% (284/312-CLL251776), and 88% (215/245-CLL251275) overlap between HDAC1 and BRD4 to SEs (Figure 2A- in red; supplemental Table 3) in the 3 CLL samples evaluated. Rank ordering of super-enhancers with dense HDAC1 and BRD4 loads identified a common set of enhancers shared by all 3 CLL samples (supplemental Table 4) and included genes critical to the pathology of CLL such as those that favored immune dysfunction (CXCR4 and IL4R), survival proteins such as BCL2, core transcription factors in CLL such as PAX5 and IKZF3, and B-cell signaling pathway kinases such as BLK among the top enhancers (Figure 2B).

HDAC1 is recruited at BRD4 dense enhancers in CLL. (A) BRD4 and H3K27Ac tag intensity and signal was used to quantitate the association of BRD4 at enhancers (SEs and TEs) and shows that 382 (CLL251228), 312 (CLL2501776), and 245 (CLL250275) genes were loaded with BRD4-dense marks at SEs. HDAC tag intensity and signal determine was used to determine the association of HDAC1 at BRD-linked enhancers and shows that HDAC was strongly recruited at 335 (88%) (CLL251228), 284 (91%) (CLL2501776), and 215 (88%) (CLL250275) (in red) of the BRD4-dense SEs. Similarly, HDAC1 was corecruited at 3423 (71% - CLL250228), 4096 (51% - CLL250776), and 4110 (42% - CLL 250275) (in blue) out of a total of 4775 (CLL251228), 7970 (CLL251776), and 9772 (CLL251275) genes that had BRD4 associated with TEs. (B) ROSE analysis was performed using the BRD4 load and intensity at H3K27Ac-marked enhancers. The plots represent the top BRD4 loaded enhancers that also recruited dense HDAC loads in 3 representative CLL samples. HDAC1-bound, BRD4-dense SEs (marked in red) are listed in decreasing order of enhancer rank. Selected genes bound by HDACs with BRD4 at TEs are marked in blue. SE and TE identification for all samples are listed in supplemental Table 4. (C) TOPPGene Suite was used to derive functional annotations of the top biological processes associated with HDAC1 bound at BRD-SEs. Top 25 pathways (based on z-scores) associated with the genes are shown and color coded based on specificity from orange to blue, whereas the size reflects the number of genes that make up the category. (D) Overlay of HDAC1, BRD4, H3K9Ac, H3K27Ac, ATAC-seq profiles, and RNA Pol II densities at selected top genes from CLL251228 showing HDAC1 loads at BRD4 dense SEs in cluster I (i-vi) CXCR4, IL4R, BCL2, IKZF3, PAX5, and BLK from CLL251228. Each track is representative of the ChIP-seq binding densities for specified genes from 3 independent samples from patients with CLL (CLL251228, CLL251776, and CLL251275). The x-axis of each track shows genomic position, and the y-axis shows the intensity of the ChIP signal (rpm/bp). ROSE, rank ordering of super-enhancers.
HDAC1 is recruited at BRD4 dense enhancers in CLL. (A) BRD4 and H3K27Ac tag intensity and signal was used to quantitate the association of BRD4 at enhancers (SEs and TEs) and shows that 382 (CLL251228), 312 (CLL2501776), and 245 (CLL250275) genes were loaded with BRD4-dense marks at SEs. HDAC tag intensity and signal determine was used to determine the association of HDAC1 at BRD-linked enhancers and shows that HDAC was strongly recruited at 335 (88%) (CLL251228), 284 (91%) (CLL2501776), and 215 (88%) (CLL250275) (in red) of the BRD4-dense SEs. Similarly, HDAC1 was corecruited at 3423 (71% - CLL250228), 4096 (51% - CLL250776), and 4110 (42% - CLL 250275) (in blue) out of a total of 4775 (CLL251228), 7970 (CLL251776), and 9772 (CLL251275) genes that had BRD4 associated with TEs. (B) ROSE analysis was performed using the BRD4 load and intensity at H3K27Ac-marked enhancers. The plots represent the top BRD4 loaded enhancers that also recruited dense HDAC loads in 3 representative CLL samples. HDAC1-bound, BRD4-dense SEs (marked in red) are listed in decreasing order of enhancer rank. Selected genes bound by HDACs with BRD4 at TEs are marked in blue. SE and TE identification for all samples are listed in supplemental Table 4. (C) TOPPGene Suite was used to derive functional annotations of the top biological processes associated with HDAC1 bound at BRD-SEs. Top 25 pathways (based on z-scores) associated with the genes are shown and color coded based on specificity from orange to blue, whereas the size reflects the number of genes that make up the category. (D) Overlay of HDAC1, BRD4, H3K9Ac, H3K27Ac, ATAC-seq profiles, and RNA Pol II densities at selected top genes from CLL251228 showing HDAC1 loads at BRD4 dense SEs in cluster I (i-vi) CXCR4, IL4R, BCL2, IKZF3, PAX5, and BLK from CLL251228. Each track is representative of the ChIP-seq binding densities for specified genes from 3 independent samples from patients with CLL (CLL251228, CLL251776, and CLL251275). The x-axis of each track shows genomic position, and the y-axis shows the intensity of the ChIP signal (rpm/bp). ROSE, rank ordering of super-enhancers.
In parallel, HDAC1 overlapped BRD4 at approximately 55% (3423 of 4775 [72%, CLL251228], 4096 of 7970 [51%, CLL251776], and 4110 of 9772 [42%, CLL251275]) of typical enhancers (TEs) (Figure 2A - in black; supplemental Table 3). The B-cell signaling kinases, BTK, SYK, ROR1 and oncogenic or immune targets such as miR-155 and CD27 were among the top CLL-relevant genes that bound HDAC1 to TEs in all 3 samples (Figure 2B). Comprehensive functional annotation of the top genes in cluster I (that represented HDAC1-dense loci bound to BRD4-containing TEs and SEs) identified B-cell activation, lymphocyte activation, and several immune pathways among the top biological processes (Figure 2C).
The binding profiles of select genes from cluster I bearing high loads of HDAC1 across BRD4-dense SEs (Figure 2Di-vi) or across TEs (supplemental Figure 2Ai-v) are shown. These genes were expressed at levels equal to or higher than those found in healthy CD19+ B cells as assayed by real-time gene expression assays (Figure 3Ai-viii and supplemental Figure 2B) and at the protein level by immunoblots (Figure 3B). These findings elucidate the composition of the regulatory chromatin at SEs beyond BRD4 to identify that HDAC1 is a key component bound within SEs and TEs that close a key set of robustly expressed target genes critical to the pathobiology of CLL.
HDAC1 recruited within H3K27Ac enhancers facilitates target gene expression but in the absence of H3K27Ac enhancers represses target gene expression. (A) mRNA expression levels of the genes whose regulatory chromatin-binding tracks were shown in Figure 2D and supplemental Figure 3; cluster I ([i-viii]-PAX5, IKZF3, BLK, BCL2, ROR1, SYK, miR-155, CD27), cluster II ([ix-x] ID1, miR-210HG), and cluster III [(xi-xiv]-miR-182 to 183 -96 cluster and miR9-3) in 33 CLL samples compared with 11 to 15 heathy B-cell samples except ID1 (CLL = 10, B cells = 7). ∗, ∗∗, ∗∗∗, ∗∗∗∗P < .5, .01, .001, .0001, Student t test, Graph pad software. (B) Protein expression levels of genes evaluated in panel A in 8 CLL samples compared with healthy B cells. (C) Sequence tag intensities obtained after ChIP analysis of HDAC1, BRD4, H3K9Ac, H3K27Ac, ATAC-seq profiles, and RNA Pol2 were visualized on a genome browser and overlaid at selected genes showing the corecruitment of HDAC with H3K9Ac showing open chromatin signatures (ATAC) and some RNA Pol2 recruitment in cluster II (HDAC1 + H3K0Ac + Pol2), ID1, mir-210HG). The x-axis of each track shows genomic position, and the y-axis shows the intensity of the ChIP signal (rpm/bp). (D) Sequence tag intensities obtained after ChIP analysis of HDAC1, BRD4, H3K9Ac, H3K27Ac, ATAC-seq profiles, and RNA Pol2 densities were visualized on a genome browser and show the recruitment HDAC1 with low H3K9Ac, no open chromatin signatures (ATAC) and minimal RNA Pol2 recruitment at selected genes in cluster III (HDAC1 low/no H3K9Ac), (miR-182-183-96, miR9-3). The x-axis of each track shows genomic position, and the y-axis shows the intensity of the ChIP signal (rpm/bp).

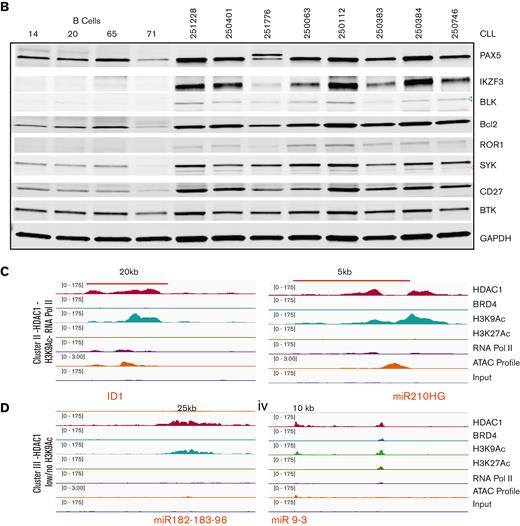
HDAC1 was also widely recruited at loci in the absence of BRD4 or H3K27Ac. Cluster II showed that the recruitment of HDAC1 to these loci was linked to lower open chromatin signatures and little recruitment of RNA Pol2 compared with the genes from cluster I, despite the presence of H3K9Ac as shown for 2 representative genes, miR-210HG and ID1 (Figure 3C). Expression analysis by RT-PCR showed that both miR-210 and ID1 were expressed at lower levels in CLL cells compared with CD19+ normal B cells (Figure 3Aix-x). Finally, HDAC1 was also recruited to genes without BRD4 or H3K27Ac (cluster III), which displayed low or no H3K9Ac, closed chromatin signatures, and an absence of Pol2 recruitment. The binding profiles of the miR-182 cluster (miR-182, mir-183, and miR-96) and miR9-3 from cluster III (Figure 3D) are shown. Expression analysis by RT-PCR showed that miR-182, miR-183, miR-96, and miR-9-3 were expressed at significantly lower levels in CLL cells compared with healthy B cells (Figure 3Axi-xiv).
Consequences of HDAC inhibition on the regulatory epigenome in CLL
High levels of HDAC at key loci across the genome may uncover a selective transcriptional vulnerability that can be exploited. To identify genes directly regulated by HDACs, we conducted RNA seq in 10 CLL samples exposed to 0.4 μM abexinostat, an HDAC inhibitor that targets HDAC1 with greater potency than other HDACs,19 for 24 hours. Overall, a small set of transcripts (421 and 758 - cluster I, 151 and 1264 - cluster II and 33 and 475 - cluster III) became downregulated and upregulated (twofold or more with 10% false discovery rate [FDR]) after HDAC inhibition (Figure 4A; supplemental Table 5). Specifically, high expressors bound by HDAC1 within SEs or TEs from cluster I became downregulated, whereas high expressors from cluster II or III were unchanged (Figure 4A). In parallel, intermediate expressors from cluster II and III and all low expressors from cluster I to III became upregulated after HDAC inhibition (Figure 4A). Finally, all genes that lacked the marks evaluated in this study remained unchanged after HDAC inhibition (Figure 4A).

HDAC inhibition induces specific changes in the regulatory chromatin resulting in wide-spread changes in the transcriptome of CLL. (A) RNA seq was conducted in 10 CLL samples exposed to 0.4 μM abexinostat for 24 hours. Transcripts from cluster 1(HDAC1-BRD4-H3K27Ac-H3K9Ac-Pol2), cluster II (HDAC1-H3K9Ac-Pol2, or cluster III (HDAC only) or those with no marks were divided into high, intermediate, and low expressors. The y-axis shows the fold change (log2, with an FDR of 0.05) in counts of high-, medium-, and low-expressed transcripts after HDAC inhibition from cluster 1(HDAC1-BRD4-H3K27Ac-H3K9Ac-Pol2), cluster II (HDAC1-H3K9Ac-Pol2), or cluster III (HDAC only). Among high expressors, only genes from cluster I were downregulated, whereas intermediate expressors from cluster II and low expressors from cluster I to III were upregulated. Intermediate (∼20) and low expressors (∼55%) with no marks did not change expression after HDAC inhibition. (B) Expression of HDAC1 protein in 5 CLL samples after exposure to 0.4 μM abexinostat for 24 hours. GAPDH assayed as loading control. (C) The y-axis shows log2-fold changes in the occupancy of HDAC1, H3K9Ac, BRD4, H3K27Ac, and RNA Pol 2 near genes with high, intermediate, or low expression that became upregulated or downregulated twofold or more after HDAC inhibition. GAPDH, glyceraldehyde-3-phosphate dehydrogenase.
HDAC inhibition induces specific changes in the regulatory chromatin resulting in wide-spread changes in the transcriptome of CLL. (A) RNA seq was conducted in 10 CLL samples exposed to 0.4 μM abexinostat for 24 hours. Transcripts from cluster 1(HDAC1-BRD4-H3K27Ac-H3K9Ac-Pol2), cluster II (HDAC1-H3K9Ac-Pol2, or cluster III (HDAC only) or those with no marks were divided into high, intermediate, and low expressors. The y-axis shows the fold change (log2, with an FDR of 0.05) in counts of high-, medium-, and low-expressed transcripts after HDAC inhibition from cluster 1(HDAC1-BRD4-H3K27Ac-H3K9Ac-Pol2), cluster II (HDAC1-H3K9Ac-Pol2), or cluster III (HDAC only). Among high expressors, only genes from cluster I were downregulated, whereas intermediate expressors from cluster II and low expressors from cluster I to III were upregulated. Intermediate (∼20) and low expressors (∼55%) with no marks did not change expression after HDAC inhibition. (B) Expression of HDAC1 protein in 5 CLL samples after exposure to 0.4 μM abexinostat for 24 hours. GAPDH assayed as loading control. (C) The y-axis shows log2-fold changes in the occupancy of HDAC1, H3K9Ac, BRD4, H3K27Ac, and RNA Pol 2 near genes with high, intermediate, or low expression that became upregulated or downregulated twofold or more after HDAC inhibition. GAPDH, glyceraldehyde-3-phosphate dehydrogenase.
To relate changes in target gene expression with changes in the regulatory epigenome, we exposed the same CLL samples to 0.4 μM abexinostat for 6 hours before conducting ChIP-seq for HDAC1, BRD4, H3K9Ac, H3K27Ac, and RNAPol2 along with open chromatin profiling. HDAC inhibition did not decrease the levels of HDAC1 protein for up to 24 hours of exposure to abexinostat (Figure 4B), but decreased HDAC1 occupancy within 6 hours compared with the levels at pretreatment (set at 0) at all genes that were downregulated regardless of their level of expression at baseline. A decrease in HDAC1 was paralleled by decreases in H3K9Ac occupancy, moderate decreases in BRD4, and loss of Pol2 occupancy, whereas H3K27Ac decreased minimally at downregulated genes.
HDAC1 occupancy decreased to a lesser extent at genes that were upregulated. This resulted in increased H3K27Ac but not H3K9Ac occupancy at all upregulated genes. BRD4 levels were modestly increased or maintained at upregulated genes, and Pol2 demonstrated a clear increase in occupancy at all genes that were upregulated after HDAC inhibition (Figure 4C).
Genes bound by HDAC1 at SEs undergo extensive transcriptional changes in CLL driver genes with variable disruption of SEs after HDAC inhibition
Next, we focused on PCG near loci with dense HDAC1 and BRD4 loads to SEs in cluster I. HDAC inhibition resulted in the differential expression of a small set of genes (621), of which 329 (54%) decreased and 292 (47%) genes increased expression. Significantly, the genes downregulated after HDAC inhibition included key driver genes and CLL core transcription factors such as BCL2, IKZF3, PAX5, and BLK, as well as genes bearing HDAC at TEs such as ROR1, SYK, miR-155, CD27, and BTK (Figure 5A). We show that the decrease in occupancy of HDAC1, BRD4, H3K9Ac, and Pol2 at selected genes is accompanied by variable decreases in enhancer occupancy (H3K27Ac) but no reduction in chromatin accessibility (Figure 5Bi-vi and supplemental Figure 3i-v).

HDAC inhibition causes dynamic changes in the occupancy of HDAC1, H3K9Ac, BRD4, and RNA Pol2 engagement to downregulate driver genes in cluster I. (A) Gene expression heat map obtained after total RNA seq of 10 CLL samples treated with the HDAC inhibitor abexinostat (0.4 μM, 24 hours) compared with untreated controls. 621 differentially expressed PCG that showed an absolute fold change of 2 or more at 10% FDR, of which 329 (54%) decreased and 292 (47%) genes increased expression. Key CLL driver genes, such as IKZF3, CD27, SYK, BTK, mir-155, IKZF1, BLK, PAX5, and ROR1, were among the downregulated transcripts. (B) Genome browser tracks showing the change in HDAC1 (red), BRD4 (turquoise), H3K9Ac (green), H3K27Ac (olive), RNA Pol II (violet), ATAC seq peaks (brown) in a representative CLL sample out of 3 at baseline and after exposure to 0.4 μM abexinostat for 6 hours, HDAC1 (yellow), BRD4 (blue), H3K9Ac (mint), H3K27Ac (green), RNA Pol II (mauve), and ATAC seq peaks (orange) are shown for select genes such as CXCR4, IL4R, BCL2, IKZF3, PAX5, and BLK. The x-axis of each track shows genomic position, and the y-axis shows the intensity of the ChIP signal (rpm/bp).
HDAC inhibition causes dynamic changes in the occupancy of HDAC1, H3K9Ac, BRD4, and RNA Pol2 engagement to downregulate driver genes in cluster I. (A) Gene expression heat map obtained after total RNA seq of 10 CLL samples treated with the HDAC inhibitor abexinostat (0.4 μM, 24 hours) compared with untreated controls. 621 differentially expressed PCG that showed an absolute fold change of 2 or more at 10% FDR, of which 329 (54%) decreased and 292 (47%) genes increased expression. Key CLL driver genes, such as IKZF3, CD27, SYK, BTK, mir-155, IKZF1, BLK, PAX5, and ROR1, were among the downregulated transcripts. (B) Genome browser tracks showing the change in HDAC1 (red), BRD4 (turquoise), H3K9Ac (green), H3K27Ac (olive), RNA Pol II (violet), ATAC seq peaks (brown) in a representative CLL sample out of 3 at baseline and after exposure to 0.4 μM abexinostat for 6 hours, HDAC1 (yellow), BRD4 (blue), H3K9Ac (mint), H3K27Ac (green), RNA Pol II (mauve), and ATAC seq peaks (orange) are shown for select genes such as CXCR4, IL4R, BCL2, IKZF3, PAX5, and BLK. The x-axis of each track shows genomic position, and the y-axis shows the intensity of the ChIP signal (rpm/bp).
We also show a significant reduction in RNA Pol2 occupancy at the proximal promoter compared with the gene body for several driver genes, including BCL2, BLK, PAX5, IKZF3, miR155, and ROR1 but not BTK or SYK (Figure 6Ai-viii). Correspondingly, real-time expression assays confirmed the declines in the expression of BCL2, BLK, PAX5, IKZF3, BTK, miR155, ROR, SYK, CD27 (Figure 6Bi-ix), IL4R, and CXCR4 (supplemental Figure 4A) in all 10 CLL samples exposed to 0.4 μM abexinostat for 24 hours. Loss in transcript levels was mirrored by decreases in the levels of the cognate proteins when measured after exposure to 0.4 μM abexinostat for 24 hours, where proteins such as PAX5, BTK, and IKZF3 were exquisitely sensitive to HDAC inhibition and showed the steepest declines in protein levels (Figure 6C and supplemental Figure 4B), and others such as BCL2 and SYK showed variable decreases at 24 hours.
![Inhibition of RNA Pol2 engagement, transcript, and protein expression of driver genes in cluster I after HDAC inhibition. (A) Effect of HDAC inhibition on RNA Pol II occupancy at promoters. RNA Pol II ChIP-seq gene profiles showing changes in log2 read counts per million (log2 CPM) for RNA Pol II occupancy from −5 to -1kb of the PP centered around the TSS to +3 to +6 KB of the GB at BCL2, BLK, PAX5, IKZF3, miR-155, BTK, ROR1, and SYK in 1 of 3 representative CLL samples (CLL251228) before (blue) and after exposure to 0.4 μM abexinostat for 24 hours (red). (B) Validation of RNA seq results using RT-PCR expression assays quantitating changes in expression levels of selected genes from cluster I ([i-ix]-BCL2, BLK, PAX5, IKZF3, BTK, miR-155, ROR1, SYK, and CD27) from 10 CLL samples before and after exposure to abexinostat for 24 hours. ∗, ∗∗, ∗∗∗, ∗∗∗∗ P < .5, .01, .001, .0001, Student t test, Graph pad software. (C) Change in protein expression of select driver genes in 5 CLL samples before and after exposure to 0.4 μM, abexinostat for 24 hours. GB, gene body; PP, proximal promoter.](/view-large/figure/11743303/BLOODA_ADV-2022-007998-gr6.jpg)
Inhibition of RNA Pol2 engagement, transcript, and protein expression of driver genes in cluster I after HDAC inhibition. (A) Effect of HDAC inhibition on RNA Pol II occupancy at promoters. RNA Pol II ChIP-seq gene profiles showing changes in log2 read counts per million (log2 CPM) for RNA Pol II occupancy from −5 to -1kb of the PP centered around the TSS to +3 to +6 KB of the GB at BCL2, BLK, PAX5, IKZF3, miR-155, BTK, ROR1, and SYK in 1 of 3 representative CLL samples (CLL251228) before (blue) and after exposure to 0.4 μM abexinostat for 24 hours (red). (B) Validation of RNA seq results using RT-PCR expression assays quantitating changes in expression levels of selected genes from cluster I ([i-ix]-BCL2, BLK, PAX5, IKZF3, BTK, miR-155, ROR1, SYK, and CD27) from 10 CLL samples before and after exposure to abexinostat for 24 hours. ∗, ∗∗, ∗∗∗, ∗∗∗∗ P < .5, .01, .001, .0001, Student t test, Graph pad software. (C) Change in protein expression of select driver genes in 5 CLL samples before and after exposure to 0.4 μM, abexinostat for 24 hours. GB, gene body; PP, proximal promoter.
Inhibition of RNA Pol2 engagement, transcript, and protein expression of driver genes in cluster I after HDAC inhibition. (A) Effect of HDAC inhibition on RNA Pol II occupancy at promoters. RNA Pol II ChIP-seq gene profiles showing changes in log2 read counts per million (log2 CPM) for RNA Pol II occupancy from −5 to -1kb of the PP centered around the TSS to +3 to +6 KB of the GB at BCL2, BLK, PAX5, IKZF3, miR-155, BTK, ROR1, and SYK in 1 of 3 representative CLL samples (CLL251228) before (blue) and after exposure to 0.4 μM abexinostat for 24 hours (red). (B) Validation of RNA seq results using RT-PCR expression assays quantitating changes in expression levels of selected genes from cluster I ([i-ix]-BCL2, BLK, PAX5, IKZF3, BTK, miR-155, ROR1, SYK, and CD27) from 10 CLL samples before and after exposure to abexinostat for 24 hours. ∗, ∗∗, ∗∗∗, ∗∗∗∗ P < .5, .01, .001, .0001, Student t test, Graph pad software. (C) Change in protein expression of select driver genes in 5 CLL samples before and after exposure to 0.4 μM, abexinostat for 24 hours. GB, gene body; PP, proximal promoter.
Taken together, our results show that cluster I harbored multiple CLL-specific driver genes that were expressed at high levels, and HDAC inhibition decreased BRD4 loads at enhancers without completely disrupting SEs to trigger a decrease in RNA Pol2 recruitment at target genes and downregulate oncogenic and survival-promoting driver genes.
HDAC inhibition at genes bound by HDAC without associated SEs induces silenced genes
HDAC inhibition at PCG that recruited HDAC1 cobound with acetylated H3K9Ac and RNA Pol2 (cluster II) or bound alone (cluster III) resulted in the differential expression of 919 (126 decreased and 793 [86%] increased expression) and 438 (30 decreased and 438 [93%] increased expression) genes with a greater than twofold differential expression with a 10% FDR in cluster II (supplemental Figure 5A; supplemental Table 8) and cluster III (supplemental Figure 5B; supplemental Table 9). Although the major consequence of HDAC inhibition was to reverse expression silencing, functional analysis did not identify a key role in the pathobiology of CLL for most of the upregulated PCG in Cluster II or III, making us focus on the microRNA genes in these clusters.
Expression analysis of the microRNA genes altered in response to HDAC inhibition from clusters I to III identified 48 microRNA that were differentially expressed in all 10 CLL samples with a twofold increase (45 microRNAs) or decrease (3 microRNAs) at 10% FDR (Figure 7A; supplemental Tables 10,11). Of these, miR-1248 from cluster I, 6 from cluster II (miR-210, miR-95, miR-92b, miR-320d, miR-320d, miR-1224, and miR-1296), and 10 from cluster III (miR-182 cluster, miR-9, miR-1303, miR-126, miR-194, miR-449a, miR449c, and miR-566) represented the top microRNA genes. The miR-182 cluster, consisting of miR-182, miR-183, and miR-96, showed the highest induction (60-fold), whereas miR9-3, miR-210, and the others were induced fourfold or less.

HDAC inhibition increases Pol2 engagement and reverses silencing of a select set of microRNA genes from cluster II and III which are anticorrelated with the expression of key driver genes in CLL. (A) Volcano plots showing the differential expression of small RNA genes assayed by small RNA seq in 10 CLL samples before and after exposure to 0.4 μM, abexinostat for 24 hours. Of a total of 10 microRNA genes that were significantly upregulated (adjust P < .05 and log2 ratio > 1), 1 (miR-1248 in pink) belonged to cluster I, 5 (miR-210, miR-95, miR92b, miR-320d, miR-1296 in blue) to cluster II, and 4 (miR182-183-96 cluster, miR9-3 in red) to cluster III. One gene (miR-1303) from cluster III was downregulated (adjust P < .05 and log2 ratio < −1). (B) Genome browser tracks showing the change in HDAC1 (red), BRD4 (turquoise), H3K9Ac (green), H3K27Ac (olive), RNA Pol II (violet), and ATAC seq peaks (brown) in a representative CLL sample out of 3 at baseline and after exposure to 0.4 μM, abexinostat for 6 hours, HDAC1 (yellow), BRD4 (mint), H3K9Ac (light blue), H3K27Ac (light green), RNA Pol II (mauve), and ATAC seq peaks (orange) at miR-210 and miR-182 to 183 to 96 shown as a representative genes from cluster II that bound HDAC1 with H3K9Ac, open ATAC signatures, and RNA Pol2 and cluster III that bound HDAC1 alone. The x-axis of each track shows genomic position, and the y-axis shows the intensity of the ChIP signal (rpm/bp). (C) Effect of HDAC inhibition on RNA Pol II occupancy at promoters. Gene plots showing changes in log2 read counts per million (log2 CPM) for RNA Pol II occupancy from −5 to -1KBkb of the PP centered around the TSS to +3 to +6 KB of the GB at the miR-210 and miR-182 to 183 to 96 cluster before (blue) and after exposure to 0.4 μM abexinostat for 24 hours (red). (D) Expression levels of miR-210 from cluster II and miR-182 to 183 and 96 from cluster III in 10 CLL samples exposed to abexinostat for 24 hours. (E) The Pearson correlation between the top microRNA induced (miR-182, miR-183, and miR-96) in both primary CLL samples and CLL bearing Eμ-TCL1 mice were evaluated for negative correlation against their predicted target driver genes relevant to CLL (IKZF3, BTK, BCL2, and SYK). We show the Pearson scatter plots showing a negative correlation between miR-182, miR-183, and miR-96 and IKZF3 (P = .001 for miR-182, 0.004 for miR-183 and 0.004 for miR-96), BTK (P = .003 for miR-182, 0.01 for miR-183 and 0.003 for miR-96), BCL2 (P = .044 for miR-182, 0.048 for miR-183 and 0.06 for miR-96), and SYK (P = .013 for miR-182, 0.019 for miR-183 and 0.054 for miR-96). Rho values and slopes are shown. GB, gene body; PP, proximal promoter.
HDAC inhibition increases Pol2 engagement and reverses silencing of a select set of microRNA genes from cluster II and III which are anticorrelated with the expression of key driver genes in CLL. (A) Volcano plots showing the differential expression of small RNA genes assayed by small RNA seq in 10 CLL samples before and after exposure to 0.4 μM, abexinostat for 24 hours. Of a total of 10 microRNA genes that were significantly upregulated (adjust P < .05 and log2 ratio > 1), 1 (miR-1248 in pink) belonged to cluster I, 5 (miR-210, miR-95, miR92b, miR-320d, miR-1296 in blue) to cluster II, and 4 (miR182-183-96 cluster, miR9-3 in red) to cluster III. One gene (miR-1303) from cluster III was downregulated (adjust P < .05 and log2 ratio < −1). (B) Genome browser tracks showing the change in HDAC1 (red), BRD4 (turquoise), H3K9Ac (green), H3K27Ac (olive), RNA Pol II (violet), and ATAC seq peaks (brown) in a representative CLL sample out of 3 at baseline and after exposure to 0.4 μM, abexinostat for 6 hours, HDAC1 (yellow), BRD4 (mint), H3K9Ac (light blue), H3K27Ac (light green), RNA Pol II (mauve), and ATAC seq peaks (orange) at miR-210 and miR-182 to 183 to 96 shown as a representative genes from cluster II that bound HDAC1 with H3K9Ac, open ATAC signatures, and RNA Pol2 and cluster III that bound HDAC1 alone. The x-axis of each track shows genomic position, and the y-axis shows the intensity of the ChIP signal (rpm/bp). (C) Effect of HDAC inhibition on RNA Pol II occupancy at promoters. Gene plots showing changes in log2 read counts per million (log2 CPM) for RNA Pol II occupancy from −5 to -1KBkb of the PP centered around the TSS to +3 to +6 KB of the GB at the miR-210 and miR-182 to 183 to 96 cluster before (blue) and after exposure to 0.4 μM abexinostat for 24 hours (red). (D) Expression levels of miR-210 from cluster II and miR-182 to 183 and 96 from cluster III in 10 CLL samples exposed to abexinostat for 24 hours. (E) The Pearson correlation between the top microRNA induced (miR-182, miR-183, and miR-96) in both primary CLL samples and CLL bearing Eμ-TCL1 mice were evaluated for negative correlation against their predicted target driver genes relevant to CLL (IKZF3, BTK, BCL2, and SYK). We show the Pearson scatter plots showing a negative correlation between miR-182, miR-183, and miR-96 and IKZF3 (P = .001 for miR-182, 0.004 for miR-183 and 0.004 for miR-96), BTK (P = .003 for miR-182, 0.01 for miR-183 and 0.003 for miR-96), BCL2 (P = .044 for miR-182, 0.048 for miR-183 and 0.06 for miR-96), and SYK (P = .013 for miR-182, 0.019 for miR-183 and 0.054 for miR-96). Rho values and slopes are shown. GB, gene body; PP, proximal promoter.
Decreases in HDAC1 occupancy after HDAC inhibition were mirrored by increases in H3K9Ac, open ATAC signatures, and RNA Pol2 engagement (based on genome occupancy peaks as well as increases in RNA Pol2 engagement at the TSS for both miR-210HG and the miR-182 cluster (Figure 7B-C), shown as representative microRNA genes from cluster II and III. These changes were reflected in the upregulation of miR-210, miR-182, miR-183, and miR-96 in CLL samples exposed to abexinostat for 24 hours (Figure 7D). We have previously extensively established the importance of HDAC-driven silencing of miR-210 in facilitating overexpression of BTK in CLL.1 In this work, we evaluated the role of the miR-182 cluster (as the top miRNA cluster induced by >60-fold after HDACi) by cosequencing microRNA and mRNA within the same CLL samples, which identifies inverse relationships between functionally related miRNA-mRNA pairs to establish potential miRNA-target gene interactions.20 Bioinformatic analysis across 12 miRNA target-prediction programs identified that all 3 microRNAs, miR-182, miR-183, and miR-9-3, had binding sites on PAX5, IKZF3, BTK, and SYK (supplemental Table 13). Anticorrelation analysis of miRNA and mRNA profiles in 10 CLL samples exposed to abexinostat showed that induction of each of these miRNA was inversely correlated with declines in IKZF3 and BTK with high significance (rho > −0.55, P < .05), whereas miR-182 and miR-183 were anticorrelated with BCL2 and SYK (rho > −0.45, P < .05) (Figure 7E). As a control, we also evaluated the relationship of these miRs with PAX5, BLK, and ROR1, and found that they were not significant (rho – P > .05) (supplemental Figure 6). These results indicate that HDAC inhibition targeted the CLL driver genes IKZF3 and BCL2 by directly disrupting their transcription as well as via microRNA-driven targeting mechanisms, whereas other driver genes such as BTK (miR-210 and miR-182-183-96 cluster) and SYK (mir-183 and miR-96) downregulated expression most likely owing to posttranscriptional targeting by multiple microRNAs. Finally, to determine whether our findings in primary tumor cells were validated in vivo, we used a Eμ-TCL1–driven mouse model of CLL where mice bearing >10% CD19+/Cd5+ leukemia cells by flow cytometric analysis were randomized to vehicle or abexinostat administered thrice weekly for 2 weeks. Small RNA seq analysis conducted on CLL cells from mice spleens (n = 3) demonstrated that the miR-182 cluster (miR-183, miR-182, and miR-96) was the top cluster induced after HDAC inhibition (supplemental Figure 7A; supplemental Table 12). Induction of the miR182 cluster was anticorrelated with reduced expression of several CLL driver genes such as Pax5, IKZF3, BTK, and BLK (supplemental Figure 7B; supplemental Table 7).
Discussion
The regulatory chromatin forms a functional code that controls gene expression. Our results identify that HDAC1 is ubiquitously found across the genome in 1 of 2 configurations: (1) recruited within H3K27Ac marked enhancers or (2) without enhancers in association with or without H3K4Ac. These 2 regulatory chromatin configurations enable HDAC1 to perform diametrically opposing functions as either a transcriptional activator or a repressor.
Previous studies identified BRD4 at SEs, which was thought to be sufficient for driving oncogenic RNA.19,20 A recent study identified HDAC1 at SEs in solid tumor lines where it facilitated transcription.15,16 Our study interrogated multiple layers of the regulatory chromatin to identify that HDAC1 was strongly recruited to BRD4-dense enhancers marked by H4K27Ac (SEs and TE) in CLL. We had previously shown that the BRD4 recruitment at enhancers was aberrant and specific to CLL and not found in healthy CD19 B cells,18 it follows that the HDAC1 fingerprint was also specific to CLL cells because 95% to 99% of analyzed enhancers corecruited HDAC1 and BRD4. In this configuration, HDAC1 functioned as a transcriptional activator for a select set of driver genes critical to survival in CLL because HDAC1 inhibition effectively abolished their expression. In addition, HDAC1 inhibition also decreased the expression of 2 oncogenic microRNAs, miR-155 and miR-21. miR-155 affects BCR signaling21 and both miR-155 and miR-2122 were shown to be associated with adverse outcomes in CLL by us and others.18,21,23 These findings establish that HDAC1 facilitates the expression of driver genes in CLL because HDAC inhibition was as effective as BRD4 inhibition18 in downregulating a common set of driver genes.18
Our results also identify that in the absence of BRD4 or SEs, HDAC1 functions as a rheostat that regulates gene expression. Cluster II exhibited some levels of Pol2 occupancy, which allowed these transcripts to become expressed at moderate levels, whereas cluster III did not recruit Pol2, leading to the silencing of most genes in this cluster. HDAC inhibition upregulated 86% to 93% of the genes in cluster II and III. Of these, the PCG upregulated did not appear to affect the biology of CLL, whereas the microRNA genes such as the miR-182 cluster appeared to have significant roles in the biology of CLL as they appeared to target several driver genes in CLL such as BTK, IKZF3, BCL2, and SYK. Although we focused on HDAC1 in this work, HDAC inhibition was achieved using a pan-HDAC inhibitor, making it likely that other HDACs also play a role in regulating these transcripts. Further investigation into the components and transcriptional factors would be required to understand the mechanisms that allow HDAC1 to function as a transcriptional activator at SEs and as a repressor in its absence.
In conclusion, our study identifies how tumor cells establish transcriptional dysregulation by orchestrating the regulatory chromatin code. It also uncovers additional mechanisms that drive transcriptional dysregulation where HDAC functions as a transcriptional coactivator with BRD4 to activate oncogenic circuits, but as a repressor, silences microRNA genes to facilitate the robust expression of driver genes in CLL. Furthermore, in addition to protein-coding and microRNA genes, multiple other noncoding RNAs were differentially regulated, whose function is yet to be studied in CLL.
Finally, although HDAC inhibition effectively targets B-cell malignancies such as CLL, mantle cell lymphoma, and subsets of lymphomas24,25 in vitro, HDAC inhibitor monotherapy is toxic in CLL but is approved for T-cell lymphomas and myeloma.26,27 Similarly, BRD4 inhibitors elicited adverse events in early clinical trials.28 Development of novel dual BRD4-HDAC1 inhibitors29 that synergize whereas minimizing toxicities would pave the way for epigenetic therapy in B-cell malignancies.
Acknowledgments
This research was supported by grants from the American Cancer Society Research (Scholar Grant RSG-12-072-01), CLL Global Alliance, and The OSU Comprehensive Cancer Center Leukemia Tissue Bank Shared Resource (NCI P30 CA 016058), OSU and Nationwide Children’s shared genomic resource, and The University of Texas MD Anderson Cancer Center Chronic Lymphocytic Leukemia Moon Shot program.
Authorship
Contribution: T.-H.L. designed and conducted experiments and analyzed data; H.G.O. and S.Y. performed bioinformatic analysis and statistics and generated figures and data tables; J.G. and S.S. generated bioinformatic tables; P.G., G.N., and R.D. analyzed miRNA targeting and generated figures; L.Y. performed statistical analysis; J.R. performed experiments; R.L., J.W., V.P., J.B., and J.C.B. provided conceptual input and critical review of the manuscript; D.S. planned the project, designed and supervised the research, generated figures, interpreted the results, and obtained funding for the research work; and all authors approved, reviewed, and modified drafts of the manuscript, and approved the final version for submission.
Conflict-of-interest disclosure: H.G.O. is a present employee of Eli Lilly. J.B. is a consultant with Kite, Innate, AbbVie, and AstraZeneca, and has received honoraria from Kite, Innate, AbbVie, and AstraZeneca. J.R. is a present employee of Nurix. S.S. has received nonfinancial support from Bristol Myers Squibb and holds equity in Agenus Inc., Agios Pharmaceuticals, Breakbio Corp, Bristol Myers Squibb, and Lumos Pharma. J.W. is a part of AbbVie Inc., Loxo Oncology Inc., a wholly owned subsidiary of Eli Lilly & Company; received research funding from AbbVie, ArQule Inc., Janssen, Biotech Inc., AstraZeneca, and BeiGene; is on the advisory committee of Gilead Sciences Inc.; and is a consultant for AbbVie Inc., ArQule Inc., AstraZeneca Pharmaceuticals LP, Janssen Biotech Inc., and Pharmacyclics LLC, an AbbVie Company. J.C.B. has a membership on Newave’s board of directors or advisory committees; is a current equity holder and has a membership on board of directors or advisory committees in Vincerx Pharmaceuticals, a publicly-traded company; and is a consultant for and has received honoraria from Novartis, Trillium, Astellas, AstraZeneca, Pharmacyclics, and Syndax. D.S. serves on the advisory committee of Newave. The remaining authors declare no competing financial interests.
Correspondence: Deepa Sampath, The University of Texas MD Anderson Cancer Center, 2SCR2.2014, 7455 Fannin St, Houston, TX 77030; e-mail: dsampath@mdanderson.org.

