Key Points
The pathogenic gene expression programs in LSCs are driven by the aberrant activity of enhancer elements.
Histone acetyltransferase inhibition effectively disrupts the AML enhancer regulatory axis.
Abstract
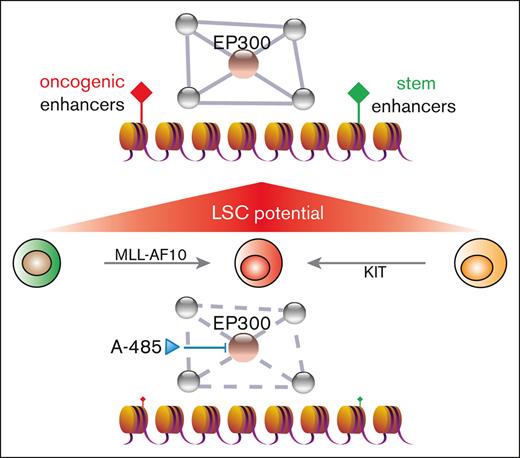
Acute myeloid leukemia (AML) with mixed-lineage leukemia (MLL) gene rearrangement (MLLr) comprises a cellular hierarchy in which a subpopulation of cells serves as functional leukemia stem cells (LSCs). They are maintained by a unique gene expression program and chromatin states, which are thought to reflect the actions of enhancers. Here, we delineate the active enhancer landscape and observe pervasive enhancer malfunction in LSCs. Reconstruction of regulatory networks revealed a master set of hematopoietic transcription factors. We show that EP300 is an essential transcriptional coregulator for maintaining LSC oncogenic potential because it controls essential gene expression through modulation of H3K27 acetylation and assessments of transcription factor dependencies. Moreover, the EP300 inhibitor A-485 affects LSC growth by targeting enhancer activity via histone acetyltransferase domain inhibition. Together, these data implicate a perturbed MLLr-specific enhancer accessibility landscape, suggesting the possibility for disruption of the LSC enhancer regulatory axis as a promising therapeutic strategy in AML.
Introduction
Acute myeloid leukemia (AML) with mixed-lineage leukemia (MLL) gene rearrangement (MLLr) is a poor prognostic leukemia distinguished by fundamental epigenetic perturbations underlying its pathogenesis.1-3 MLLr results in loss or alteration of its inherent histone methyltransferase activity and acquisition of novel transcriptional properties,4-6 promoting leukemogenic transformation. Leukemia stem cells (LSCs) reside at the apex of the developmental pyramid of MLLr AML, giving rise to LSCs and well-differentiated mature myeloid blast cells (mAMLs) that make up the bulk of the neoplasm.7-9 A comprehensive understanding of the vulnerabilities of LSCs, and how they vary from healthy hematopoietic stem cells and bulk leukemic blasts, is necessary for LSC-targeted therapies leading to improved outcomes and long-term survival.
Enhancers are noncoding DNA elements that contribute to gene expression. They mediate temporal and tissue-specific transcriptional control through long-distance interactions with promoters.10,11 In general, active enhancers display several characteristics, including open chromatin accessibility and histone modifications, such as H3 lysine 4 monomethylation (H3K4me1) and H3 lysine 27 acetylation (H3K27ac). The active enhancer landscape can be modulated by transcription factors (TFs) or cofactors including mediators, chromatin-remodeling complexes, and histone-modifying enzymes.12 Subsequent studies have shown that leukemia contains clusters of aberrantly active enhancers that drive dysregulated oncogene expression.13-15 Understanding the enhancer landscape and mechanisms in tumors can provide crucial information about the cell state, regulatory networks, and assessment of tumor responses.
AML with MLLr is highly organized in a cellular hierarchy in which a subpopulation serves as functional LSCs. We previously reported that thousands of differentially expressed genes are associated with self-renewal, multipotency, and the proliferation of MLLr LSCs.5 A major mechanism by which LSCs sustain cellular identity and functionality is through an epigenetic state with high levels of H3K4me3 and low levels of H3K79me2.16 The observed alterations of histone modifications and gene expression indicate the possibility of enhancer and transcriptional reprogramming in MLLr LSCs. However, thorough characterizations of the enhancer landscape in AML, especially in LSCs, have not been extensively studied. In this study, we investigated the cis-regulatory mechanisms that maintain LSC function on an epigenome-wide scale, which has the potential to provide more efficacious and less toxic therapies for patients with AML.
Materials and methods
Cell lines
Murine MLL-AF10 leukemia cells were grown in RPMI 1640 supplemented with 20% fetal bovine serum (FBS), 20% WEHI-conditioned medium, and 1% penicillin-streptomycin. Human leukemia cell lines were obtained from the American Type Culture Collection and maintained in RPMI 1640 with 10% FBS and 1% penicillin-streptomycin. CRISPR-Cas9 engineered MLL-AF9 leukemia cells were cultured in StemSpan SFEM II medium with stem cell factor (50 ng/mL), thrombopoietin (100 ng/mL), Flt3 ligand (100 ng/mL), interleukin-6 (100 ng/mL), interleukin-3 (50 ng/mL), granulocyte colony-stimulating factor (50 ng/mL), UM729 (0.75 μM), StemRegenin 1 (0.75 μM), and 20% FBS at 37°C and 5% CO2 as previously described.17
Human subjects
Primary AML samples were obtained from patients treated at Tianjin Medical University Cancer Institute & Hospital. The diagnosis of AML was established based on the World Health Organization classification and National Comprehensive Cancer Network guidelines. Mononuclear bone marrow cells were separated via Ficoll-Hypaque density gradient centrifugation and stored in liquid nitrogen. This study was approved by the institutional review board, and informed consent was obtained in accordance with the revised Declaration of Helsinki. Patient samples harboring MLLr were used as specified in the main text.
Isolation of LSCs
LSCs were obtained from the bone marrow as previously described.8,16 Briefly, 1 × 10⁶ AML cells harboring MLL-AF10 translocation from in vitro culture were transplanted into sublethally irradiated (500 cGy) recipient mice via tail-vein injection. Recipient mice were euthanized when moribund and leukemia cells were collected from the bone marrow and fractionated based on c-Kit expression using CD117 antibody in a BD FACSAria cell sorter. Enrichment of LSCs was quantified by seeding cells in methylcellulose media with cytokines.
iChIP-seq and bioinformatics analyses
Indexing-first chromatin immunoprecipitation sequencing (iChIP-seq) was performed as previously described, with modifications.18 Briefly, 2 × 10⁴ granulocyte-monocyte progenitors (GMPs), LSCs, and mAML cells were harvested, fixed, and sheared using an E220 Focused-ultrasonicator (Covaris). After H3 antibody immobilization, sheared chromatin was indexed and pooled for IP against histone marks H3K27ac, H3K4me1, and H3K4me3 and transcription regulator EP300 (supplemental Table 7). ChIPed DNA was amplified, size-selected, and subject to sequencing on an Illumina NextSeq 500 or HiSeq 2500 platform.
The sequencing reads were mapped to the mouse genome (mm9) using BWA.19 Duplicated reads were removed using Picard (https://broadinstitute.github.io/picard/). MACS2 was used for peak calling with default parameters.20 Enhancer states were extracted from ChromHMM segmentation states and annotated using genomic regions enrichment of annotations tool.21,22 The principal component analysis (PCA) were estimated based on the plotPCA function available from the deepTools.23 The histone modification avgprof and heatmap were generated using NGSPLOT.24 Enhancers were LiftOver from mm9 to hg19 (https://genome.ucsc.edu/). Enhancers were ranked from H3K27ac ChIP-seq using rank-ordering of superenhancers algorithm with default parameters.25 Enrichment of known and de novo motifs were found and connected using hypergeometric optimization of motif enrichment26 and search tool for the retrieval of interacting genes/proteins (STRING).27
ChIP–quantitative PCR
ChIP was performed with slight modifications using the Zymo-Spin ChIP Kit (Zymo Research). Briefly, 1 × 10⁶ cells were cross-linked with formaldehyde. Chromatin was sheared using Bioruptor (Diagenode) with 7 cycles (30 sec ON/OFF). After immunoprecipitation with antibodies H3K27ac, EP300, PU.1, C/EBPα, and IgG (negative control), ZymoMag Protein A beads were used to pull down the antibody-antigen complexes. DNA was amplified via quantitative polymerase chain reaction with primers to selected enhancers (supplemental Table 7). All samples were performed in at least triplicates, from at least 3 independent experiments, and data were normalized to the percentage of input.
RNA-seq analysis
RNA was extracted from GMPs, LSCs, and mAMLs with RNeasy Plus Mini Kit (Qiagen), per the manufacturer's instructions. RNA-seq libraries were generated and sequenced via Novogene. RNA-seq reads were mapped against the mouse genome (mm9) using spliced transcripts alignment to a reference .28 Differential expression analysis and visualization were carried out with raw counts using DESeq2 and iDEP.29,30 Gene ontology analysis of bivalent genes was performed using WebGestalt.31 Counts values were used in gene set enrichment analysis (GSEA) using 1000 data permutations to examine enrichment significance of individual gene sets.32
Complementary DNA synthesis and quantitative reverse transcription PCR
Total RNA was extracted as described in RNA-seq. Complementary DNA was synthesized using QuantiTect Reverse Transcription Kit (Qiagen). Quantitative reverse transcription PCR was performed using PowerUp SYBR Green Master Mix on CFX96 and quantified using the ΔΔCt.
Viral vectors and colony formation assays
The lentiviral short hairpin RNAs (shRNAs) were obtained from Sigma (supplemental Table 7). Fresh sorted LSCs were transduced with lentivirus by spinoculation and cultured overnight. Two days after infection, cells were selected using 2μg/mL puromycin for 48 hours. Harvested cells were cultured in methylcellulose-containing medium (Methocult M3231, Stemcell Technologies) with cytokines, as previously described.8,16 Colonies were enumerated 5 days later.
Western blot
Whole cell extracts were prepared from cells using Ripa buffer (Thermo Fisher). The extracts were then subjected to sodium dodecyl sulfate-polyacrylamide gel electrophoresis and western blot, with indicated antibodies. Histones were analyzed using acid extraction. Briefly, cells were lysed by triton extraction buffer and acid (0.2N HCl) extracted overnight. Neutralized supernatants were then subjected to 4% to 20% mini protein gel electrophoresis and western blotted with indicated antibodies (supplemental Table 7).
Animals and in vivo drug treatment
For A-485 treatment, 1 × 10⁶ LSCs from in vitro culture were transplanted intravenously into sublethally (5Gy) irradiated C57BL/6 mice aged 10 to 12 weeks. Mice were treated with A-485 or vehicle control at day 3 after transplantation for 20 days (early-arm treatment) or at day 28 after transplantation for 20 days (late-arm treatment). Mice were dosed at 100 mg/kg daily intraperitoneally. Moribund mice were euthanized and analyzed for leukemia burden. All experiments using mice were performed with the approval of and in accordance with the Stanford University administrative panel on laboratory animal care. For histopathology analyses, femurs were fixed in formaldehyde, decalcified, and embedded in paraffin. Spleens and livers were treated similarly, except for the decalcification step. Sections were stained with hematoxylin and eosin. For flow cytometric analyses, single-cell suspensions from the bone marrow and spleen were stained with panels of fluorochrome-conjugated antibodies. Analyses were performed using a BD FACSAria II cell sorter. All data were analyzed using FlowJo version 10.
Mice were housed under pathogen-free conditions in an animal facility (Tianjin Medical University Cancer Institute and Hospital), and all animal experiments were approved by the ethics committee. Studies were conducted in female NOD.Cg-PrkdcscidIl2rgtm1Wjl/SzJ (NSG) mice of 8 weeks. MLL-AF9+ AML cell line THP-1 were infected with luciferase virus and treated with puromycin to select succeed infected cells. The THP-1 cells were transplanted into the NSG mouse using a tail-vein injection of 2 × 10⁵ cells per mouse suspended in 300 μL Dulbecco phosphate buffered saline and randomly divided into 2 groups. Treatment of A-485 or the vehicle control was started for 14 days at day 3 after transplantation. A-485 and the vehicle were administrated intraperitoneally at a dose of 100mg/kg daily. Total body leukemia burdens were detected within 10 minutes after injecting luciferin at day 16 and 18 after transplantation via bioluminescent imaging. Each mouse total body luminescence intensity was calculated using the In Vivo Imaging Systems software. The peripheral circulating leukemia cells was performed on days 16 and 18 after transplantation via flow cytometry using 10 μLtail vein blood lysed red blood cells and marked by antihuman CD45 antibodies. The overall survival time was analyzed using Kaplan-Meier survival log-rank method.
Cell proliferation and cell-cycle assays
Cells were seeded at a constant density before treatment and treated with either 500 nM A-485 or dimethyl sulfoxide over the indicated time period. Cell proliferation was assessed using CellTiter-Glo (Promega), following the manufacturer’s instruction. Cells (10 000/100 μL) were seeded into 96-well plate in triplicate. Equal amounts of CellTiter-Glo reagent were added to each well. Luminescence data were read and recorded using BioTek microplate reader. For cell-cycle assay, cells were fixed and stained using FxCyclepropidium iodide/ribonuclease Staining Solution (Thermo Fisher) according to the manufacturer’s instruction.
Quantification and statistical analysis
Data are presented as mean ± standard deviation, unless otherwise indicated. Student t test (unpaired, 2-tailed) was used to assess significance between treatment and control groups of mice. In vivo A-485 treatment was analyzed using log-rank (Mantel-Cox) test. P < .05 were considered significant. Generation of plots and statistical analyses were performed using Prism GraphPad version 8.
Results
Pervasive enhancer activation in MLLr leukemia
To decipher cis-regulatory networks in LSCs, we used an MLL oncogene (MLL-AF10) leukemia model with a retroviral transduction approach (supplemental Figure 1A).8,16 In this model, AML cells with MLLr form a hierarchy consisting of cells with distinct immunophenotypes, c-Kit+ vs c-Kit–. To assess the leukemogenic potential, the 2 populations were harvested via fluorescence-activated cell sorting (supplemental Figure 1B). Clonogenic assays showed that LSCs are highly enriched in the c-Kit+ subpopulation, whereas c-Kit– cells are enriched for nonself-renewing mAMLs (supplemental Figure 1C). The epigenomic landscapes of enriched LSCs, mAMLs, and control GMPs were assessed by analyzing 3 histone marks (H3K27ac, H3K4me1, and H3K4me3). Several chromatin states, including active and poised enhancers, were distinguished (supplemental Figure 1D; supplemental Table 1) using ChromHMM.
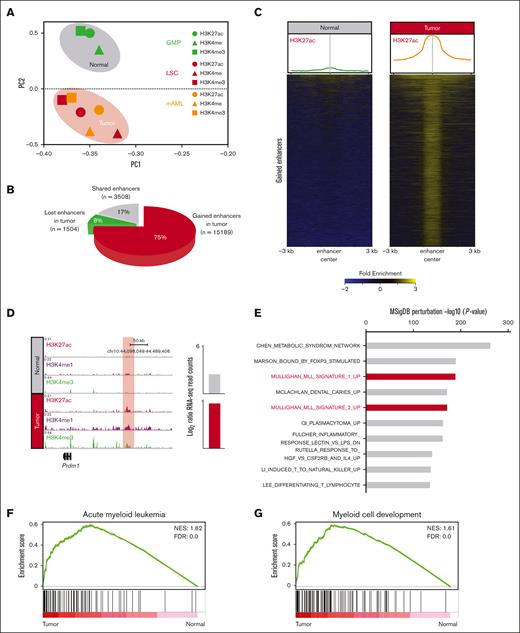
PCA using global H3K4me1, H3K4me3, and H3K27ac intensities at the enhancer elements clearly separated healthy (GMP) and leukemia (LSC and mAML) cells (Figure 1A), indicating a specific epigenetic landscape of MLLr leukemia. Notably, there was a substantial increase in active enhancers (15 189) in leukemia cells vs in GMPs (Figure 1B); hereafter referred to as gained enhancers. The gained enhancers in leukemia cells showed typical enhancer signatures (H3K27ac+/H3K4me1+) (Figure 1C,D; supplemental Figure 1E) and >90% localized to introns and intergenic regions (supplemental Figure 1F).
MLLr leukemia exhibits an aberrant enhancer landscape. (A) PCA using all enhancers classifies normal (green) and tumors (red and orange) into distinct clusters. (B) Pie chart showing the gained (15 189), shared (3508), and lost (1504) enhancers in MLLr leukemia. (C) H3K27ac enrichment at gained enhancers in MLLr leukemia. Averaged profiles of the H3K27ac ChIP-seq signal at enhancers in healthy and tumor samples (top). Heatmap plots of the H3K27ac ChIP-seq signal at enhancers in healthy and tumor samples (bottom). (D) Meta tracks of histone modification signals across tumor-specific enhancers. Candidate gene expression is shown to the right of each track. Enhancer region is highlighted with red box. (E) Top enriched gene ontology terms for enhancer associated genes in tumor cells determined by querying the Molecular Signatures Database (MSigDB) Perturbation gene sets. (F,G) GSEA using gene sets for AML and myeloid cell development, comparing the expression of genes associated with gained enhancers in tumor vs normal. FDR, false discovery rate; NES, normalized enrichment score.
MLLr leukemia exhibits an aberrant enhancer landscape. (A) PCA using all enhancers classifies normal (green) and tumors (red and orange) into distinct clusters. (B) Pie chart showing the gained (15 189), shared (3508), and lost (1504) enhancers in MLLr leukemia. (C) H3K27ac enrichment at gained enhancers in MLLr leukemia. Averaged profiles of the H3K27ac ChIP-seq signal at enhancers in healthy and tumor samples (top). Heatmap plots of the H3K27ac ChIP-seq signal at enhancers in healthy and tumor samples (bottom). (D) Meta tracks of histone modification signals across tumor-specific enhancers. Candidate gene expression is shown to the right of each track. Enhancer region is highlighted with red box. (E) Top enriched gene ontology terms for enhancer associated genes in tumor cells determined by querying the Molecular Signatures Database (MSigDB) Perturbation gene sets. (F,G) GSEA using gene sets for AML and myeloid cell development, comparing the expression of genes associated with gained enhancers in tumor vs normal. FDR, false discovery rate; NES, normalized enrichment score.
To identify genes modulated by the normal- and tumor-specific enhancers, lost and gained enhancers were assigned to nearby genes using the genomic regions enrichment of annotations tool (supplemental Table 2). We observed a specific decrease (221/1835) and increase (1389/6391) in the expression of these enhancer-associated genes in leukemia cells. Genes associated with gained enhancers exhibited a highly significant MLL-specific signature in MSigDB (Figure 1E). Performing GSEA on gained enhancer-associated genes revealed a significant enrichment of AML-associated and myeloid development signatures in tumor cells (Figure 1F,G).
To assess a potential role for direct binding of the MLL oncoprotein to gained enhancers, the LiftOver tool was used to convert MLLr ChIP-seq data sets for human cell lines into mouse genome coordinates.33 Correlation with gained enhancer regions demonstrated that 27.5% (4188/15 189) of THP-1 and 53.6% (8146/15 189) of MV4-11 enhancer loci were bound by the MLL oncoprotein (supplemental Figure 1G), suggesting that a substantial fraction of gained enhancers may be direct targets of the MLLr oncoprotein. HOXA9, a downstream mediator of MLLr that reshapes the leukemia-specific enhancer landscape,34 was less frequent at gained enhancers (7.9%; 1205/15 189; supplemental Figure 1H) suggesting that it did not extensively account for the observed broad activation of gained enhancers in MLLr AML.
A distinct enhancer landscape in LSCs
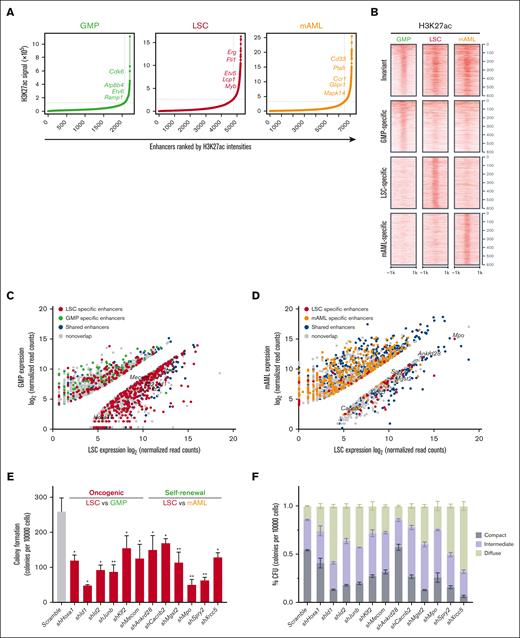
Enhancers were ranked based on the average H3K27ac enrichment in GMPs, LSCs, and mAMLs. This identified 475 distinct superenhancer-containing loci (Figure 2A; supplemental Table 3). The superenhancers in LSCs flanked established MLLr signature genes (Lcp1 and Myb) as well as novel candidates (Erg, Fli1, and Etv5), a substantial subset of which demonstrated significant cell specificity (Figure 2B; supplemental Figure 2A,B). H3K27ac distinguishes active enhancers from inactive/poised enhancer elements that only contain H3K4me1 (supplemental Figure 2C).35,36 Using transcriptome profiling, LSC-specific enhancers showed enrichment at genes previously implicated as LSC signature genes.5 Enhancer/gene assignments derived from combining H3K27ac ChIP-seq and RNA-seq–identified genes with significantly different expression levels, comparing LSCs vs GMPs and LSCs vs mAMLs. Genes with significantly divergent expressions between cells were strongly enriched for nearby cell-specific enhancers, with GMP-specific genes flanked by GMP-specific enhancers, LSC-specific genes by LSC-specific enhancers, and mAML-specific genes by mAML-specific enhancers (Figure 2C,D; supplemental Table 4).
LSC enhancers characterize cell identity and are functionally important for maintaining LSC oncogenic potential. (A) Ranked enhancer plots defined across composite H3K27ac landscapes of GMP, LSC, and mAMLs. Superenhancer clusters are shown to the right of the gray line. (B) Heatmap of H3K27ac counts across cell-specific and invariant enhancers. Each row represents a 2 kb window centered around the middle of top 600 GMP-specific, LSC-specific, mAML-specific, and invariant enhancers for H3K27ac. All reads were aligned to mm9. (C) Mean normalized LSC expression (x-axis) vs mean normalized GMP expression (y-axis) for genes associated with LSC-specific enhancers (red) or with GMP-specific enhancers (green). (D) Mean normalized LSC expression (x-axis) vs mean normalized mAML (y-axis) expression for genes associated with LSC-specific enhancers (red) or with mAML-specific enhancers (orange). (E,F) Colony formation assay at day 5 in LSCs infected with shRNAs targeting oncogenic and self-renewal genes. The number (E) and morphology (F) of CFUs for oncogenes and self-renewal genes shRNA-infected colonies is significantly different from the number and morphology of CFUs for controls (n = 3; mean ± SD). ∗P < .05; ∗∗P < .01. CFU, colony-forming units; SD, standard deviation.
LSC enhancers characterize cell identity and are functionally important for maintaining LSC oncogenic potential. (A) Ranked enhancer plots defined across composite H3K27ac landscapes of GMP, LSC, and mAMLs. Superenhancer clusters are shown to the right of the gray line. (B) Heatmap of H3K27ac counts across cell-specific and invariant enhancers. Each row represents a 2 kb window centered around the middle of top 600 GMP-specific, LSC-specific, mAML-specific, and invariant enhancers for H3K27ac. All reads were aligned to mm9. (C) Mean normalized LSC expression (x-axis) vs mean normalized GMP expression (y-axis) for genes associated with LSC-specific enhancers (red) or with GMP-specific enhancers (green). (D) Mean normalized LSC expression (x-axis) vs mean normalized mAML (y-axis) expression for genes associated with LSC-specific enhancers (red) or with mAML-specific enhancers (orange). (E,F) Colony formation assay at day 5 in LSCs infected with shRNAs targeting oncogenic and self-renewal genes. The number (E) and morphology (F) of CFUs for oncogenes and self-renewal genes shRNA-infected colonies is significantly different from the number and morphology of CFUs for controls (n = 3; mean ± SD). ∗P < .05; ∗∗P < .01. CFU, colony-forming units; SD, standard deviation.
Flanking genes differentially expressed in LSCs vs GMPs had features of oncogenes inferred from COSMIC cancer gene census37 and ONGene databases38 (supplemental Figure 2D,E), whereas those differentially expressed in LSCs vs mAMLs were implicated in hematopoietic stem cells and induced pluripotent stem cells inferred from StemChecker (supplemental Figure 2F,G).39 Knock down of representative genes in both categories impaired maintenance of LSCs, as indicated by the reduction and differentiation pattern in LSC colony-forming units (Figure 2E,F; supplemental Figure 2H), suggesting that LSC-specific enhancer-associated genes were involved in leukemogenesis via an integrated network of oncogenes and self-renewal genes.
Transcriptional regulatory networks in LSCs
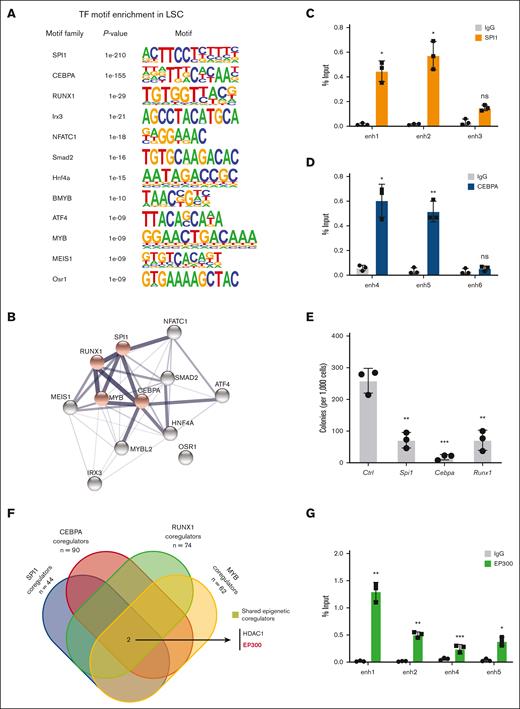
The LSC-associated enhancers demonstrated enrichment for several key TF motifs suggesting an interactive TF network in LSCs (Figure 3A). The motifs constituted binding sites for TFs involved in hematopoietic lineage specification (SPI1, CEBPA, and RUNX1) and MLL leukemia pathogenesis (MYB). The STRING database suggested that the implicated TFs are highly connected by putative protein–protein interactions (Figure 3B). Using ChIP assays, we confirmed the enhanced binding of SPI1 and CEBPA to selected enhancer elements (Figure 3C,D). Knock down of their expression resulted in substantial suppression of colony formation (Figure 3E), supporting their functional roles in MLLr LSCs.
Enhancer landscapes defines transcriptional regulatory network of LSCs. (A) De novo motif analysis showing the enrichment of TFs at LSC enhancers compared with known motif background using HOMER. (B) STRING database analysis demonstrates that 11 of 12 LSC-specific transcription factor dependencies have putative protein–protein interactions. Red nodes indicate TFs previously coreported with leukemia in a literature search. (C,D) ChIP-qPCR of SPI1 and CEBPA binding at selected enhancers in LSCs. IgG enrichment was used as a negative control (n = 3; mean ± SD). (E) Colony formation assay at day 5 in LSCs infected with shRNAs targeting Spi1, Cebpa, and Runx1 (n = 3; mean ± SD). (F) Discovering transcription coregulators that share regulatory targets with SPI1, CEBPA, RUNX1, and MYB. (G) ChIP-qPCR of EP300 binding at selected enhancers in LSCs. IgG enrichment was used as a negative control (n = 3; mean ± SD). ∗P < .05; ∗∗P < .01; ∗∗∗P < .001. HOMER, hypergeometric optimization of motif enrichment; IgG, immunoglobulin G; qPCR, quantitative PCR.
Enhancer landscapes defines transcriptional regulatory network of LSCs. (A) De novo motif analysis showing the enrichment of TFs at LSC enhancers compared with known motif background using HOMER. (B) STRING database analysis demonstrates that 11 of 12 LSC-specific transcription factor dependencies have putative protein–protein interactions. Red nodes indicate TFs previously coreported with leukemia in a literature search. (C,D) ChIP-qPCR of SPI1 and CEBPA binding at selected enhancers in LSCs. IgG enrichment was used as a negative control (n = 3; mean ± SD). (E) Colony formation assay at day 5 in LSCs infected with shRNAs targeting Spi1, Cebpa, and Runx1 (n = 3; mean ± SD). (F) Discovering transcription coregulators that share regulatory targets with SPI1, CEBPA, RUNX1, and MYB. (G) ChIP-qPCR of EP300 binding at selected enhancers in LSCs. IgG enrichment was used as a negative control (n = 3; mean ± SD). ∗P < .05; ∗∗P < .01; ∗∗∗P < .001. HOMER, hypergeometric optimization of motif enrichment; IgG, immunoglobulin G; qPCR, quantitative PCR.
EP300 is required for LSC oncogenic potential
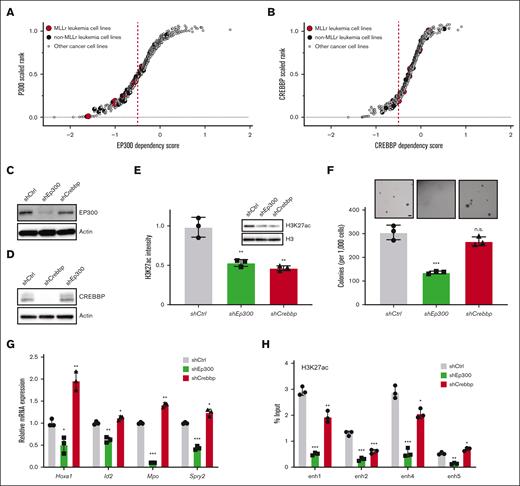
To further investigate their potential functional interactions, we analyzed for shared epigenetic coregulators of SPI1, CEBPA, RUNX1, and MYB via publicly available EpiFactors and transcriptional regulatory relationships unraveled by sentence-based text-mining databases (Figure 3F; supplemental Table 5).40,41 This identified the coregulatory factors EP300 and histone deacetylase 1 (HDAC1) implicated in regulating enhancer activation states. EP300 is a histone acetyltransferase (HAT) that is specifically responsible for acetylation on H3K27 and is highly expressed in AML (The Cancer Genome Atlas cohort), including MLLr AML (supplemental Figure 3A,B).42-44 EP300 was recruited to LSC enhancer regions (Figure 3G), which was accompanied by a similar increase in the binding of TFs to these enhancers (Figure 3C,D), suggesting a crucial role of EP300 as a coactivator for TF-dependent transcription of leukemia pathogenesis. Representative dependency scores in leukemia and other tumor cells showed a selective dependency on EP300 in MLLr leukemia as well as several non-MLLr leukemias vs less dependence on the highly homologous CREBBP (cyclic adenosine 5′-monophosphate response element binding protein) (P = .0291; Fisher exact test) (Figure 4A,B).45 These findings raised the possibility that downregulation of EP300 may extinguish LSC oncogenic potential by reducing H3K27ac levels on enhancers and disrupting key nodes of transcriptional regulatory networks.
Dissecting the oncogenic role of EP300 in LSC. (A,B) Representative scatter plots showing MLLr leukemia relative dependency on EP300 (A) and CREBBP (B) with n = 7 MLLr leukemia cell lines compared with n = 25 non-MLLr leukemia cell lines and n = 593 nonleukemia cancer cell lines. Y-axis shows the dependency rank of EP300 or CREBBP in an individual cell line. X-axis shows the dependency score in each cell line. (C,D) Protein levels of EP300 (C) and CREBBP (D) in LSCs, expressing corresponding shRNAs against the 2 HATs. (E) Immunoblots of H3K27ac in LSCs after knockdown of control, Ep300 and Crebbp (n = 3; mean ± SD). (F) Morphology and quantification of colonies of Ep300 and Crebbp knockdown cells (n = 3; mean ± SD). Scale bar, 20 μm. (G) Bar graph indicates LSC enhancer–associated gene transcript levels (Hoxa1, Id2, Mpo, and Spry2) in cells transduced with the indicated shRNAs. Transcript levels were quantified by RT-PCR and expressed relative to control vector (n = 3; mean ± SD). (H) ChIP-qPCR of H3K27ac at enhancers in LSCs upon loss of EP300 and CREBBP. IgG enrichment was used as a negative control (n = 3; mean ± SD). ∗P < .05; ∗∗P < .01; ∗∗∗P < .001. ns, not significant; RT-PCR, reverse-transcriptase PCR.
Dissecting the oncogenic role of EP300 in LSC. (A,B) Representative scatter plots showing MLLr leukemia relative dependency on EP300 (A) and CREBBP (B) with n = 7 MLLr leukemia cell lines compared with n = 25 non-MLLr leukemia cell lines and n = 593 nonleukemia cancer cell lines. Y-axis shows the dependency rank of EP300 or CREBBP in an individual cell line. X-axis shows the dependency score in each cell line. (C,D) Protein levels of EP300 (C) and CREBBP (D) in LSCs, expressing corresponding shRNAs against the 2 HATs. (E) Immunoblots of H3K27ac in LSCs after knockdown of control, Ep300 and Crebbp (n = 3; mean ± SD). (F) Morphology and quantification of colonies of Ep300 and Crebbp knockdown cells (n = 3; mean ± SD). Scale bar, 20 μm. (G) Bar graph indicates LSC enhancer–associated gene transcript levels (Hoxa1, Id2, Mpo, and Spry2) in cells transduced with the indicated shRNAs. Transcript levels were quantified by RT-PCR and expressed relative to control vector (n = 3; mean ± SD). (H) ChIP-qPCR of H3K27ac at enhancers in LSCs upon loss of EP300 and CREBBP. IgG enrichment was used as a negative control (n = 3; mean ± SD). ∗P < .05; ∗∗P < .01; ∗∗∗P < .001. ns, not significant; RT-PCR, reverse-transcriptase PCR.
Depletion of Ep300 or Crebbp by shRNA resulted in suppression of H3K27ac intensity compared with other acetyl-H3 marks in LSCs (Figure 4C-E; supplementa Figure 3C), suggesting that acetylation of H3K27 is the major nonredundant chromatin modification that is mediated by EP300 and CREBBP. Although both HATs appeared to contribute to maintenance of H3K27ac levels, only EP300 knockdown significantly suppressed colony formation and induced morphological differentiation of LSCs (Figure 4F; supplemental Figure 3D). Ep300 knockdown was sufficient to reduce the expression of LSC enhancer–associated genes, whereas Crebbp knockdown only slightly strengthened enhancer-associated gene expression (Figure 4G). Ep300 knockdown resulted in loss of H3K27ac levels on these enhancers, and Crebbp knockdown showed modest reduction of H3K27ac levels (Figure 4H), revealing distinct patterns of regulation of HATs in LSCs. Although CREBBP is not absolutely required for maintaining LSC enhancer–associated gene expression, CREBBP regulation of H3K27ac levels may at least partly contribute to enhancer activity. Notably, neither Hoxa9 nor Meis1 were downregulated in LSCs upon the knockdown of Ep300 or Crebbp (supplemental Figure 3E), suggesting that the role of EP300 in LSC differentiation and maturation may be independent of the HOXA9/MEIS1 axis in AML. Together, these results suggest that EP300 is required for the maintenance of MLLr LSCs.
A-485 suppresses MLLr leukemogenesis
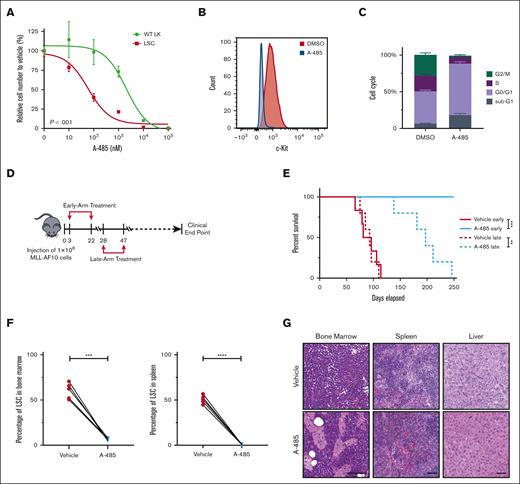
The observed enhancer-associated transcriptional regulatory networks in LSCs raised the possibility that LSCs may be targeted by A-485, a potent and selective catalytic inhibitor of EP300 and CREBBP.46 Treatment of LSCs with A-485 resulted in marked reduction of cell growth (Figure 5A; supplemental Figure 4A), H3K27ac intensity (supplemental Figure 4B), and c-Kit expression (Figure 5B; supplemental Figure 4C) leading to apoptosis and cell-cycle arrest (Figure 5C). Although A-485 displays potency against CREBBP, the shRNA-mediated reduction of CREBBP did not significantly alter LSC oncogenic potential (Figure 4F), indicating that the efficacy of A-485 in LSCs is primarily via EP300 inhibition.
P300 inhibition blocks progression of AML. (A) Dose dependent effect of A-485 inhibitor on LSCs and WT LK cells proliferation. Cells were exposed to the indicated concentrations of A-485 for 48 h (n = 3; mean ± SD). (B) Surface expression of c-Kit in LSCs with A-485 (500 nM) treatment for 48 hours. (C) Cell-cycle profile in LSCs with A-485 (500 nM) treatment for 48 hours. (n = 3; mean ± SD). (D) Schematic representation of the treatment protocol. Four mice groups (5 or 6 mice per group) were treated with either vehicle or A-485 from days 3 to 22 (early-arm) and days 28 to 47 (late-arm) with 100 mg/kg once daily after LSCs transplantation. (E) Kaplan-Meier plot of A-485- and vehicle-treated mice (n = 5 or 6). P value was generated using Mantel-Cox log-rank test. (F) Leukemia burden (number of c-Kit+ cells) in the bone marrow and spleen of vehicle- and A-485–treated mice euthanized at matched time points. Data are representative of 3 biological replicates and error bars represent SD of the mean. (G) Histological analysis of H&E-stained sections of the bone marrow, spleen, and liver from a representative vehicle-treated mouse and an age-matched A-485–treated mouse. Scale bar, 100 μm.∗∗P < .01; ∗∗∗P < .001; ∗∗∗∗P < .0001. H&E, hematoxylin and eosin; LK, Lin-c-Kit+; WT, wild-type.
P300 inhibition blocks progression of AML. (A) Dose dependent effect of A-485 inhibitor on LSCs and WT LK cells proliferation. Cells were exposed to the indicated concentrations of A-485 for 48 h (n = 3; mean ± SD). (B) Surface expression of c-Kit in LSCs with A-485 (500 nM) treatment for 48 hours. (C) Cell-cycle profile in LSCs with A-485 (500 nM) treatment for 48 hours. (n = 3; mean ± SD). (D) Schematic representation of the treatment protocol. Four mice groups (5 or 6 mice per group) were treated with either vehicle or A-485 from days 3 to 22 (early-arm) and days 28 to 47 (late-arm) with 100 mg/kg once daily after LSCs transplantation. (E) Kaplan-Meier plot of A-485- and vehicle-treated mice (n = 5 or 6). P value was generated using Mantel-Cox log-rank test. (F) Leukemia burden (number of c-Kit+ cells) in the bone marrow and spleen of vehicle- and A-485–treated mice euthanized at matched time points. Data are representative of 3 biological replicates and error bars represent SD of the mean. (G) Histological analysis of H&E-stained sections of the bone marrow, spleen, and liver from a representative vehicle-treated mouse and an age-matched A-485–treated mouse. Scale bar, 100 μm.∗∗P < .01; ∗∗∗P < .001; ∗∗∗∗P < .0001. H&E, hematoxylin and eosin; LK, Lin-c-Kit+; WT, wild-type.
The therapeutic potential of A-485 was assessed in vivo using a murine bone marrow transplantation model of MLLr AML. Treatment with A-485 was highly efficacious in early-arm (Days 3-22) and late-arm (Days 28-47) treatment cohorts (Figure 5D,E) with both cohorts displaying a significant survival advantage compared with that in the control group. Postmortem analysis showed significant differences between bone marrow or splenic leukemia burden in A-485 compared with that in vehicle-treated mice (Figure 5F; supplemental Figure 4D), with marked reduction of AML cells in hematopoietic tissues (Figure 5G). Thus, A-485 is effective at inhibiting MLLr AML in vivo.
A-485 modulates corresponding enhancer activity
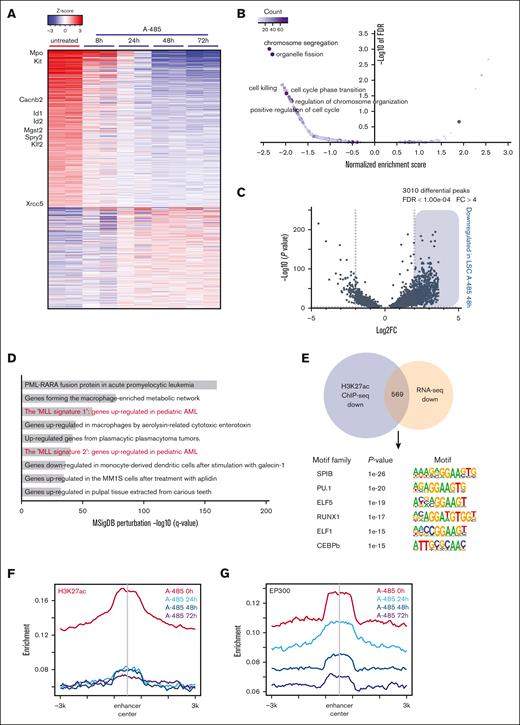
To evaluate the effects of A-485 treatment on enhancer-associated transcriptional regulatory networks and global gene expression, LSCs were treated with A-485 for various times and then subjected to gene expression and ChIP-seq analysis. Initial changes observed at 8 hours progressed to significantly altered transcriptomes at 48 hours and 72 hours (Figure 6A; supplemental Figure 5A). Heatmap display of gene expression profiles showed that in the LSC signature gene c-Kit and an LSC set of enhancer-associated genes, 916 of 6234 (eg, Mpo, Id1, and Spry2) were downregulated within 24 hours of treatment (Figure 6A), indicative of rapid collapse of the LSC transcriptional regulatory networks. Gene ontology analysis showed that the differentially expressed genes are enriched during cell cycle, DNA replication, and chromatin remodeling (Figure 6B), consistent with cellular phenotypes of LSCs after A-485 treatment. Notably, Hoxa9 and Meis1 transcripts paradoxically increased in LSCs, as a consequence of A-485 treatment (supplemental Figure 5B), indicating that the expression of these MLLr target genes in LSCs was not directly sustained by EP300.
A-485 drives gene expression changes through remodeling enhancer landscape in LSC. (A) Heatmap of expression changes of the genes obtained from LSC treated with A-485 (500 nM). Selected LSC enhancer–associated genes are labeled. (B) Gene ontology analysis of gene expression changes in LSC cells treated with A-485. (C) Volcano plots of differential H3K27ac peaks in LSC treated with DMSO and A-485, revealing 3010 differential peaks for H3K27ac in A-485-treated vs DMSO-treated LSCs. (D) Top enriched GO terms for significantly downregulated H3K27ac peaks in LSC treated with A-485 determined by querying the Molecular Signatures Database (MSigDB) Perturbation genesets. (E) Motif analysis of downregulated H3K27ac ChIP-seq peaks that overlap with downregulated genes. (F,G) Aggregation plots showing average ChIP-seq signals for H3K27ac and EP300 marks in LSC treated with A-485 for various times at enhancer regions. Plots are peak-centered and scaled at ±3 kb for each locus.DMSO, dimethyl sulfoxide.
A-485 drives gene expression changes through remodeling enhancer landscape in LSC. (A) Heatmap of expression changes of the genes obtained from LSC treated with A-485 (500 nM). Selected LSC enhancer–associated genes are labeled. (B) Gene ontology analysis of gene expression changes in LSC cells treated with A-485. (C) Volcano plots of differential H3K27ac peaks in LSC treated with DMSO and A-485, revealing 3010 differential peaks for H3K27ac in A-485-treated vs DMSO-treated LSCs. (D) Top enriched GO terms for significantly downregulated H3K27ac peaks in LSC treated with A-485 determined by querying the Molecular Signatures Database (MSigDB) Perturbation genesets. (E) Motif analysis of downregulated H3K27ac ChIP-seq peaks that overlap with downregulated genes. (F,G) Aggregation plots showing average ChIP-seq signals for H3K27ac and EP300 marks in LSC treated with A-485 for various times at enhancer regions. Plots are peak-centered and scaled at ±3 kb for each locus.DMSO, dimethyl sulfoxide.
ChIP-seq analysis showed that 3082 H3K27ac peaks were differentially modified between A-485-treated and -untreated LSCs. The vast majority (3010/3082; 97.7%) showed decreased H3K27ac signal intensities with A-485 treatment (Figure 6C; supplemental Figure 5C; supplemental Table 6). A significant correlation between downregulated H3K27ac peaks and MLL signature genes was observed (Figure 6D). In addition, motif analysis of 561 overlapping H3K27ac and RNA-seq–downregulated genes showed an enrichment in LSC enhancer–associated TFs (Figure 6E). A genome-wide survey of H3K27ac localization demonstrated that LSC enhancers experienced a loss of H3K27ac upon A-485 treatment and were marked by the progressive loss of EP300 at enhancers (Figure 6F,G; supplemental Figure 5D) along with TFs dissociation from the enhancer (supplemental Figure 5E,F). But, a subtle increase in the average level H3K27ac at promoters was observed in LSCs treated with A-485 (supplemental Figure 5G), indicating the distinct dynamics of HAT and HDAC activities at promoters vs enhancers in response to A-485. Taken together, these results demonstrate that EP300 is a transcriptional coregulator whose inhibition leads to collapse of the MLLr enhancer regulatory network.
A-485 inhibits MLLr human leukemia cells
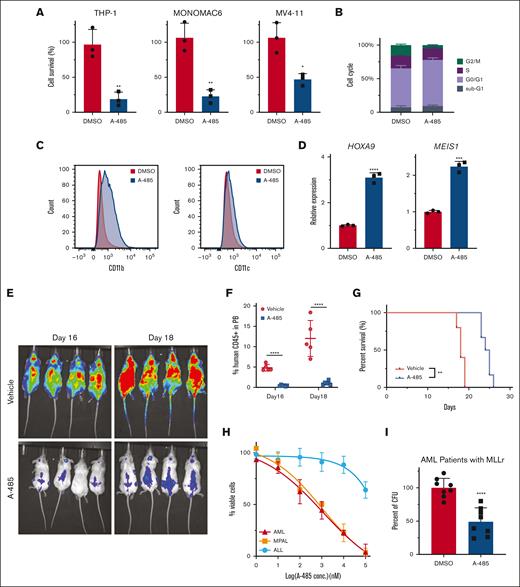
Inhibition of EP300 using A-485 was assessed in various human leukemia cell lines (Figure 7A; supplemental Figure 6A). In the majority of MLLr cell lines, A-485 treatment recapitulated results observed in mouse LSCs with G0/G1 cell-cycle arrest, apoptosis induction, and prominent differentiation (Figure 7B,C; supplemental Figure 6B,C). There was increased expression of MLLr target genes HOXA9 and MEIS1 (Figure 7D), further suggesting that the role of EP300 in MLLr AML is independent of the HOX/MEIS pathway. Mice that underwent transplantation with the THP-1 cells showed a significant delay in leukemia progression after administration of A-485, as indicated by a substantially reduced bioluminescence signal, decreased human CD45+ cells in peripheral blood, and improved survival (Figure 7E-G; supplemental Figure 6D,E). Similarly, A-485 treatment of MLL-AF9 leukemias induced by CRISPR gene editing substantially impaired growth of myeloid (AML) and mixed phenotype acute leukemias, in contrast with the minimal effect on MLL-AF9 acute lymphocytic leukemia (Figure 7H).17 A-485 also inhibited the growth of primary patient MLLr AML cells (Figure 7I; supplemental Figure 6F). Taken together, these results demonstrate that the inhibition of EP300 has strong antileukemia activity in human myeloid lineage leukemias (supplemental Figure 6G) and further highlight the therapeutic efficacy of EP300 inhibition in MLLr AML.
A-485 has a robust antileukemic effect on primary AML cells. (A) The effect of A-485 on the growth of human MLLr AML cell lines. Cell lines were exposed to A-485 at 1 μM for 48 hours (n = 3; mean ± SD). (B) Cell-cycle profile in THP-1 with A-485 (1uM) treatment for 48 hours (n = 3; mean ± SD). (C) Surface expression of CD11b and CD11c in THP-1 cells with A-485 (1 μM) treatment for 48 hours. (D) HOXA9 and MEIS1 expression in THP-1 cells treated with A-485 (1 μM) treatment for 48 hours (n = 3; mean ± SD). (E) Representative bioluminescent imaging of NSG recipient mice that underwent transplantation with THP-1 cells at indicated A-485 treatment time. (F) Frequencies of leukemia cells (hCD45+) in the peripheral blood. (n = 5; mean ± SD). (G) Kaplan-Meier plot of A-485– and vehicle-treated mice that underwent transplantation with THP-1 cells. P value was generated using Mantel-Cox log-rank test. (H) Dose dependent effect of A-485 inhibitor on CRISPR-engineered acute leukemias bearing MLL-AF9 translocation. Cells were exposed to the indicated concentrations of A-485 for 48 hours (n = 3; mean ± SD). (I) Clonogenic assays with primary MLLr AML cells from patients treated with A-485. (n = 8; mean ± SD). ∗P < .05; ∗∗P < .01; ∗∗∗P < .001; ∗∗∗∗P < .0001.
A-485 has a robust antileukemic effect on primary AML cells. (A) The effect of A-485 on the growth of human MLLr AML cell lines. Cell lines were exposed to A-485 at 1 μM for 48 hours (n = 3; mean ± SD). (B) Cell-cycle profile in THP-1 with A-485 (1uM) treatment for 48 hours (n = 3; mean ± SD). (C) Surface expression of CD11b and CD11c in THP-1 cells with A-485 (1 μM) treatment for 48 hours. (D) HOXA9 and MEIS1 expression in THP-1 cells treated with A-485 (1 μM) treatment for 48 hours (n = 3; mean ± SD). (E) Representative bioluminescent imaging of NSG recipient mice that underwent transplantation with THP-1 cells at indicated A-485 treatment time. (F) Frequencies of leukemia cells (hCD45+) in the peripheral blood. (n = 5; mean ± SD). (G) Kaplan-Meier plot of A-485– and vehicle-treated mice that underwent transplantation with THP-1 cells. P value was generated using Mantel-Cox log-rank test. (H) Dose dependent effect of A-485 inhibitor on CRISPR-engineered acute leukemias bearing MLL-AF9 translocation. Cells were exposed to the indicated concentrations of A-485 for 48 hours (n = 3; mean ± SD). (I) Clonogenic assays with primary MLLr AML cells from patients treated with A-485. (n = 8; mean ± SD). ∗P < .05; ∗∗P < .01; ∗∗∗P < .001; ∗∗∗∗P < .0001.
Discussion
High-throughput methods to comprehensively map enhancer regions in cancer cells have unveiled global reprogramming of enhancer activities associated with malignant transformation. The repertoires of active enhancers also reveal enhancer signatures in cancers, particularly in hematopoietic malignancies.47 The evidence for alterations in enhancer landscapes, including HOXA9-dependent enhancer reorganization,34 active Rara enhancer clusters in AML,15 and COMPASS-mediated enhancer regulation,48 support the role of enhancer malfunction in contributing to the pathogenesis of leukemia. However, most prior studies focused on enhancer profiling of bulk AML populations, making it difficult to define the enhancer landscape in LSCs. Here, we report studies that map and delineate the enhancer landscape of LSCs in MLLr AML. Through functional validation, we discovered genome-wide enhancer malfunction in LSCs, in which a transcriptional regulatory network is organized by the actions of hematopoietic TFs and active enhancers. TF-specific requirements for coregulators uncovered EP300 as a coordinator of transcriptional regulatory networks for LSC maintenance. In the presence of the inhibitor A-485, enhancers and TF-linked transcriptional regulatory networks collapsed, and enhancer-mediated gene expression in LSCs was abrogated. Thus, A-485 has potent antileukemia activity and displays promising preclinical efficacy in MLLr myeloid leukemia.
Our study provides insight into LSC oncogenic potential at a genome-wide level. It integrates H3K27ac/H3K4me1 histone ChIP as an epigenetic indicator of enhancer loci and activity, with gene expression as the final output. Although individually these assays are capable of identifying regulatory element domains, the analytical methods described here specifically report on systematically identifying enhancer regions and their activities and using them to define the densely interconnected transcriptional regulatory networks of LSCs. The combination of these assays facilitates accurate inference of gene regulatory relations. However, our epigenomic assays do not resolve enhancer-gene interactions. Chromosome conformation capture assays, such as H3K27ac HiChIP,49 are rapidly developing and may soon be amenable to appraise enhancer regulatory network heterogeneity within LSCs.
Previous studies revealed the association between HDAC1 and transcriptional repression via its deacetylase activity.50,51 Our data show the proximity of enhancers occupied by EP300 and HDAC1. Therefore, dynamic H3K27 acetylation at enhancers was closely associated with EP300 and HDAC1, and it required writing and erasing these marks. We observed an unexpected increase in average H3K27ac at transcription start sites of all genes, even A-485 was sufficient to decrease global H3K27ac. These observations indicate that the H3K27 acetylation is more stable at promoters than that at enhancers, and other promoter-associated transcription regulators maintain promoter H3K27ac integrity via homeostatic processes.
Targeting enhancers and enhancer-supported gene networks provides a potential approach for therapy if active enhancers can be reprogrammed to less active primed or poised states. To this end, EP300 acetylation can be perturbed with A-485, which has outstanding cellular and pharmacokinetic properties and represents a new chemotype. These properties of A-485 make it suitable for definitive biological interrogation of the effects of HAT inhibition in both in vitro and in vivo settings. A number of studies have reported different EP300/CREBBP inhibitors targeting HAT bromodomains, and these compounds abolish enhancer activities via an indirect mechanism, by blocking the interaction between BRD4 and superenhancers.52,53 Conversely, A-485 directly erases H3K27ac at enhancers and shows more rapid kinetics than other HAT inhibitors in MLLr AML.
Previous studies have shown a prominent role for the HOX/MEIS regulatory axis in MLLr AML and that targeting components of the MLL complex induces AML cell differentiation via the downregulation of the HOX cluster and MEIS family genes.54,55 In this study, EP300 knockdown and A-485 treatment of murine and human MLLr leukemia cells did not adversely affect the expression of these canonical MLLr target genes despite potent adverse effects on AML survival and differentiation. Although previous studies demonstrated that the HOXA9/MEIS1 axis serves a critical role in the regulation of core transcriptional programs activated in MLLr leukemia, our study highlights an additional pathway for the novel function of enhancers in mediating malignant myeloid transformation independent of HOXA9/MEIS1. Nevertheless, there is partial overlap between gained enhancers and HOXA9 binding sites in MLLr leukemia, which suggests a role for interconnected yet relatively independent transcriptional regulatory networks driven by tumor-gained enhancers and the HOXA9/MEIS1 axis, respectively. Future studies should focus on further defining the interrelationships of these pathways systematically.
Reversing the natural history of AML requires new therapies that effectively target LSCs from the outset because they serve as the reservoir for evolving resistance to conventional and targeted therapies. This requires identification of approaches that target LSCs and potentially neutralize their adaptive potential.56,57 Here, we identified EP300 as a targetable dependency in LSCs. Our results suggest that MLLr activates enhancers to regulate LSC genes via H3K27ac, which enables an EP300 dependent transcriptional regulatory network. Selective and potent inhibition of EP300 credentials a rational approach for the translation of our findings into clinical setting applications.
Acknowledgments
The authors thank Y. Zhang and members of the Cleary lab for helpful discussions. The authors also thank the staff at the Veterinary Service Center, PAN facility, FACS facility, SFGF sequencing core, and Genetics Bioinformatics Service Center at Stanford University.
This study was supported by National Institutes of Health, National Cancer Institute grant R01CA116606 (M.L.C.), Alex’s Lemonade Stand Foundation (F.P.), and Stanford Maternal & Child Health Research Institute (F.P.).
Authorship
Contribution: F.P. and M.L.C. conceptualized the project and wrote the manuscript; F.P. designed and performed experiments and analyzed data; M.I. and X.Y. performed transplantation experiments; W.W., Y.J., and Z.Z. performed drug treatment on human patient cells; L.Z. interpreted the data; M.L.C. supervised the entire project; and all authors reviewed and edited the manuscript.
Conflict-of-interest disclosure: The authors declare no competing financial interests.
Correspondence: Michael L. Cleary, Department of Pathology and Pediatrics, Stanford University, Lokey Stem Cell Research Building, Room G2034, 1291 Welch Rd, Stanford, CA 94305; e-mail: mcleary@stanford.edu.
References
Author notes
The ChIP-seq and RNA-seq data reported in this article have been deposited in the Gene Expression Omnibus database (accession number GSE199788).
Data are available on request from the corresponding author, Michael L. Cleary (mcleary@stanford.edu).
The full-text version of this article contains a data supplement.

