

Key Points
Preplatelets and barbell platelets are equivalent to reticulated/immature platelets.
Preplatelets are a subpopulation of large platelets that can transform into barbells and undergo fission during maturation.

Abstract
Circulating large “preplatelets” undergo fission via barbell platelet intermediates into two smaller, mature platelets. In this study, we determine whether preplatelets and/or barbells are equivalent to reticulated/immature platelets by using ImageStream flow cytometry and super-resolution microscopy. Immature platelets, preplatelets, and barbells were quantified in healthy and thrombocytopenic mice, healthy human volunteers, and patients with immune thrombocytopenia or undergoing chemotherapy. Preplatelets and barbells were 1.9% ± 0.18%/1.7% ± 0.48% (n = 6) and 3.3% ± 1.6%/0.5% ± 0.27% (n = 12) of total platelet counts in murine and human whole blood, respectively. Both preplatelets and barbells exhibited high expression of major histocompatibility complex class I with high thiazole orange and Mitotracker fluorescence. Tracking dye experiments confirmed that preplatelets transform into barbells and undergo fission ex vivo to increase platelet counts, with dependence on the cytoskeleton and normal mitochondrial respiration. Samples from antibody-induced thrombocytopenia in mice and patients with immune thrombocytopenia had increased levels of both preplatelets and barbells correlating with immature platelet levels. Furthermore, barbells were absent after chemotherapy in patients. In mice, in vivo biotinylation confirmed that barbells, but not all large platelets, were immature. This study demonstrates that a subpopulation of large platelets are immature preplatelets that can transform into barbells and undergo fission during maturation.
Introduction
Platelets are anucleate, discoid blood cells that originate from bone marrow megakaryocytes.1 As human platelets exhibit a short lifespan of ∼10 days, >100 billion new platelets are required per day to sustain the platelet count (150-400 × 109/L).2 The youngest platelets are termed reticulated platelets (RPs)3 and were first described in acute blood loss.4 RPs traditionally have been measured by flow cytometry with nucleic acid dyes (eg, thiazole orange [TO]).5 Biotinylation studies performed in mice have also confirmed that they are immature platelets.3 RP levels can distinguish between thrombocytopenic conditions related to enhanced peripheral destruction or lack of production.6-8 Commercial methods for quantification include the immature platelet fraction (IPF),9,10 which although standardized tends to overestimate numbers in macrothrombocytopenia and bone marrow suppression/failure due to nonspecific labeling.11,12 Recent efforts have tried to overcome such limitations identifying HLA-I (major histocompatibility complex class I) as a potential new marker of platelet immaturity.13
During maturation, megakaryocytess form long proplatelet extensions that can subsequently release platelets.14-16 These proplatelets are released into the bone marrow sinusoids, with platelet maturation continuing within the bloodstream16-19 and the lungs.20,21 Furthermore, proplatelet-like barbell structures (consisting of a continuous, barbell-shaped marginal band) undergo fission in vitro to form progeny, thus increasing the count.22 This finding led to the discovery of a new terminal stage of maturation that takes place in the bloodstream through a platelet intermediate, the “preplatelet.”18 Balduini has recently highlighted that similar structures and platelet division were originally described by Perroncito in 1921.23 Circulating preplatelets are large platelet precursors (3-10 μm)24 that divide by converting into barbells before undergoing fission into mature platelets (<3 μm).18,22 These structures have been identified and quantified in healthy human platelet-rich plasma using laser scanning cytometry (3.6% and 0.05%, respectively).18,24 However, barbells have rarely been reported, probably because both IPF and blood film analyses use EDTA-anticoagulated blood, causing swelling and irreversible conversion of barbells back into preplatelets.24
Although the current dogma is that preplatelets and barbells represent intermediate structures that undergo fission, it is still unknown whether this exclusively occurs within immature platelets. Therefore, we applied ImageStream flow cytometry (ISFC) to detect and quantify both preplatelets and barbells directly in whole blood. ISFC enables full preplatelet and barbell characterization, because it combines the speed, sensitivity, and phenotyping abilities of conventional flow cytometry with single-cell morphological and content resolution.25,26 By designing a new ISFC method to accurately discriminate preplatelets and barbells, for the first time to our knowledge, we have quantified and characterized these structures in healthy and thrombocytopenic human and mouse blood and demonstrated their equivalence to immature platelets. We also confirmed that these structures can undergo terminal maturation via fission and propose that morphometric quantification of preplatelet-derived barbells could be used in addition to platelet counts and IPF for diagnosing and managing thrombocytopenia.
Materials and methods
Patient recruitment
This study was approved by the NHS Research and Ethics Committee (NHS REC; 15/WM/0465) and by the University Hospitals Birmingham NHS Foundation Trust (RRK 5677). The study was performed in accordance with the Declaration of Helsinki. Healthy control subjects, patients with immune thrombocytopenia (ITP), and those with hematological malignancies who are undergoing chemotherapy-induced bone marrow ablation, were recruited. Blood samples were anticoagulated in EDTA-, trisodium citrate–, and hirudin-coated BD Vacutainers (Fisher Scientific and Roche, respectively). See supplemental Methods and supplemental Table 1 for details.
Mice
Wild-type (WT) C57BL/6 mice were of mixed sex and between 8 and 12 weeks of age. All animal procedures were undertaken with United Kingdom Home Office approval under project license (P46252127).
Antibodies and probes
Whole blood or washed platelets were labeled with anti-human BV421 CD62p (P-selectin; 1:100, AK4; 304926; BioLegend), BV421 CD42b (1:300, HIP1, 303930; BioLegend), fluorescein isothiocyanate (FITC) CD61 (β3; 1:25, RUU-PL7F12; 348093; BD), TO (200 ng/mL; 390062; Sigma), phycoerythrin (PE) CD42b (GPIbα 1:50, HIP1, 555437; BD), PE CD62p (1:100, AK4; 304906; BioLegend), AF599 Mitotracker Ros CMX (mitochondrial dye 5 μM; 9082; Cell Signaling), allophycocyanin (APC) CD62p (1:100, AK4; 304910; BioLegend), and/or APC HLA I (1:100, W6/32; 311410; BioLegend); or anti-mouse BV421-CD62p (1:100, VI P-44; 304926; BioLegend), FITC-CD41a (1:100, MWReg30; 133904; BioLegend), FITC-conjugated streptavidin (1:10, 405201; BioLegend), BD Retic-count (349204; BD), and/or APC-CD41 (1:100; MWReg30; 17-0411-82; ThermoFisher). A polyclonal rat anti-mouse GPIb antibody (R300; Emfret) was used to induce thrombocytopenia in mice. Isotypes BV421 mouse IgG1 (1:100; MOPC-21; 400157; BioLegend), BV421 rat IgG1(1:100, A110-1; 562604; BD), PE or APC mouse IgG1 (1:100; MOPC-21; 400112 and 400120, respectively; BioLegend) were used to quantify CD62p exposure. Fluorescence Minus One was used for all other markers. AF674 SiR tubulin probe (4 μM; CY-SC002; SpiroChrome) was used for ISFC tubulin labeling.
Hematology analyzers
Human and mouse samples were analyzed on the XN1000 (Sysmex, Milton Keynes, United Kingdom) and ABX Pentra 60 (Horiba, Northampton, United Kingdom) hematology analyzers, respectively. Platelet counts, IPF, and mean platelet volume (MPV) were recorded.
Blood smears
Human whole blood was stained with modified Giemsa stain (see manufacturer’s guidelines; 102164; Gentaur).
Washing platelets
Platelets were washed as previously described.27 After the washing steps, the platelets were resuspended and diluted in serum-free M199 medium to 100 × 103/μL.
Platelet incubations
For all incubations, platelets were incubated in M199 medium (31150022; ThermoFisher) and maintained in suspension using a microplate mixer (300 rpm; N2400; StarLab-8040). Incubations were either conducted on the bench (21°C) or within a cell incubator (37°C). For whole blood experiments, 1 mL of blood was incubated in a 5-mL polypropylene tube for 0, 0.25, 1.5, or 3 hours. For washed platelets, 100 × 103/μL platelets were incubated for 0, 1.5, 3, 6, or 24 hours.
To inhibit platelet aggregation, whole blood was incubated with 10 μM eptifibatide (SML1042; Sigma) and incubated for 3 hours at 21°C. For disruption of cytoskeletal signaling, washed platelets were incubated with nocodazole (10 μM; M1404; Sigma) or cytochalasin D (1 or 0.1 μM; C6762; Sigma). To inhibit mitochondrial respiration, washed platelets were treated with rotenone (3 μg/mL; R8875; Sigma). For dual cytosolic labeling, washed platelets were incubated with CellTrace™ carboxyfluorescein diacetate succinimidyl ester (green) or red (0.2 and 1 μg/mL, C34570 and C34572, respectively; ThermoFisher) for 30 minutes and centrifuged at 1000g for 10 minutes with 1 μM prostacyclin I2 (61849-14-7; Cayman). Green- and red-labeled platelets were resuspended in serum-free M199 medium at 100 × 103/μL, mixed, and incubated for 3 hours. Similar experimental conditions and methodology were used to track preplatelet maturation using labeling with CellTrace™ yellow (2 μg/mL; C34573; ThermoFisher).
For TRAP-induced degranulation, washed platelets were incubated with CellTrace™ yellow (2 μg/mL) for 30 minutes at room temperature. Labeled platelets were centrifuged at 1000g for 10 minutes with 1 μM prostacyclin I2 to remove dye precipitates and then resuspended in Tyrode’s buffer (100 × 106/mL). CellTrace™ yellow–labeled platelets were exposed to increasing concentrations of TRAP (1, 10, 100, or 1000 μM) for 30 minutes at room temperature to induce degranulation and fixed in 2% formalin for 10 minutes. Platelets were identified by ISFC, using anti-human FITC CD61(1:25), and granule release was determined by anti-human BV421 CD62p (1:100). For negative controls, washed platelets were incubated for 30 minutes without TRAP, and a BV421 mouse IgG1 k isotype control (1:100, Clone: MOPC-21, 400158; BioLegend) was used to set a positive gate at 1% of the negative peak.
Thrombocytopenia in mice
To induce thrombocytopenia, WT C57BL/6 mice received an intraperitoneal injection of polyclonal rat anti-mouse GPIbα antibody (final concentration, 1.5 μg/g). Platelet counts were measured in tail bleeds on days 0 (before challenge), 1, 5, and 8. For preplatelet and barbell ISFC analysis, mice were culled by terminal bleed (in 1:10 volume 4% trisodium citrate) on day 5.
In vivo platelet biotinylation
WT C57BL/6 mice received 2 IV injections of NHS-biotin (4 mg/mL in saline; H1759; Sigma) 30 minutes apart to ensure that the circulating and splenic pools of platelets were labeled. A tail bleed was performed at 1 and 24 hours after the second IV injection, to measure the percentage of biotin-positive platelets. At 24 hours, the mice were also culled via terminal bleed, and whole blood was anticoagulated in a 1:10 volume of 4% trisodium citrate.
Flow cytometry
RPs and biotin-positive platelets were measured on the Accuri™ C6 (supplemental Methods).
ISFC
ISFC was performed with the ImageStreamX MKII single-camera system with brightfield, side-scattered light (SSC) and 405 nm (60 mW), 488 nm (80 mW), and 642 nm (100 mW) lasers. Images were captured using a ×60 objective lens (Olympus; per pixel area 0.33 μm2, depth of field 2.5 μm, NA 0.9 μm and field of view 40 μm). Acquisitions consisted of 10 000 platelet images (anti-human FITC CD61 Figures 1A, 2B, and 3-5) or BV421 CD42b (Figure 2A), anti-mouse FITC (Figure 6A-D), or APC CD41 fluorescence (Figure 6E-F). For human preplatelet and barbell measurements (Figures 2-5), antibody panels consisted of BV421 CD62p, channel 1 (CH01); FITC CD61, CH02; AF599 Mitotracker Ros CMX, CH04; and brightfield, CH04 or CH06. For tubulin analyses panels consisted of BV421 CD62p, CH01; FITC CD61, CH02; and AF674 SiR-Tubulin, CH05. For immature platelet markers, the panels included BV421 CD42b, CH01; TO, CH02; Mitotracker Ros CMX, CH03; PE CD62p CH04; APC HLA-I, CH05; and SCC, CH06. For mice preplatelet and barbell analyses, panels consisted of BV421 CD62p, CH01; FITC CD61, CH02; and brightfield, CH04 (Figure 6A-D); and for biotinylation, they included BV421 CD62p, CH01; FITC streptavidin, CH02; brightfield, CH04; and APC CD41, CH05 (Figure 6E-F).
Captured images were analyzed and optimized (fluorescent RMS gradient, >20) using Image Data Exploration and Analysis Software. To determine barbell gating, truth populations consisting of single circular or barbell platelets were manually selected and individually combined with pixel mask morphology (all pixels from within the outermost contour), skeleton thin (a 1-pixel-wide skeletal line within an object), and erode (removes the outermost pixels from the default mask) to generate relative difference statistical feature tables. Features were chosen based on relative difference scores and visualized to determine optimal feature parameters to discriminate barbells from all other platelets. Preplatelets and barbells were determined by the feature’s intensity (total pixel intensities within a mask), aspect ratio (ratio of the minor axis divided by the major axis; 1 = circular), area (size of the mask in μm2), diameter (diameter of a circle that is the same area as the object), compactness (density of pixel intensities within the object), symmetry2 (tendency of an object to have 2 lobes with a single axis of elongation), height (based on a bounding rectangle where the longer side is the height), or minor and major axis intensity (narrowest or widest region of an object).
For preplatelet and barbell gating, all analyses were performed on CD62p− platelets, to exclude microaggregates. For preplatelet quantification, a CD61, CD41, or CD42b morphology pixel mask was designed to generate the feature’s aspect ratio and area of platelet images. Preplatelets were determined by an aspect ratio score of 0.8 to 1. From this, an erode+4-pixel mask was designed to determine preplatelets with a diameter ≥3 μm. For barbell quantification, resting elongated platelets were discriminated from circular/discoid platelets by using the compactness and height × symmetry2 feature measurements of the CD61 morphology mask. From this, a skeleton thin mask was designed to depict a single-pixel-thick cytoskeletal line of the barbell structure, and the barbells were determined by a low minor axis intensity of CD61 morphology and high area × minor axis intensity of the CD61 skeleton thin mask (the barbell gate; supplemental Figure 3, for visualization and description).
As no barbell platelets were present at 21°C, characterization of barbell-shaped microaggregates was completed in 21°C citrate anticoagulated blood (using EDTA blood as a negative control), using an ISFC methodology similar to the barbell analysis, where microaggregates were discriminated from elongated platelets by high symmetry2 and fluorescence intensity of a CD61 morphology mask.
Immunofluorescence microscopy
For a description of the procedures see supplemental Methods.
Statistical analysis
All data analyses were performed with Prism v8.4.3 (GraphPad Software, San Diego, CA). Statistical analyses are described in the figure legends.
Results
Preplatelets and barbells are immature RPs in human blood
In this study, a novel ISFC strategy was developed to accurately detect and quantify preplatelets and barbells in whole blood (supplemental Figures 1-3; details on the preanalytical variables: labeling, detection, and gating, respectively). Preplatelets are detected as rounded structures that can be distinguished and resolved from platelets by their size (>3 μm in diameter),24 whereas barbells have a unique appearance that distinguishes them from platelet doublets and microaggregates that are CD62p+and composed of 2 individual platelets (supplemental Figure 1-2). Figure 1Ai-iii shows several examples of labeling of the marginal tubulin band and CD61 (integrin subunit β3) in platelets, preplatelets, and barbells.
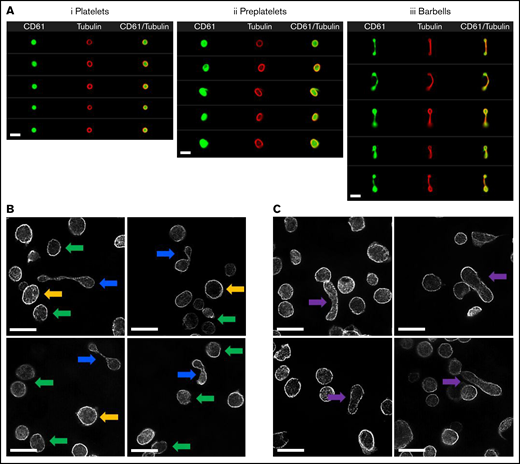
Imaging of platelets, preplatelets, and barbells in normal human blood. (A) Healthy control trisodium citrate blood was labeled immediately after phlebotomy with FITC anti-CD61 and AF674 SiR tubulin (4 μM) for 30 minutes at 37°C, and 10 000 CD61+ platelet images were acquired with ISFC. SiR tubulin labeling clearly depicts the marginal band of platelets, preplatelets (ii), and barbell platelets (iii), discriminated by ISFC (×60 magnification). Images are representative of a single experiment (n = 5). Bars represent 7 μm. (B) Platelet-rich plasma were separated from citrated whole blood immediately after phlebotomy at 37°C and were labeled for α-tubulin and imaged using super-resolution structured illumination microscopy. Original magnification, ×100; n = 3. Circular platelets (≤3 μm; green arrows) and preplatelets (≥3 μm; yellow arrows) are shown along with barbell platelets (blue arrows). (C) Circular platelets are shown along with intermediate elongated preplatelets (purple arrows). Bars represent 5 μm.
Imaging of platelets, preplatelets, and barbells in normal human blood. (A) Healthy control trisodium citrate blood was labeled immediately after phlebotomy with FITC anti-CD61 and AF674 SiR tubulin (4 μM) for 30 minutes at 37°C, and 10 000 CD61+ platelet images were acquired with ISFC. SiR tubulin labeling clearly depicts the marginal band of platelets, preplatelets (ii), and barbell platelets (iii), discriminated by ISFC (×60 magnification). Images are representative of a single experiment (n = 5). Bars represent 7 μm. (B) Platelet-rich plasma were separated from citrated whole blood immediately after phlebotomy at 37°C and were labeled for α-tubulin and imaged using super-resolution structured illumination microscopy. Original magnification, ×100; n = 3. Circular platelets (≤3 μm; green arrows) and preplatelets (≥3 μm; yellow arrows) are shown along with barbell platelets (blue arrows). (C) Circular platelets are shown along with intermediate elongated preplatelets (purple arrows). Bars represent 5 μm.
To characterize these structures in greater detail, α-tubulin–labeled platelet-rich plasma was imaged using super-resolution structured illumination microscopy. Compared with platelets (green arrows), barbell platelets consisted of a marginal band with microtubules extending through the narrow cytoplasmic bridge or shaft, which looped back at the distal ends to form 2 teardrop-shaped structures (Figure 1B, blue arrows). Large preplatelets (yellow arrows) and a new population of intermediate elongated preplatelets, characterized by an oval-shaped marginal band (Figure 1C, purple arrows), were resolved and appeared to be in the process of forming barbells. By ISFC, preplatelets and barbells can be further distinguished from platelets by their greater granularity (SCC), labeling with the immature platelet markers TO, HLA-I, and Mitotracker, which detected platelets containing a greater number of mitochondria (Figure 2A). The ISFC protocol (supplemental Figure 3) showed the mean number of preplatelets and barbells in whole blood to be 3.3% ± 1.6% and 0.5% ± 0.27% (n = 12) of the platelet population, respectively, correlating with the %IPF (Figure 2B). These data suggest that preplatelets and barbells are immature.

Quantification of RPs, preplatelets, and barbells in human whole blood. Healthy control trisodium citrate–anticoagulated whole blood was labeled immediately after phlebotomy with anti-CD42b BV421 and TO, Mitotracker AF599, or anti-HLA-I APC (n = 5; bar represents 7 μm), and granularity was determined by SCC light. (A) Representative images of preplatelets and barbells with each label are shown. Mean fluorescence intensity (MFI) was normalized to the cellular perimeter. (B) Under the same conditions, citrate blood was labeled with anti-CD61 FITC and CD62p BV421 for 15 minutes at 37°C, %IPF platelets was measured by Sysmex XN1000, and preplatelets and barbells were quantified by ISFC and correlated with IPF (n = 12). (A-B) One-way analysis of variance with Dunnett’s multiple-comparisons test ±1 standard deviation; (B) Pearson’s correlation coefficient. *P < .05; **P < .01; ***P < .001; ****P < .0001.
Quantification of RPs, preplatelets, and barbells in human whole blood. Healthy control trisodium citrate–anticoagulated whole blood was labeled immediately after phlebotomy with anti-CD42b BV421 and TO, Mitotracker AF599, or anti-HLA-I APC (n = 5; bar represents 7 μm), and granularity was determined by SCC light. (A) Representative images of preplatelets and barbells with each label are shown. Mean fluorescence intensity (MFI) was normalized to the cellular perimeter. (B) Under the same conditions, citrate blood was labeled with anti-CD61 FITC and CD62p BV421 for 15 minutes at 37°C, %IPF platelets was measured by Sysmex XN1000, and preplatelets and barbells were quantified by ISFC and correlated with IPF (n = 12). (A-B) One-way analysis of variance with Dunnett’s multiple-comparisons test ±1 standard deviation; (B) Pearson’s correlation coefficient. *P < .05; **P < .01; ***P < .001; ****P < .0001.
Preplatelets and barbells in acquired thrombocytopenia
Preplatelets and barbells were quantified by ISFC within ITP whole blood samples (n = 7) relative to control blood samples (n = 12). ITP was characterized by low platelet counts (mean, 46.5 ± 36.9 × 10⁹/L vs 250.9 ± 52.5 × 10⁹/L), a higher MPV (mean, 12.3 ± 0.8 fL vs 9.7 ± 0.8 fL), and a higher percentage of immature platelets (IPF mean, 20.5% ± 12.7% vs 4.1% ± 1.7%; supplemental Figure 4). The percentage of preplatelets (10.5% ± 4.7%) and barbells (1.8% ± 1.6%) in ITP samples was significantly (P < .05) greater than in control samples (3.2% ± 1.5% and 0.46% ± 0.21%, respectively) and correlated with the increase in the %IPF (Figure 3A). Although preplatelets and barbells in ITP showed similar labeling for tubulin (Figure 3B), they were significantly (P < .05) larger than in the controls (∼10% increase, respectively; Figure 3B-C). Sex had no effect on the measurements, but an increase in sample size is needed to definitively show this (supplemental Table 1).
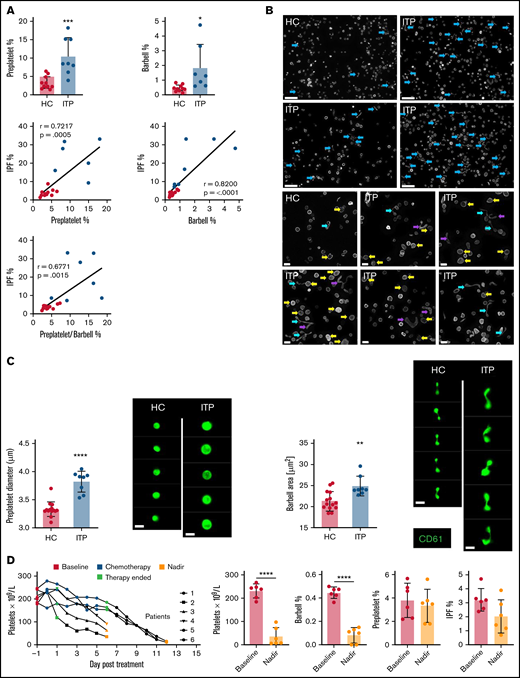
Quantifying reticulated platelets, preplatelets, and barbells in acquired thrombocytopenia. All measurements were performed in trisodium citrate–anticoagulated whole blood. (A) Healthy control (HC; green dots; n = 12) and ITP (red dots; n = 7) blood was incubated at 37°C for 1.5 hours; platelet count, MPV, and IPF were measured by the XN1000 hematology analyzer (Sysmex); and preplatelets and barbells were measured by ISFC with correlations between IPF% and preplatelets and/or barbells. (B) α-Tubulin immunofluorescence imaging of control and ITP platelet-rich plasma displaying preplatelets (yellow arrows), barbells (blue arrows), and elongated preplatelets (purple arrows; n = 3; Leica DM6000 wide-field microscope, ×60 magnification; bars represent 5 μm). (C) Mean diameter of preplatelets and area of barbell platelets measured by ISFC in healthy control blood (n = 15) vs ITP blood (n = 8; bar represents 7 μm). (D) Blood samples were taken from patients with high-grade lymphoma or myeloma before chemotherapy (baseline; day −1), 5-7 days after stem cell autograft (nadir). Platelet counts and IPF were measured by the XN1000 analyzer and preplatelets and barbells by ISFC (n = 6). (A-B,D) Unpaired t-test ±1 standard deviation. (A) Pearson’s correlation coefficient. *P < .05, **P < .01, ***P < .001; ****P < .0001.
Quantifying reticulated platelets, preplatelets, and barbells in acquired thrombocytopenia. All measurements were performed in trisodium citrate–anticoagulated whole blood. (A) Healthy control (HC; green dots; n = 12) and ITP (red dots; n = 7) blood was incubated at 37°C for 1.5 hours; platelet count, MPV, and IPF were measured by the XN1000 hematology analyzer (Sysmex); and preplatelets and barbells were measured by ISFC with correlations between IPF% and preplatelets and/or barbells. (B) α-Tubulin immunofluorescence imaging of control and ITP platelet-rich plasma displaying preplatelets (yellow arrows), barbells (blue arrows), and elongated preplatelets (purple arrows; n = 3; Leica DM6000 wide-field microscope, ×60 magnification; bars represent 5 μm). (C) Mean diameter of preplatelets and area of barbell platelets measured by ISFC in healthy control blood (n = 15) vs ITP blood (n = 8; bar represents 7 μm). (D) Blood samples were taken from patients with high-grade lymphoma or myeloma before chemotherapy (baseline; day −1), 5-7 days after stem cell autograft (nadir). Platelet counts and IPF were measured by the XN1000 analyzer and preplatelets and barbells by ISFC (n = 6). (A-B,D) Unpaired t-test ±1 standard deviation. (A) Pearson’s correlation coefficient. *P < .05, **P < .01, ***P < .001; ****P < .0001.
Chemotherapy (in the context of autologous stem cell transplantation) mediates bone marrow ablation and terminates platelet production and can therefore be used to verify whether preplatelets and barbells are part of the newly formed IPF. Preplatelets and barbells were quantified in whole blood from patients (n = 6) with lymphoma or myeloma, before and after chemotherapy. The patients’ mean platelet counts and %IPF before bone marrow ablation were 231 ± 27 × 109/L and 3.2% ± 0.74%, respectively. Preplatelet and barbell levels were 3.8% ± 1.3% and 0.45% ± 0.04%, respectively (Figure 3D). Post chemotherapy platelet counts were significantly reduced (35.0 ± 35.5 × 10⁹/L), but surprisingly, the proportion of IPF and preplatelets was not significantly different (2.0% ± 1.1% and 3.3% ± 1.3%, respectively). In contrast, barbells were rarely detected (0.08% ± 0.06%; Figure 3D) suggesting that they are formed from immature platelets that will be absent after bone marrow ablation. Large platelets (>3 μm in diameter) must also therefore represent mature platelets and are a heterogeneous population of different ages, including immature preplatelets.
Preplatelets convert into barbells that can undergo fission
Previous studies have reported that preplatelet and barbell transformations are promoted when washed platelets are incubated under cell culture conditions in serum-free M199 medium at 37°C.22 To study barbell formation in vitro by ISFC, human control citrate blood and washed platelets were incubated at 37°C in M199 medium for up to 24 hours. Barbell formation significantly increased ∼4 times in washed platelets compared with that in whole blood up to 3 hours, and perimeter measurements and tubulin labeling confirmed that they originated from platelets >3 μm in diameter and shared morphology similar to that of human barbells (Figure 4A; supplemental Figure 1-3). Figure 4B demonstrates that barbells were detected 1.5 to 6 hours but were completely absent by 24 hours. There was an inverse relationship between the decreasing number of preplatelets with increasing barbells over time (Figure 4B). Dual labeling of washed platelets with cytosolic CellTrace™ green or red cytosolic dyes confirm that barbells originate from single large platelets (Figure 4C).
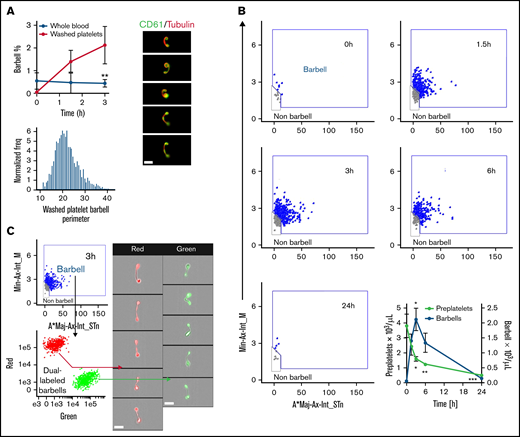
Kinetics of preplatelet maturation. (A) Whole blood and washed platelets anticoagulated with trisodium citrate (citrate blood) was incubated for 3 hours at 37°C to determine change in barbell formation quantified by ISFC at 0, 1.5, and 3 hours and labeled with FITC anti-CD61 and AF674 SiR tubulin (4 μM; n = 6). Washed platelet barbell perimeter measured by ISFC (n = 6). SiR tubulin live-cell labeling of washed platelet barbells (n = 3; bar represents 7 μm). (B-C) Experiments were conducted with washed platelets from human control citrate blood incubated in M199 medium at 37°C for a maximum of 24 hours. (B) Barbell platelet formation at 0, 1.5, 3, 6, and 24 hour time points (visualized using the image flow cytometry barbell gate described in supplemental Figure 3). Quantification of preplatelets and barbells at 0, 1.5, 3, 6, and 24 hour time points (n = 10). (C) before incubation, washed platelets were labeled with either CellTrace™ green (0.2 μg/mL) or red (1 μg/mL) cytosolic dyes, mixed, and incubated for 3 hours to demonstrate that barbells originate from single platelets (n = 3; imaged by ISFC, ×60 magnification; bars represent 7 μm). A*Maj-Ax-Int, area × major axis intensity; Min-Ax-Int, minor axis intensity. (A-B) Two-way analysis of variance with Bonferroni multiple-comparisons test ±1 standard deviation. *P < .05, **P < .01, ***P < .001.
Kinetics of preplatelet maturation. (A) Whole blood and washed platelets anticoagulated with trisodium citrate (citrate blood) was incubated for 3 hours at 37°C to determine change in barbell formation quantified by ISFC at 0, 1.5, and 3 hours and labeled with FITC anti-CD61 and AF674 SiR tubulin (4 μM; n = 6). Washed platelet barbell perimeter measured by ISFC (n = 6). SiR tubulin live-cell labeling of washed platelet barbells (n = 3; bar represents 7 μm). (B-C) Experiments were conducted with washed platelets from human control citrate blood incubated in M199 medium at 37°C for a maximum of 24 hours. (B) Barbell platelet formation at 0, 1.5, 3, 6, and 24 hour time points (visualized using the image flow cytometry barbell gate described in supplemental Figure 3). Quantification of preplatelets and barbells at 0, 1.5, 3, 6, and 24 hour time points (n = 10). (C) before incubation, washed platelets were labeled with either CellTrace™ green (0.2 μg/mL) or red (1 μg/mL) cytosolic dyes, mixed, and incubated for 3 hours to demonstrate that barbells originate from single platelets (n = 3; imaged by ISFC, ×60 magnification; bars represent 7 μm). A*Maj-Ax-Int, area × major axis intensity; Min-Ax-Int, minor axis intensity. (A-B) Two-way analysis of variance with Bonferroni multiple-comparisons test ±1 standard deviation. *P < .05, **P < .01, ***P < .001.
To further track the fate of preplatelets and barbells, we labeled washed platelets with CellTrace™ and incubated them as just described. Baseline measurements confirm that 100% of platelets were positive for CellTrace™. After 24 hours, ∼10% of platelets appeared with significantly reduced CellTrace™ labeling (Figure 5A), a phenomenon unaffected by TRAP-induced degranulation (supplemental Figure 5). Interrogation of CellTrace™ mean fluorescence intensity (MFI) suggested that preplatelets may have undergone at least 2 rounds of fission to increase the platelet count. Newly formed platelets not only exhibited more intense Mitotracker labeling (Figure 5B) but the mitochondrial electron transport chain inhibitor rotenone (3 μg/mL) inhibited barbell formation, suggesting that mitochondrial function and energy are important. Furthermore, barbell formation was also inhibited by nocodazole and cytochalasin D (Figure 5C). Preplatelets are therefore capable of undergoing fission, which is dependent on cytoskeletal remodeling and mitochondrial respiration.

Mapping preplatelet maturation in vitro. Washed platelets were labeled with 2 μg/mL of CellTrace™ yellow cytosolic dye and incubated in serum-free M199 medium for 24 hours. (A) Scatterplots demonstrate the appearance of a discrete population of platelets termed “progeny,” which display a decrease in CellTrace™ yellow MFI (images depicted by CD61 and CellTrace™ fluorescence, using ISFC, ×60 magnification). Percentage increase in platelet count; the CellTrace™ fluorescence profile at 0 and 24 hours is also demonstrated. (B) AF599 Mitotracker Ros CMX MFI of platelets and platelet progeny with representative images and the effect of rotenone (3 μg/mL) on barbell formation when incubating washed platelets for 6 hours. (C) Washed platelets were incubated for 6 hours with nocodazole (10 μM) or cytochalasin D (1 or 0.1 μM), and barbells were quantified by ISFC. To show the effect of either cytoskeletal drug, marginal band morphology was depicted by using AF674 SiR tubulin live-cell labeling (n = 3). (A-C) Bars represent 7 μm. (A) Paired t-test, (B) Mann-Whitney U test and Wilcoxon test, and (C) 2-way analysis of variance. (A-C) ±1 standard deviation. *P < .05; **P < .01; ***P ≤ .001.
Mapping preplatelet maturation in vitro. Washed platelets were labeled with 2 μg/mL of CellTrace™ yellow cytosolic dye and incubated in serum-free M199 medium for 24 hours. (A) Scatterplots demonstrate the appearance of a discrete population of platelets termed “progeny,” which display a decrease in CellTrace™ yellow MFI (images depicted by CD61 and CellTrace™ fluorescence, using ISFC, ×60 magnification). Percentage increase in platelet count; the CellTrace™ fluorescence profile at 0 and 24 hours is also demonstrated. (B) AF599 Mitotracker Ros CMX MFI of platelets and platelet progeny with representative images and the effect of rotenone (3 μg/mL) on barbell formation when incubating washed platelets for 6 hours. (C) Washed platelets were incubated for 6 hours with nocodazole (10 μM) or cytochalasin D (1 or 0.1 μM), and barbells were quantified by ISFC. To show the effect of either cytoskeletal drug, marginal band morphology was depicted by using AF674 SiR tubulin live-cell labeling (n = 3). (A-C) Bars represent 7 μm. (A) Paired t-test, (B) Mann-Whitney U test and Wilcoxon test, and (C) 2-way analysis of variance. (A-C) ±1 standard deviation. *P < .05; **P < .01; ***P ≤ .001.
Preplatelets and barbells in murine blood
To confirm that preplatelets and barbells are not exclusive to human blood, we performed measurements in mouse blood and anti-platelet antibody–treated blood as a model of ITP. We used in vivo biotinylation labeling to conclusively confirm whether preplatelets and barbells represent newly formed immature platelets. Using a similar ISFC protocol (supplemental Figure 6A), we also detected preplatelets and barbells (with similar tubulin cytoskeletal morphology to human) in murine blood under the same conditions (supplemental Figure 6B-D), such as temperature and anticoagulant, as in humans (1.9% ± 0.18% and 1.7% ± 0.48%, respectively), and correlated them with immature RP levels (7% ± 2.1%; Figures 6A-B). WT mice were treated with anti-GPIbα to induce severe thrombocytopenia and the time course of recovery of platelets was monitored, to investigate the temporal relationship between preplatelets, barbells, and platelets. Figure 6C shows the kinetics of the platelet count with a nadir at day 1, increasing to 288 × 109/L at day 5 and near normal by day 7. At day 5, the percentage of RPs and MPV increased by 76.5% and 32.5%, respectively, confirming that the platelet population consisted predominantly of immature platelets (Figure 6C). Preplatelets and barbells were not only larger than baseline (supplemental Figure 7) but also significantly increased in number and correlated with the fraction of RPs at days 0 and 5 (Figure 6D). To conclusively confirm whether preplatelets and barbells are immature, newly formed platelets, mice were injected IV twice with NHS biotin to ensure that 100% of circulating platelets were labeled (Figure 6E). At 24 hours, 11.2% ± 5.1% of circulating platelets were shown to be biotin negative and thus represent newly formed immature platelets (Figure 6E). The barbell structures were all biotin negative confirming that they originated from immature cells. In contrast, preplatelet (>3 μm in diameter), and other circulating platelets (<3 μm in diameter) were positive for biotin (Figure 6E-F). Moreover, the biotin-negative platelets were not exclusively large, confirming their heterogeneity (Figure 6F).

Preplatelets are newly formed immature reticulated platelets. (A) Trisodium citrate–anticoagulated whole blood from WT mice was incubated for 1.5 hours at 37°C, and percentages of RPs identified by flow cytometry and preplatelets and barbells identified by ISFC using anti-CD61-FITC were quantified. Bars represent 7 μm. (B) Preplatelets and/or barbells correlated with RPs (n = 6). (C) Mice (n = 5) were treated with a GPIbα polyclonal antibody (1.5 μg/mL), and platelet counts and MPV were measured by an ABX Pentra 60 (Horiba) hematology analyzer and RPs by flow cytometry with TO labeling on day 0, 1, 5, or 7. (D) Also, preplatelets and barbells were quantified by ISFC with FITC CD61 at days 0 (before platelet depletion) and 5 (after platelet engraftment) and correlated with RPs. Mice (n = 4) were injected IV twice with NHS biotin (4 mg/mL) to label all circulating blood cells with biotin, bled 0 and 24 hours later, and labeled with APC anti-CD41 and FITC-conjugated streptavidin. (E) All circulating platelets were verified as biotin positive at baseline, and newly formed platelets at 24 hours after biotinylation were determined to be biotin negative. Representative ISFC images show biotin-positive and -negative platelet morphology (×60 magnification). Bars represent 7 μm. Biotin MFI of platelets, preplatelets, and barbells was also measured by ISFC at 24 hours. (F) ISFC to determine the size distribution of biotin-negative (immature) and -positive (mature) platelets 24 hours after injection (representative images are depicted with brightfield ISFC imaging, ×60 lens) Bars represent 7 μm. (A,E) One-way analysis of variance with Tukey test, (B,D) Pearson’s correlation coefficient, and (C) unpaired t-test. (A,C,E) ±1 standard deviation. **P < .01; ***P < .001; ****P < .0001.
Preplatelets are newly formed immature reticulated platelets. (A) Trisodium citrate–anticoagulated whole blood from WT mice was incubated for 1.5 hours at 37°C, and percentages of RPs identified by flow cytometry and preplatelets and barbells identified by ISFC using anti-CD61-FITC were quantified. Bars represent 7 μm. (B) Preplatelets and/or barbells correlated with RPs (n = 6). (C) Mice (n = 5) were treated with a GPIbα polyclonal antibody (1.5 μg/mL), and platelet counts and MPV were measured by an ABX Pentra 60 (Horiba) hematology analyzer and RPs by flow cytometry with TO labeling on day 0, 1, 5, or 7. (D) Also, preplatelets and barbells were quantified by ISFC with FITC CD61 at days 0 (before platelet depletion) and 5 (after platelet engraftment) and correlated with RPs. Mice (n = 4) were injected IV twice with NHS biotin (4 mg/mL) to label all circulating blood cells with biotin, bled 0 and 24 hours later, and labeled with APC anti-CD41 and FITC-conjugated streptavidin. (E) All circulating platelets were verified as biotin positive at baseline, and newly formed platelets at 24 hours after biotinylation were determined to be biotin negative. Representative ISFC images show biotin-positive and -negative platelet morphology (×60 magnification). Bars represent 7 μm. Biotin MFI of platelets, preplatelets, and barbells was also measured by ISFC at 24 hours. (F) ISFC to determine the size distribution of biotin-negative (immature) and -positive (mature) platelets 24 hours after injection (representative images are depicted with brightfield ISFC imaging, ×60 lens) Bars represent 7 μm. (A,E) One-way analysis of variance with Tukey test, (B,D) Pearson’s correlation coefficient, and (C) unpaired t-test. (A,C,E) ±1 standard deviation. **P < .01; ***P < .001; ****P < .0001.
Discussion
Using ISFC, we have designed and optimized a high-throughput, image-based approach that not only accurately quantifies preplatelets and barbells in whole blood but further aids in the study of the dynamics and regulation of platelet fission.18,24 Using this method, we have demonstrated for the first time to our knowledge that preplatelets/barbells are analogous to RPs (Figure 2A). Furthermore, quantification of preplatelets/barbells were shown to be equivalent to RP/IPF measurements (Figure 2B), and the rate of platelet production in thrombocytopenia (ITP) associated with enhanced peripheral destruction and turnover of platelets (Figure 3A), but virtually absent in patients at the nadir of the platelet count after chemotherapy-induced bone marrow ablation (Figure 3D). Also, preplatelet maturation occurred in vitro and increased the platelet count (Figures 4B and 5A), thus supporting why more barbells were observed in ITP blood than in blood of healthy subjects and those undergoing chemotherapy. As platelet size in ITP is dependent on megakaryocyte ploidy28 and is therefore a good indicator of platelet turnover in hyperdestructive disorders,29 it was not surprising that preplatelets also positively correlated with the rate of thrombopoiesis in ITP. However, both the IPF and percentage preplatelets were unchanged at the nadir of platelet counts after chemotherapy (Figure 3D). As IPF and MPV have been shown to be poor discriminators of bone marrow failure in patients,11,30 this result supports the consensus that, under some conditions, platelet size and age are independent.31-33
In vivo biotinylation of platelets, has definitively demonstrated that RPs are newly formed platelets.3,34,35 Following in vivo biotinylation experiments in WT mice in our study, interrogation of biotin negative and positive platelet images (by ISFC) at 24 hours showed that immature and mature platelets consisted of both platelets <3 μm in diameter and large preplatelets >3 μm (Figure 6E-F), thus confirming that not all large platelets are therefore immature. In contrast, it was quite striking that all barbell platelets were exclusively biotin negative at 24 hours, confirming that they originated from newly formed immature preplatelets. However, these findings were limited by the 24-hour biotinylation time point. As thousands of platelets are formed per second (in mice),36 measurements at earlier time points (<24 hours) would have clarified the exact timing of their appearance and kinetics within the circulation.
Based on our findings (Figures 4 and 5) and those of others,18,22 preplatelet maturation may occur to regulate physiological platelet counts. Furthermore, taking into consideration our barbell estimates in human and mouse whole blood (0.5% and 1.7% respectively; Figures 2B and 6A), the total number of circulating platelets and blood volume, and the differences in the rate of turnover across species,36,37 barbells would need to divide approximately every 2.4 or 4.1 hours, respectively, to maintain normal counts. Although our human and mouse data are in the same order of magnitude and seem feasible, these estimates not only assume that each preplatelet produces 2 daughter platelets, but also may not consider highly transient maturation events and those that have already occurred within turbulent environments (eg, lung capillary beds).20,38
Intriguingly, platelet progeny after incubation consisted of hyperpolarized mitochondria and inhibiting complex 1 of the mitochondrial respiratory chain with rotenone prevented barbell formation from occurring in vitro (Figure 5B). A mitochondrial hyperfused, polarized state has been reported in other cell types during the G1/S phase transition.39 Also, platelets exhibit the capacity to translate mRNA into protein.40 In consideration of this fact, it is possible that, during preplatelet maturation, mitochondria become fused and hyperpolarized, to increase adenosine triphosphate production and potentially support proteome replication. In addition, mitochondrial health is essential for platelet lifespan.41,42 However, off-target effects of rotenone could also have prevented barbell formation via inhibition of microtubule assembly.43 It is also possible that preplatelets use dynein-driven microtubule sliding and not assembly when converting into barbells.44,45 Further investigation is needed to determine the importance of mitochondria in driving platelet fission/maturation.
The current clinical use of measuring immature platelets is hindered by nonspecific labeling of nucleic acid dyes and disease context.5,11,46 Measuring barbell platelets is based on morphometric evaluation; it has potential to overcome such limitations and could be an invaluable, noninvasive, rapid tool for distinguishing peripheral thrombocytopenia from dysfunctional platelet production8 and accurately deferring unnecessary prophylactic platelet transfusions,47 and/or it could be used as a biomarker and risk factor in antiplatelet therapy and cardiovascular disease, respectively.48,49 Previous work by Thon and colleagues showed that preplatelet/barbell conversion is dependent on cortical microtubule bundle thickness and diameter.24 Therefore, it is likely that platelet fission is inhibited in giant platelet disorders (eg, MYH9-RD) where platelets have up to a 20-fold increase in the number of peripheral microtubule coils.50
Although there are many challenges to consider when implementing specialized instruments, such as the ISFC, in a clinical setting, digital morphological analysis of blood films is feasible, as demonstrated with a hematology analyzer (ie, Cobas m511 Bloodhound Technology; Roche, Basel, Switzerland).51 However, these approaches may lack the sensitivity to accurately quantify all barbell platelets within 2-dimensional blood films. ISFC technology could also still be usable within a clinical setting by designing a machine-learning approach based on brightfield imaging.52 Thus, a predesigned, imaged-based counting method may be possible using appropriately fixed, unlabeled blood samples. Furthermore, continuing instrument evolution with increased computing power could eventually result in a hematology analyzer that performs ISFC analysis of all blood cells.
Recently, we have begun to successfully unravel the final stages of platelet formation that occur in the bloodstream. Using such critical information, we demonstrated that preplatelet or immature platelet maturation occurs in a subpopulation of large platelets, and the rate at which this takes place signifies the rate of platelet production and bone marrow activity in health and disease, which may develop into a new and improved approach for perhaps overcoming the limitations of current immature platelet measurements (see the model in Figure 7). We propose that quantification of preplatelet-derived barbells could be an invaluable tool for diagnosing and managing thrombocytopenia. With the use of appropriate temperature-regulated anticoagulants, fixatives, and labels with incorporation of image-based analyses into future hematology analyzers, this method may offer a unique and more affordable automated approach than current ISFC for measuring preplatelet-derived barbell structures in whole blood.
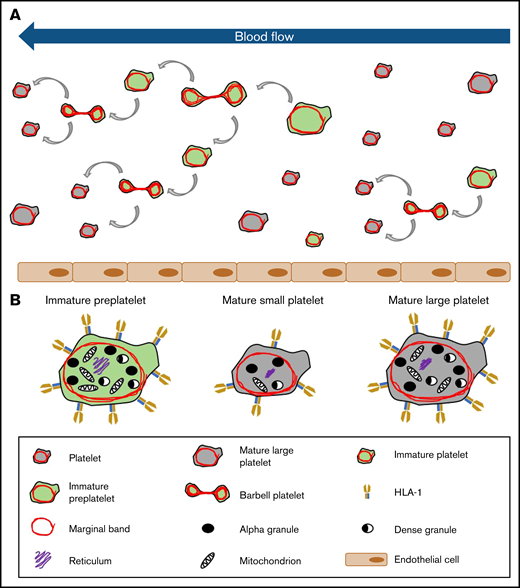
Model of platelet maturation in the bloodstream. (A) Circulating platelets are heterogeneous in size and age. Immature platelets >3 μm in diameter are termed preplatelets (identified by green cytoplasm). These platelet progenitor cells mature by continuously transforming into barbell platelets and undergoing fission into 2 smaller platelets until reaching a size threshold of <3 μm in diameter. Under steady-state production, not all large platelets are immature. Unlike preplatelets, these lack the capacity to undergo maturation. Therefore, mature platelets consist of small and large platelets (identified by gray cytoplasm). (B) Barbell platelets originate from immature preplatelets consisting of a greater nucleic acid content, granule content, number of mitochondria, and HLA I expression, compared with mature small platelets. In contrast, mature large platelets contain a similar number of granules and mitochondria, which are nonspecifically labeled with dyes used for measuring IPF and RPs. Large, mature platelets express slightly less HLA I than immature preplatelets, which could separate preplatelets from mature, large platelets.
Model of platelet maturation in the bloodstream. (A) Circulating platelets are heterogeneous in size and age. Immature platelets >3 μm in diameter are termed preplatelets (identified by green cytoplasm). These platelet progenitor cells mature by continuously transforming into barbell platelets and undergoing fission into 2 smaller platelets until reaching a size threshold of <3 μm in diameter. Under steady-state production, not all large platelets are immature. Unlike preplatelets, these lack the capacity to undergo maturation. Therefore, mature platelets consist of small and large platelets (identified by gray cytoplasm). (B) Barbell platelets originate from immature preplatelets consisting of a greater nucleic acid content, granule content, number of mitochondria, and HLA I expression, compared with mature small platelets. In contrast, mature large platelets contain a similar number of granules and mitochondria, which are nonspecifically labeled with dyes used for measuring IPF and RPs. Large, mature platelets express slightly less HLA I than immature preplatelets, which could separate preplatelets from mature, large platelets.
Acknowledgments
The authors thank Jun Mori and Timo Voegtle for advice and technical help with the mouse experiments; Charles Percy, Hayder Hussein, Will Lester, Suzanne Morton, and Beth Lovell for clinical input and help with patient recruitment; and the Imaging Suite at the University of Birmingham for support of imaging experiments.
The imaging facilities used in this project were funded by the University of Birmingham, COMPARE (S.P.W.), and the British Heart Foundation Chair Award to S.P.W. (CH03 0003). This project was funded by a British Heart Foundation’s 3-year studentship grant awarded to P.H. (FS/17/29/32828) and supported by a BHF Accelerator Award (AA/18/2/34218; A.D.) and by the CRN (Clinical Research Network West Midlands).
Authorship
Contribution: S.K. generated the data and wrote the manuscript; A.D. generated data and edited the manuscript; G.C.L. and P.L.R.N. provided clinical input and clinical samples for the study and edited the manuscript; S.G.T. and S.P.W. provided advice and edited the manuscript; Y.S. provided the mice, edited the manuscript, and obtained funding; and P.H. conceived the project, obtained funding, and wrote the paper.
Conflict-of-interest disclosure: The authors declare no competing financial interests.
Correspondence: Paul Harrison, Institute of Inflammation and Ageing, University of Birmingham, Birmingham B15 2TT, United Kingdom; e-mail: p.harrison.1@bham.ac.uk.

