

TO THE EDITOR:
Myelofibrosis (MF), primary (PMF) or secondary (SMF) to polycythemia vera (PPV-MF) or essential thrombocytemia (PET-MF), is characterized by a partially uncharted molecular architecture, including mutations in driver genes (JAK2, CALR, and MPL) and other myeloid neoplasm–associated genes.1-3 Among these, ASXL1 mutations (ASXL1mut), which are associated with poor outcomes across several myeloid malignancies, are included in a category of high molecular risk (HMR) mutations in patients with PMF, along with EZH2mut, IDH1mut, IDH2mut, SRSF2mut, and U2AF1mut.1,4 However, a recent study5 questioned the value of ASXL1mut in MF and proposed a novel model, named NGS, including 4 genetic categories: TP53mut, high risk (≥1 mutation in EZH2, CBL, U2AF1, SRSF2, IDH1, or IDH2), ASXL1mut only, and others.
In this study, after institutional review board approval (14 560), we aimed at critically reviewing the prognostic role of ASXL1mut with a specific focus on the distinction of PMF and SMF. We analyzed 523 patients with 2016 World Health Organization–defined MF: 330 (63%) with PMF, including 161 (49%) with prefibrotic (pre-PMF) and 169 (51%) with overt PMF, and 193 (37%) with SMF, including 85 (44%) with PPV-MF and 108 (56%) with PET-MF. Mutational analysis by targeted next-generation sequencing was performed as described6 ; details on methods are reported in the data supplement.
Median follow-up was 81 (95% confidence interval [CI], 67-93) and 77 (95% CI, 57-98) months for PMF and SMF, respectively. Patient characteristics are listed in supplemental Tables 1 to 3. Overall, 62% of patients were JAK2mut, 24% CALRmut, 5% MPLmut, 8% triple negative, and 2% double mutated. ASXL1mut were found in 157 (30%) patients, including 100 (30%) and 57 (30%) with PMF and SMF, respectively. EZH2mut were found in 9%, SRSF2mut in 7%, NRASmut in 6%, U2AF1mut in 5%, TP53mut and CBLmut in 5% each, KRASmut in 3%, and IDH1mut and IDH2mut in 2% each (supplemental Tables 1-3; Figure 1A). Compared with pre-PMF, the overt PMF cohort was enriched in ASXL1mut (41% vs 19%; P < .0001), EZH2mut (17% vs 3%; P < .0001), N/KRASmut (16% vs 4%; P = .0003), and U2AF1mut (8% vs 3%; P = .0304). HMRmut were found in 54%, 24%, and 34% of patients with pre-PMF, overt PMF, and SMF, and ≥2 HMRmut were found in 27%, 11%, and 10%, respectively.
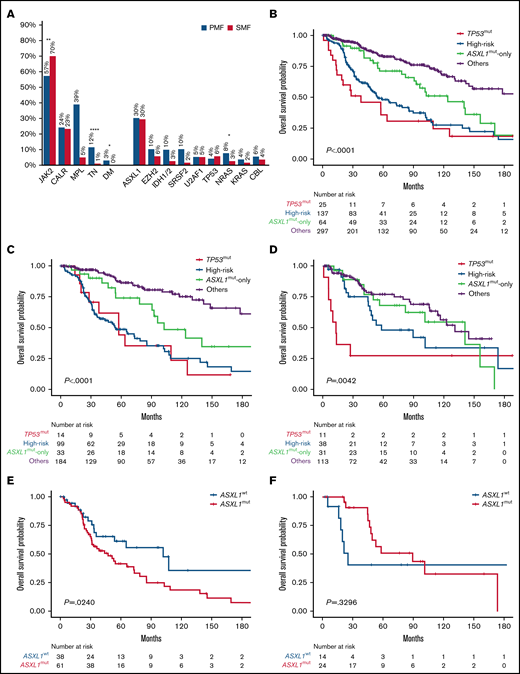
Genetic mutations frequency and Kaplan-Meier estimates of overall survival. (A) Bar graph reporting the frequency of driver and nondriver genetic mutations among patients with PMF and SMF. (B-D) Kaplan-Meier estimates of overall survival (OS) in the entire series of patients with MF (B) or those with PMF (C) or SMF (D) separately, according to the 4-tier genomic classification (NGS) proposed by Luque Paz et al.5 (E-F) Kaplan-Meier estimates of OS in high-risk patients with PMF (E) and SMF (F) by the presence or absence of ASXL1mut. *P < .1, **P < .001, ****P < .0001. DM, double mutated; TN, triple negative; WT, wild type.
Genetic mutations frequency and Kaplan-Meier estimates of overall survival. (A) Bar graph reporting the frequency of driver and nondriver genetic mutations among patients with PMF and SMF. (B-D) Kaplan-Meier estimates of overall survival (OS) in the entire series of patients with MF (B) or those with PMF (C) or SMF (D) separately, according to the 4-tier genomic classification (NGS) proposed by Luque Paz et al.5 (E-F) Kaplan-Meier estimates of OS in high-risk patients with PMF (E) and SMF (F) by the presence or absence of ASXL1mut. *P < .1, **P < .001, ****P < .0001. DM, double mutated; TN, triple negative; WT, wild type.
In PMF, ASXL1mut were associated with phenotypic characteristics representative of higher-risk disease, including older age (median, 64 vs 56 years; P < .0001), male sex (74% vs 26%; P = .0042), higher leukocyte count (11.9 vs 8.3 ×10⁹/L; P = .0083), lower hemoglobin level (11.2 vs 12.7 g/dL; P < .0001), fewer platelets (252 vs 517 ×109/L; P < .0001), more peripheral blasts (1% vs 0%; P < .0001), bone marrow fibrosis grade ≥2 (69% vs 40%; P < .0001), constitutional symptoms (57% vs 34%; P = .0001), and transfusion dependence (43% vs 20%; P < .0001). ASXL1mut clustered with EZH2mut (P < .0001), SRSF2mut (P < .0001), U2AF1mut (P = .0002), CBLmut (P = .0006), NRASmut (P < .0001), KRASmut (P = .0051), RUNX1mut (P = .0158), and SETBP1mut (P < .0001). In SMF, the only significant association was with MPLmut (P = .0207), EZH2mut (P < .0001), U2AF1mut (P = .0301), and NRASmut (P = .0122). The variant allele frequency (VAF) of ASXL1mut was higher in PMF than SMF (42% vs 26%; P = .0129).
According to the NGS model, patient categories were as follows: TP53mut, 5%; high risk, 26%; ASXL1mut only, 12%; and others, 57% (supplemental Table 1). Patients in the TP53mut and ASXL1mut-only categories were more likely to be diagnosed with SMF compared with those in the high-risk and others categories (44% and 48% vs 28% and 38%, respectively). The high-risk group was enriched for TN (16%), and CALRmut were more common among those in the ASXL1mut-only and others categories compared with TP53mut and high-risk categories (25% and 27% vs 12% and 18%, respectively). In univariate analysis, the TP53mut and high-risk categories had the worst OS at a median of 38 (range, 14-110) and 55 (range, 45-85) months (P = .0039), respectively (Figure 1B). Although remarkably better, the OS of patients in the ASXL1mut-only group was inferior compared with that of patients in the others category (median, 124 [range, 91-156] vs 193 [range, 142 to not reached (NR)] months; P = .0118).
We then analyzed separately the PMF and SMF cohorts (Figure 1C-D). In PMF, the TP53mut and high-risk categories showed the worst OS (median, 58 [range, 20-126] and 55 [range, 36-85] months, respectively), although the difference was not statistically significant, likely because of the low frequency of TP53mut (4%; Figure 1C). Conversely, the negative prognostic impact of the ASXL1mut-only category was magnified in comparison with the others category (median, 103 [range, 78-NR] vs 320 [range, 178-NR] months; P = .0170). Among patients in the high-risk group, ASXL1mut were found in 62% and were associated with shorter OS (median, 47 [range, 31-73] vs 102 [range, 34-317] months; P = .0240; Figure 1E). We also noticed that median VAF was significantly higher in the TP53mut and high-risk categories compared with the ASXL1mut-only group in PMF (47% vs 34%; P = .0303), unlike SMF (27% vs 19%; P = .128), possibly indicating that ASXL1mut are early driver events in PMF but might be acquired later in SMF.
In SMF, although the TP53mut category (6%) had the worst OS (median, 13 [range, 6-NR] months), the OS of the ASXL1mut-only category (median, 141 [range, 56-171] months) was not statistically different from those of the others (median, 131 [range, 106-NR] months; P = .5188) and high-risk categories (median, 58 [range, 45-174] months; P = .3606; Figure 1D). In the high-risk group, ASXL1mut were found in 63% and did not influence OS (median, 90 [range, 47-174] vs 25 [range, 16-338] months; P = .3296; Figure 1F).
Finally, we computed the C-index, Brier score, and time-dependent area under the curve to assess the prognostic performance of standard prognostic scoring systems (Dynamic International Prognostic Scoring System [DIPSS]7 for PMF and Myelofibrosis Secondary to PV and ET–Prognostic Model [MYSEC-PM]8 for SMF) and their combinations with molecular scores (HMR and NGS; Figure 2). For this purpose, the HMR model included 3 genomic categories according to previous findings6,9-11 : patients with no mutations in HMR genes (ie, ASXL1, EZH2, SRSF2, IDH1 and IDH2, and U2AF1) and those with 1 or ≥2 HMR mutations. In PMF, the HMR-DIPSS combination was overall superior in predicting death at all time points considered (24, 48, 72, and 96 months; Figure 2A) compared with the NGS-DIPSS combination. The highest values for performance and accuracy were achieved by the Mutation-Enhanced International Prognostic Score System (MIPSS70)6 and MIPSS70plus version 2.0.10 In SMF, the NGS classification performed better than HMR, and its integration with MYSEC-PM achieved the highest values for performance and accuracy at all time points. Conversely, MIPSS70 and MIPSS70plus version 2.0 were largely inferior compared with other prognostic models.
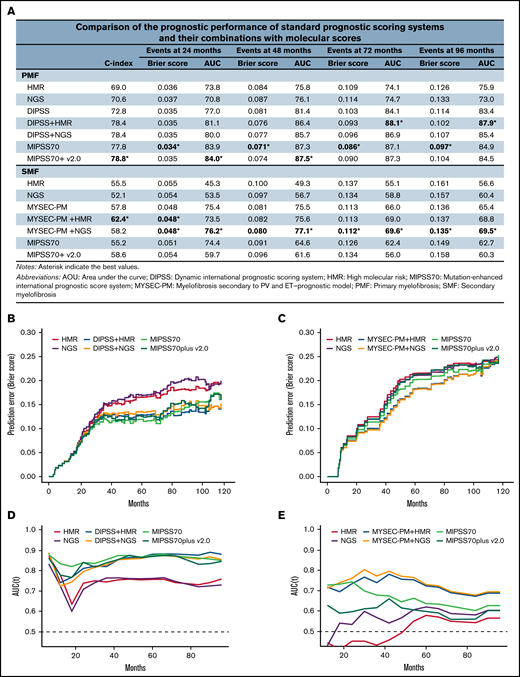
Performance of prognostic scoring systems. (A) Comparison of the prognostic performance among standard prognostic scoring systems (DIPSS for PMF and MYSEC-PM for SMF), their combinations with molecular scores (HMR and NGS), and novel integrated clinical-molecular score systems (MIPSS70 and MIPSS70plus version 2.0). For the purpose of the study, the HMR model included 3 genomic categories: patients with no mutations in HMR genes (ie, ASXL1, EZH2, SRSF2, IDH1 and IDH2, and U2AF1), patients with 1 HMR mutation, and patients with ≥2 HMR mutations. (B-C) Brier score for prediction of death measured over time for standard and integrated prognostic scoring systems in PMF (B) and SMF (C). (D-E) Time-dependent area under the curve (AUC) for prediction of death for standard and integrated prognostic scoring systems in PMF (D) and SMF (E).
Performance of prognostic scoring systems. (A) Comparison of the prognostic performance among standard prognostic scoring systems (DIPSS for PMF and MYSEC-PM for SMF), their combinations with molecular scores (HMR and NGS), and novel integrated clinical-molecular score systems (MIPSS70 and MIPSS70plus version 2.0). For the purpose of the study, the HMR model included 3 genomic categories: patients with no mutations in HMR genes (ie, ASXL1, EZH2, SRSF2, IDH1 and IDH2, and U2AF1), patients with 1 HMR mutation, and patients with ≥2 HMR mutations. (B-C) Brier score for prediction of death measured over time for standard and integrated prognostic scoring systems in PMF (B) and SMF (C). (D-E) Time-dependent area under the curve (AUC) for prediction of death for standard and integrated prognostic scoring systems in PMF (D) and SMF (E).
Overall, these results confirm that ASXL1mut harbor distinct phenotypic and prognostic implications in PMF and SMF. In PMF, ASXL1mut are associated with high-risk features and a unique genetic background, unlike in SMF. To our knowledge, this is the first study reporting such a distinctive prognostic role of ASXL1mut in PMF vs SMF. Most importantly, we confirmed that ASXL1mut, even in the absence of any cooccurring high-risk mutations, harbor a negative prognostic impact in PMF. Accordingly, integrated clinical-molecular scoring systems, such as MIPSS70 and MIPSS70plus version 2.0, that included ASXL1mut had the best predictive performance. It should be reinforced that these models were originally developed using series of patients with PMF only. Conversely, in SMF, the highest predictive power was achieved by the combination of MYSEC-PM and NGS variables that did not include ASXL1mut. We acknowledge the intrinsic limitation of this study resulting from missing cytogenetic information for almost half of the patients, which prevented their inclusion in the analysis.
In summary, these findings reinforce the adverse prognostic role of ASXL1mut in PMF and the value of current molecular integrated scores1,6,10,11 and strengthen the contention that PMF and SMF represent 2 different biological entities, supporting the development of integrated prognostic models specific to patients with SMF.
Acknowledgments: This work received financial support from the Associazione Italiana per la Ricerca sul Cancro (AIRC) 5 × 1000 call “Metastatic disease: the key unmet need in oncology” to MYNERVA (MYeloid NEoplasms Research Venture AIRC), project 21267; Cancer Research UK (C355/A26819); the Fundacion Cientifica de la Asociación Española Contra el Cáncer and AIRC under the Accelerator Award Program; and the Ministero della Universitaà e della Ricerca (PRIN-2017WXR7ZT).
Contribution: P.G., G.C., and A.M.V. designed the research and analyzed data; P.G., A.M.V., F.M., G.C., G.G.L., and C.P. collected data; G.R., C. Mannarelli, and C. Maccari generated molecular data; S.R. and N.B. contributed to statistical analysis; and P.G., G.C., and A.M.V. wrote the report, which was approved by all authors.
Conflict-of-interest disclosure: The authors declare no competing financial interests.
Correspondence: Alessandro M. Vannucchi, University of Florence, Largo Brambilla, 3 pad 27B, 50134, Florence, Italy; e-mail: amvannucchi@unifi.it.

