

Key Points
High expression of TAp63 is linked to adverse clinical outcomes in CLL.
TAp63 contributes to the antiapoptotic phenotype of CLL cells, likely through modulating BCL2 protein expression.

Abstract
The TA-isoform of the p63 transcription factor (TAp63) has been reported to contribute to clinical aggressiveness in chronic lymphocytic leukemia (CLL) in a hitherto elusive way. Here, we sought to further understand and define the role of TAp63 in the pathophysiology of CLL. First, we found that elevated TAp63 expression levels are linked with adverse clinical outcomes, including disease relapse and shorter time-to-first treatment and overall survival. Next, prompted by the fact that TAp63 participates in an NF-κB/TAp63/BCL2 antiapoptotic axis in activated mature, normal B cells, we explored molecular links between TAp63 and BCL2 also in CLL. We documented a strong correlation at both the protein and the messenger RNA (mRNA) levels, alluding to the potential prosurvival role of TAp63. This claim was supported by inducible downregulation of TAp63 expression in the MEC1 CLL cell line using clustered regularly interspaced short palindromic repeats (CRISPR) system, which resulted in downregulation of BCL2 expression. Next, using chromatin immunoprecipitation (ChIP) sequencing, we examined whether BCL2 might constitute a transcriptional target of TAp63 and identified a significant binding profile of TAp63 in the BCL2 gene locus, across a genomic region previously characterized as a super enhancer in CLL. Moreover, we identified high-confidence TAp63 binding regions in genes mainly implicated in immune response and DNA-damage procedures. Finally, we found that upregulated TAp63 expression levels render CLL cells less responsive to apoptosis induction with the BCL2 inhibitor venetoclax. On these grounds, TAp63 appears to act as a positive modulator of BCL2, hence contributing to the antiapoptotic phenotype that underlies clinical aggressiveness and treatment resistance in CLL.
Introduction
p63, a member of the p53 family of transcription factors, has been found to modulate developmental procedures and is also implicated in cancer, including hematological malignancies.1,2 Recent evidence has highlighted p63 deregulation as a novel cell-intrinsic aberration with potential relevance in the biology of chronic lymphocytic leukemia (CLL), particularly for adverse-prognostic cases.3
Previous studies by have shown that the expression levels of TAp63, the exclusive p63 isoform in CLL, are regulated by both immune signaling and epigenetic modifications. In particular, TAp63 was found hypomethylated and overexpressed in adverse-prognostic CLL cases, whereas stimulation through the B-cell receptor (BcR) augmented both TAp63 protein expression levels and CLL cell survival rates.3 Furthermore, TAp63 has been reported to affect the migratory and invasive properties of CLL cells to the bone marrow, while rescuing them from apoptosis, by upregulating the very-late-antigen-4 (VLA-4) integrin , particularly in advanced disease stages.4
In activated mature, normal B cells, TAp63 participates in an antiapoptotic NF-κB/TAp63/BCL2 axis augmenting cell survival and shaping immune responses. In more detail, CD74 activation induces p65, a NF-κB protein family member, which, in turn, upregulates TAp63 protein expression. This triggers a survival cascade by transactivating the BCL2 gene through promoter binding, eventually upregulating the expression of the BCL2 antiapoptotic protein.5
The BCL2 protein has a critical role in regulating the intrinsic cellular apoptosis pathway by controlling mitochondrial outer membrane permeabilization while preventing the release of proapoptotic factors, like cytochrome c, and the subsequent activation of the caspase cascade. BCL2 overexpression contributes to the deregulation of the apoptotic process in CLL,6 where excessive BCL2 expression is linked to the characteristic antiapoptotic phenotype of CLL cells and their resistance to treatment.7-9 Relevant to mention, the BCL2 promoter region is found hypomethylated in most CLL cases, perhaps explaining augmented transcription rates; against that, however, the exact mechanism behind the overexpression of BCL2 in CLL remains to be fully elucidated.6
Here, we investigated the expression of TAp63 in CLL and its potential fluctuation during disease progression. Additionally, in order to further understand the prosurvival role of TAp63 in CLL, we interrogated at the molecular level the interplay between ΤAp63 and BCL2. We report a direct correlation between the expression levels of the 2 molecules while also offering evidence that the BCL2 genomic locus is a transcriptional target of TAp63 also in CLL cells. On these grounds, we argue that the TAp63/BCL2 axis represents a novel mechanism of clinical aggressiveness in CLL.
Methods
Study group
Cases included in this study were diagnosed with CLL according to the guidelines of the International Workshop on Chronic Lymphocytic Leukemia/National Cancer Institute (iwCLL/NCI).10 The study was approved by the local Ethics Review Committees of the participating institutions. Written informed consent was obtained from all patients in accordance with the Declaration of Helsinki.11 Clinical and biological characteristics of the patient cohort are listed in supplemental Table 1.
Cell isolation
Primary CLL cells used for all assays were either peripheral blood mononuclear cells (PBMCs) characterized by high tumor load (CD19+ cells ≥80%) or negatively selected CD19+ B cells. Negative selection of CD19+ B cells was performed using the RosetteSep Human B Cell Enrichment Cocktail (StemCell Technologies, Canada) (for details, see supplemental Materials).
mRNA quantification
Total RNA was extracted from B cells using the QIAamp RNA Blood Mini kit (QIAGEN GmbH, Germany) according to the manufacturer’s instructions. Complementary DNA (cDNA) was synthesized via reverse transcription (SuperScrip II Reverse Transcriptase; ThermoFisher Scientific, Waltham, MA).
TAp63, BCL2, BAX, and AICDA messenger RNA (mRNA) expression was analyzed by quantitative polymerase chain reaction (qPCR) using the 5x HOT FIREPol EvaGreen qPCR Supermix (Solis BioDyne, Estonia) and ABL gene as control for expression normalization. Data were analyzed using the 2-ΔΔCt method.12 Methodological details can be found in supplemental Materials.
Flow cytometry studies
TAp63 protein expression was assessed by flow cytometry after crosslinking cells with 2% formaldehyde and intracellular staining achieved by permeabilization using 0.1% Triton-X solution; cells were finally stained with an anti-p63, phycoerythrin (PE)-conjugated antibody (clone D2K8X; cat#56687S; Cell Signaling Technology, Danvers, MA).
For the measurement of cell viability, CLL cells were stained with Fixable Viability Stain 660 (FVS660; BD Horizon, New York City, NY), an intracellular dye that penetrates the permeable plasma cell membranes of necrotic cells, following the manufacturer’s instructions. All measurements were acquired on a BD FACSCalibur flow cytometer with a minimum number of events set at 8000.
Raw data analysis was performed using the Flowing Software v2.5.1.
Western blotting
Protein extracts were separated on 8% polyacrylamide gels and transferred to polyvinylidene difluoride (PVDF) membranes (Merck Millipore, Burlington, MA) as previously described.3
For the immunodetection of the catalytically dead Cas9 (dCas9) and BCL2, the monoclonal mouse anti-Cas9 (clone 7A9) (Merck Millipore, Burlington, MA) and anti-BCL2 (clone 124) (Cell Signaling Technology, Danvers, MA) antibodies, respectively, were used as primary antibodies. The goat anti-mouse immunoglobulin horseradish peroxidase (HRP)–conjugated antibody was used as the secondary antibody in both cases (R&D Systems, Minneapolis, MN).
Normalization of each protein band intensity against the respective housekeeping gene band (β-actin) was achieved with the use of the ImageJ software (National Institutes of Health, Maryland).
Cell culture and treatment with inhibitors
Purified primary CLL cells and MEC1 cells [Research Resource Identifier (RRID) CVCL_1870] were cultured in RPMI-1640 medium with l-glutamine and sodium bicarbonide (Sigma-Aldrich, Germany) enriched with 10% fetal bovine serum (Superior BioWest, France) and 15 μg/mL gentamicin (Sigma-Aldrich, Germany) at a density of 3 × 10^6 cells per mL and 0.6 ×10^6 cells per mL, respectively. All experiments were performed using mycoplasma-free cells; the MEC1 cell line has been authenticated using short tandem repeat profiling within the last 3 years.
Cell cultures were maintained at 37°C and 5% CO2 in a humidified atmosphere in the presence or absence of the inhibitor ABT-199 (venetoclax; working concentration, 25 nM) (Selleckchem, Houston, TX).
RNA silencing of the TP63 gene
Transfection of CLL cells with small interfering RNAs (siRNAs) targeting the TP63 gene was conducted as described3 ; experimental details are provided in supplemental Materials.
CRISPR editing
Using the clustered regularly interspaced short palindromic repeats (CRISPR)/dCas9 system, we created a stable MEC1 cell line in which TAp63 was inducibly downregulated. To this purpose, we generated MEC1 cells overexpressing transcriptional repressor (Krüppel-associated box [KRAB]) domains fused to dCas9 and regulated by a Tet-on responsive promoter in which guide-RNA (gRNA) sequences specifically targeting TAp63 were incorporated. Proper integration of each one of the inserts was checked by Sanger sequencing. Experimental details are provided in supplemental Materials.
ChIP-sequencing
The applied chromatin immunoprecipitation (ChIP) protocol was developed based on previously described methods13,14 with modifications. The fragmented chromatin was precipitated with TAp63 monoclonal antibodies, purified and subjected to quality control tests. Next-generation sequencing libraries were prepared according to a previously published protocol15 and single-end sequenced on Illumina platform. Data analysis was performed on the Galaxy Web platform16 using the appropriate tools for quality assessment, mapping, peak calling, visualization, and pathway enrichment analysis.
More details about ChIP-sequencing can be found in supplemental Materials.
Statistical analysis
Statistical analyses were performed using the GraphPad Prism 6 software (GraphPad Software, La Jolla, CA; Research Resource Identifier SCR_002798) with a significance level of P < .05 set for all comparisons. For more details, please see supplemental Materials.
Results
In CLL, high TAp63 expression levels are linked with aggressiveness
We have previously documented that TAp63 is the exclusive p63 isoform in CLL cells and that TAp63 mRNA is upregulated in cases with unmutated (U-CLL) vs mutated (M-CLL) immunoglobulin heavy variable (IGHV) genes, especially those belonging to stereotyped subset #8, notable for a particularly high propensity for Richter’s transformation.17,18
Here, we significantly extended these observations through quantifying TAp63 mRNA expression in diagnostic samples of 166 CLL cases, assessed prior to the administration of any treatment. Our cohort included 77 M-CLL and 89 U-CLL cases; among the latter, 2, 7, and 8 cases belonged to stereotyped subsets #1, #6, and #8, respectively. We confirmed our previous observation that U-CLL cases express significantly higher TAp63 mRNA levels vs M-CLL (fold difference [FD], 13.83; P < .0001) (Figure 1A). Regarding stereotyped subsets, all subset #8 cases displayed high TAp63 expression, whereas stereotyped subset #1 and #6 cases displayed heterogeneous TAp63 expression. Given that outliers were identified in both U-CLL and M-CLL, we were prompted to reallocate all cases into TAp63high and TAp63low subgroups using receiver operating characteristic (ROC) curve and Youden index statistical procedures. Thus, 49/166 cases were classified as TAp63high (U-CLL, n = 47; M-CLL, n = 2), whereas 117/166 as TAp63low (U-CLL, n = 42; M-CLL, n = 75).
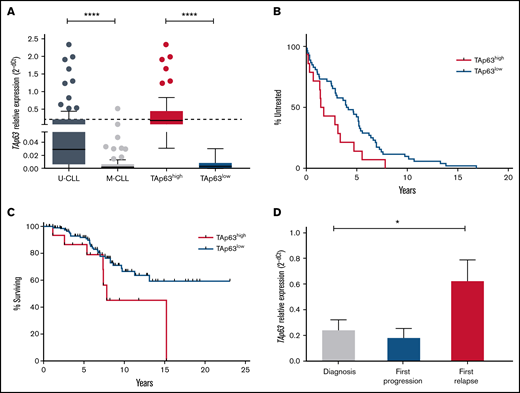
Elevated levels of TAp63 are associated with adverse clinical course and chemoresistance in CLL. (A) TAp63 mRNA expression levels in different subgroups of CLL patients. TAp63 mRNA expression is significantly higher in U-CLL (n = 89) compared with M-CLL (n = 77), and the same pattern is observed between TAp63high (n = 49) and TAp63low (n = 117) cases. (B-C) Kaplan Meier curves for time to first treatment (TTFT) and overall survival (OS). TAp63high CLL patients exhibit shorter TTFT (B) (P = .03) (TAp63highmedian TTFT, 1.58 years; TAp63lowmedian TTFT, 4.07) and shorter OS (C) (P = .04) (TAp63highmedian OS, 7.825 years; TAp63lowmedian OS, undefined due to the large number of censored cases) compared with TAp63low cases. (D) TAp63 mRNA expression levels over the disease course. CLL patients at disease express higher TAp63 mRNA levels compared with the timepoint of diagnosis (FD, 3.47; P = .02). *P ≤ .05, ****P ≤ .0001.
Elevated levels of TAp63 are associated with adverse clinical course and chemoresistance in CLL. (A) TAp63 mRNA expression levels in different subgroups of CLL patients. TAp63 mRNA expression is significantly higher in U-CLL (n = 89) compared with M-CLL (n = 77), and the same pattern is observed between TAp63high (n = 49) and TAp63low (n = 117) cases. (B-C) Kaplan Meier curves for time to first treatment (TTFT) and overall survival (OS). TAp63high CLL patients exhibit shorter TTFT (B) (P = .03) (TAp63highmedian TTFT, 1.58 years; TAp63lowmedian TTFT, 4.07) and shorter OS (C) (P = .04) (TAp63highmedian OS, 7.825 years; TAp63lowmedian OS, undefined due to the large number of censored cases) compared with TAp63low cases. (D) TAp63 mRNA expression levels over the disease course. CLL patients at disease express higher TAp63 mRNA levels compared with the timepoint of diagnosis (FD, 3.47; P = .02). *P ≤ .05, ****P ≤ .0001.
Next, we explored correlations between TAp63 mRNA levels and clinical outcome. TAp63high patients displayed both significantly shorter TTFT (TAp63highmedian TTFT, 1.58 years; TAp63lowmedian TTFT, 4.07 years; P = .03) and OS (TAp63highmedian OS, 7.825 years; TAp63lowmedian OS, not yet reached; P = .046) (Figure 1B-C), highlighting TAp63 as a potential contributor to clinical aggressiveness. Due to the correlation of IGHV mutational status both with survival probability and TAp63 expression levels, we adjusted a Cox regression model of survival time with TAp63 categories (high/low), having IGHV status as covariate. We found that the effect of TAp63 levels on survival probability remained significant (P = .026) even after controlling for IGHV status.
We also serially determined TAp63 mRNA levels by quantitative reverse transcription polymerase chain reaction (RT-qPCR) in a group of 25 U-CLL patients with progressive CLL treated either with the fludarabine-cyclophosphamide-rituximab regimen or with a combination of rituximab with an alkylating agent. Samples were collected at 3 characteristic disease “landmarks” (ie, diagnosis, first progression, and first relapse). Three of 25 cases carried TP53 pathogenic variants, whereas all the other patients were TP53–wild-type. No significant differences were identified in the relative expression of TAp63 mRNA at diagnosis vs first progression. In contrast, a statistically significant increase was noted at first relapse (FD, 3.47; P = .02) vs diagnosis, suggesting that TAp63 upregulation may be linked to resistance to chemoimmunotherapy (Figure 1D). Similar results were obtained in 4 patients failing Ibrutinib treatment, where a significant increase was documented at the time of treatment failure compared with the pretreatment sample (FD, 2.95; P = .02).
To exclude confounding effects of TP53 aberrations, the entire analysis was also performed in TP53–wild-type cases exclusively, leading to concordant findings (supplemental Figure 1).
TAp63 and BCL2 expression levels are correlated in CLL
We investigated links between TAp63 and BCL2 expression in both primary CLL cells and the MEC1 cell line. First, we quantitated BCL2 mRNA in 56 U-CLL cases and found a modest but statistically significant correlation with the corresponding TAp63 mRNA levels (Spearman ρ = 0.31, P = .01) (Figure 2A). To further examine this finding, we performed RNA interference in primary cells of 4 representative TP63high CLL cases using 3 different siRNAs, complementary to 3 distinct regions of the TAp63 mRNA. This manipulation led to downregulation of both TAp63 protein levels (FDs: Hs_TP63_1, 0.73; Hs_TP63_2, 0.64; Hs_TP63_3, 0.53) (assessed by flow cytometry) and BCL2 protein levels (FDs: Hs_TP63_1, 0.88; Hs_TP63_2, 0.84; Hs_TP63_3, 0.8) (assessed by western blotting) with strong correlation between the 2, as normalized to the corresponding negative control (ρ = 0.78, P = .003; Figure 2B).
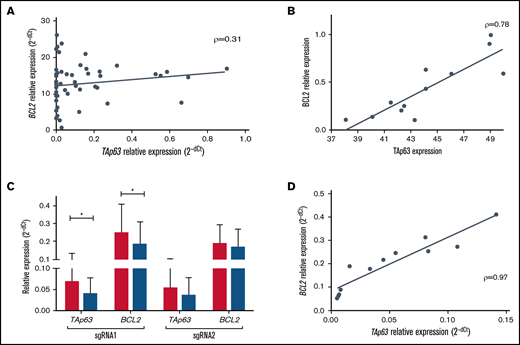
TAp63 and BCL2 expression profiles are correlated at both the protein and the mRNA level. (A) Scatter plot for correlation in mRNA level in 56 U-CLL cases before treatment showing a modest but statistically significant correlation between TAp63 and BCL2 (ρ = 0.31, P = .01). (B) TAp63 protein levels (measured by flow cytometry) are highly correlated with the corresponding BCL2 protein levels (measured by western blotting and normalized to b-actin) after RNAi silencing of the TP63 gene in 4 TP63high cases using 3 different siRNAs (ρ = 0.78, P = .003). All comparisons were assessed using as a control cells transfected with a siRNA nonhomologous to any known mammalian gene. (C-D) Inducible downregulation of TAp63 expression (gRNA1: FD, 1.7; P = .03; gRNA2: FD, 1.53) resulted in downregulation of BCL2 expression (gRNA1: FD, 1.34; P = .05; gRNA2: FD, 1.12) in Tet-on-dCas9-KRAB-sgRNA-TAp63 MEC1 cells (C), with strong correlation (ρ = 0.97, P < .0001) between their expression levels (D). The assay was performed in triplicate. *P ≤ .05. RNAi, RNA interference.
TAp63 and BCL2 expression profiles are correlated at both the protein and the mRNA level. (A) Scatter plot for correlation in mRNA level in 56 U-CLL cases before treatment showing a modest but statistically significant correlation between TAp63 and BCL2 (ρ = 0.31, P = .01). (B) TAp63 protein levels (measured by flow cytometry) are highly correlated with the corresponding BCL2 protein levels (measured by western blotting and normalized to b-actin) after RNAi silencing of the TP63 gene in 4 TP63high cases using 3 different siRNAs (ρ = 0.78, P = .003). All comparisons were assessed using as a control cells transfected with a siRNA nonhomologous to any known mammalian gene. (C-D) Inducible downregulation of TAp63 expression (gRNA1: FD, 1.7; P = .03; gRNA2: FD, 1.53) resulted in downregulation of BCL2 expression (gRNA1: FD, 1.34; P = .05; gRNA2: FD, 1.12) in Tet-on-dCas9-KRAB-sgRNA-TAp63 MEC1 cells (C), with strong correlation (ρ = 0.97, P < .0001) between their expression levels (D). The assay was performed in triplicate. *P ≤ .05. RNAi, RNA interference.
In order to validate this observation, we undertook functional studies in MEC1 cells, a model for aggressive CLL. First, using RT-qPCR, we confirmed high TAp63 mRNA expression levels. Next, to inducibly downregulate the levels of endogenous TAp63, we applied the CRISPR/dCas9-KRAB system upon treatment with doxycycline (Dox) using 2 different gRNAs (single-guide RNAs [sgRNAs]; sgRNA1, sgRNA2) targeting 2 distinct regions of the endogenous TP63 promoter. Validation of the stable cell line, expressing adequate amounts of dCas9, was performed by western blot after 48 hours of doxycycline induction. High levels of exogenous dCas9 were detected, whereas no leaky protein production was found in the absence of doxycycline (supplemental Figure 2A). After 5 days of induction, TAp63 and BCL2 expression levels were quantitated by RT-qPCR in Tet-on-dCas9-KRAB-sgRNA-TAp63 MEC1 cells. Ιnducible downregulation of TAp63 expression (gRNA1: FD, 1.7; P = .03; gRNA2: FD, 1.53) resulted in downregulation of BCL2 expression (gRNA1: FD, 1.34; P = .05; gRNA2: FD, 1.12) with strong correlation (ρ = 0.97, P < .0001) between the 2 (Figure 2C-D). Of interest, the alteration in expression levels was accompanied by a corresponding reduction in cell viability between days 0 and 5 in Dox+ MEC1 cells (gRNA1: FD, 1.9; gRNA2: FD, 1.56), contrary to Dox− cells, whose viability was unaffected (supplemental Figure 2B).
BCL2 is a transcriptional target of TAp63
Next, we examined whether BCL2 might represent a transcriptional target of TAp63 and also identified the TAp63 binding profile (cistrome) at a genome-wide scale. To this end, we performed ChIP-sequencing in primary CLL cells from 1 representative TAp63high CLL case with aggressive clinical behavior and eventual Richter’s transformation (developed after inclusion in the study) as well as MEC1 cells. The efficiency of the chromatin immunoprecipitation assay was confirmed by RT-qPCR prior to library preparation and sequencing using MDM2, a well-characterized constitutive TAp63 target, and SKP2 as a negative control (supplemental Figure 3A)19 while the sequenced samples passed various quality control steps (supplemental Figure 3B). The sequencing coverage and quality statistics for each sample are summarized in supplemental Table 2. Further validation of the sequencing results was achieved by our finding of promoter-proximal strong TAp63 binding at the MDM2 gene, as illustrated in the Integrative Genomics Viewer (IGV) browser (Figure 3D). Peak calling analysis with loose criteria (q value < 0.05) revealed 2323 TAp63 peaks in primary CLL cells and 3979 peaks in MEC1 cell line. Downstream analysis was performed using more stringent criteria (q value < 0.00001), which resulted in the identification of 223 high-confidence TAp63 binding sites in primary CLL cells and 1563 binding sites in MEC1 cells; 120 sites were common between the 2 groups (Figure 3A).
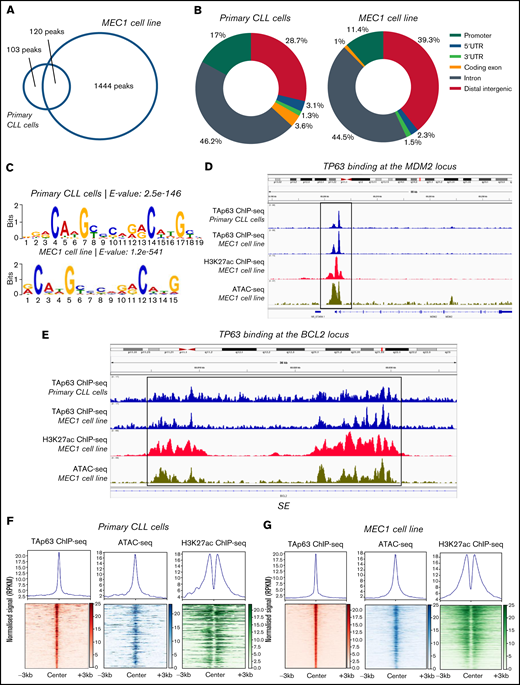
Analysis of the TAp63 binding landscape. (A) Overlap between TAp63 binding sites in primary cells from 1 CLL case as well as MEC1 cell line as identified using a stringent MACS peak calling cutoff q = 0.00001. One hundred and twenty common genes were found between the 2 comparison groups. (B) Genomic distribution of TAp63 binding sites in both samples. Promoter binding corresponds to 17% and 11.4% in CLL and MEC1 cells, respectively. (C) De novo motif analysis for the TAp63 binding sites in both samples identified a motif resembling the p63 (matrix id in the JASPAR motif database: MA0525.2)-p53 (matrix id: MA0106.3)-p73 (matrix id: MA0861.1) family of motifs as the most statistically significant (e-value: CLL cells, 2.5e-146; MEC1, 8.7e-476). (D) IGV genomic browser snapshots depicting the TAp63 binding profile and epigenomics marks on the MDM2 locus. A promoter-proximal strong TAp63 binding was found at the MDM2 gene, confirming its characterization as a well-described positive TAp63 transcriptional target. (E) IGV genomic browser snapshots illustrating the TAp63 binding events and epigenomics marks at the BCL2 locus in a region previously characterized as a super-enhancer in CLL. (F-G) Co-depiction of TAp63 binding signals with publicly available ATAC-seq (GEO no. GSM3382058) and H3K27ac (GEO no. GSM3382050) data around its total binding sites in both samples using an aggregate plot (top half of the scheme) and a heatmap (bottom half of the scheme) analysis TAp63 binding sites coexist with ATAC-seq and H3K27ac signals, corresponding to accessible and active chromatin. MACS, model-based analysis of ChIP-seq.
Analysis of the TAp63 binding landscape. (A) Overlap between TAp63 binding sites in primary cells from 1 CLL case as well as MEC1 cell line as identified using a stringent MACS peak calling cutoff q = 0.00001. One hundred and twenty common genes were found between the 2 comparison groups. (B) Genomic distribution of TAp63 binding sites in both samples. Promoter binding corresponds to 17% and 11.4% in CLL and MEC1 cells, respectively. (C) De novo motif analysis for the TAp63 binding sites in both samples identified a motif resembling the p63 (matrix id in the JASPAR motif database: MA0525.2)-p53 (matrix id: MA0106.3)-p73 (matrix id: MA0861.1) family of motifs as the most statistically significant (e-value: CLL cells, 2.5e-146; MEC1, 8.7e-476). (D) IGV genomic browser snapshots depicting the TAp63 binding profile and epigenomics marks on the MDM2 locus. A promoter-proximal strong TAp63 binding was found at the MDM2 gene, confirming its characterization as a well-described positive TAp63 transcriptional target. (E) IGV genomic browser snapshots illustrating the TAp63 binding events and epigenomics marks at the BCL2 locus in a region previously characterized as a super-enhancer in CLL. (F-G) Co-depiction of TAp63 binding signals with publicly available ATAC-seq (GEO no. GSM3382058) and H3K27ac (GEO no. GSM3382050) data around its total binding sites in both samples using an aggregate plot (top half of the scheme) and a heatmap (bottom half of the scheme) analysis TAp63 binding sites coexist with ATAC-seq and H3K27ac signals, corresponding to accessible and active chromatin. MACS, model-based analysis of ChIP-seq.
The genomic distribution of the TAp63 DNA-binding peaks in both primary CLL cells and MEC1 cells revealed a characteristic enrichment for promoters (CLL cells, 17%; MEC1, 11.4%) ; 46.2% of peaks in primary CLL cells and 44.5% of peaks in MEC1 cells fell into introns; finally, 28.7% of peaks in primary CLL cells and 39.3% of peaks in MEC1 cells were intergenic (Figure 3B). We then screened the sequences of the TAp63 binding sites harbored across the ChIPed DNA elements isolated from both samples for transcription factor binding motifs and identified a motif resembling the p63-p53-p73 family of motifs as the most statistically significant (Figure 3C). Interestingly, 124/223 TAp63 DNA-binding peaks (55.6%) in primary CLL cells contained at least 1 instance of the above-described motif.
In order to identify the accessibility patterns and chromatin activity status of TAp63 binding sites, we compared them with publicly available datasets20 of ATAC-seq (Assay for Transposase-Accessible Chromatin using sequencing) and H3K27ac ChIP-seq in the MEC1 cell line (Gene Expression Omnibus [GEO] accession numbers GSM3382058 and GSM3382050, respectively). In primary CLL cells, 111/223 (49.8%) TAp63 binding sites were predicted as accessible and 57/223 (25.6%) were marked by H3K27ac, with 30/223 (13.5%) displaying both high accessibility and “actively modified” chromatin status (Figure 3F). The corresponding counts for MEC1 cells were 1069/1563 (68.3%), 421/1563 (26.9%), and 262/1563 (16.8%) (Figure 3G). On these grounds, we argue that a significant portion of the identified TAp63 DNA-binding sites resides mainly in accessible and active chromatin landscapes that presumably host putative regulatory elements controlled by TAp63.
Gene ontology analysis on the data derived from the patient’s sample using the Genomic Regions Enrichment of Annotations Tool (GREAT), identified immune-related processes as well as DNA damage and p53-mediated processes as the most statistically significant ones; concordant results were obtained in MEC1 cells (Table 1). Regarding BCL2, the depiction of the entire gene sequence in IGV in both primary and MEC1 cells showed a characteristic binding of TAp63 (stronger in the latter) at several locations throughout the gene, albeit more enhanced in close proximity to its first and last exon, accompanied by analogous profiles of ATAC-seq and H3K27ac–ChIP-seq signals in regions characterized as parts of a super-enhancer (SE)20 (Figure 3E). Of interest, the characteristic p53 family member binding motif was found in this super-enhancer sequence.
Top 15 significant biological processes for the closest genes to TAp63 binding sites in primary CLL cells and MEC1 cells
| Process | −log10 (binomial P value) | |
|---|---|---|
| Primary CLL cells | Immune system process | 10.46 |
| Fc-γ receptor signaling pathway involved in phagocytosis | 7.93 | |
| Fc-γ receptor signaling pathway | 7.89 | |
| Regulation of immune system process | 7.84 | |
| Fc receptor mediated stimulatory signaling pathway | 7.8 | |
| Positive regulation of immune system process | 7.77 | |
| DNA damage response-signal transduction by p53 class mediator | 7.03 | |
| Phagocytosis | 6.82 | |
| Multiorganism cellular process | 6.77 | |
| Symbiosis, encompassing mutualism through parasitism | 6.7 | |
| Interspecies interaction between organisms | 6.68 | |
| Signal transduction in response to DNA damage | 6.59 | |
| Immune response-activating signal transduction | 6.55 | |
| Mitotic G1 DNA damage checkpoint | 6.54 | |
| Response to other organism | 6.51 | |
| MEC1 cell line | Immune response | 21.03 |
| Cell activation | 20.87 | |
| Apoptotic process | 18.49 | |
| Leukocyte activation | 17.72 | |
| Response to other organism | 16.98 | |
| Programmed cell death | 16.94 | |
| Response to external biotic stimulus | 16.76 | |
| Positive regulation of cell activation | 16.47 | |
| Positive regulation of leukocyte activation | 16.46 | |
| Response to biotic stimulus | 16.23 | |
| Regulation of cell activation | 16.02 | |
| Regulation of leukocyte activation | 15.44 | |
| Positive regulation of immune system process | 15 | |
| Lymphocyte activation | 14.72 | |
| Regulation of lyphocyte activation | 14.36 |
Prompted by the high rate of aberrant somatic hypermutation of BCL2 in aggressive lymphomas21 and the fact that DNA damage was among the top-enriched processes by GREAT, we next investigated possible links between the expression levels of TAp63 and AICDA, the gene encoding the activation-induced (cytidine) deaminase enzyme that catalyzes somatic hypermutation;22 however, we failed to document any significant correlation (supplemental Figure 4).
The complete list of genes with TAp63 binding in their vicinity for both primary and MEC1 cells is provided in supplemental Table 3. Characteristic genes with TAp63 binding include genes related to p53 function and the DNA damage pathway (eg, PLK2 and HIPK2) as well as genes with previously described roles in the pathogenesis of CLL (eg, ETV6, NOTCH2, PLCG2, and SYK). Among the identified TAp63 targets, we recognized BAX, encoding the BCL2-associated X protein, a proapoptotic regulator of BCL2 family proteins.23 With this in mind, we quantitated BAX mRNA in all (n = 56) cases characterized for BCL2 mRNA expression. A positive (ρ = 0.25), albeit not statistically significant, correlation was identified between BAX and TAp63 mRNA expression. Moreover, a modest decrease in BAX mRNA levels was observed in CRISPR-edited MEC1 cells with downregulated TAp63 (gRNA1: FD, 1.18; gRNA2: FD, 1.09) (supplemental Figure 5A-B). Arguably, therefore, despite that TAp63 binds to and activates both BCL2 and BAX, nonetheless, cell survival is likely modulated by the eventual BCL2:BAX ratio rather than the expression levels of each one individually.
CLL cases with elevated TAp63 levels are more resistant to treatment with the BCL2 inhibitor venetoclax
We assessed ex vivo the effect of the BCL2 inhibitor venetoclax, widely used in CLL,24,25 in primary CLL cells of both TAp63high (n = 8) and TAp63low (n = 6) cases. The 2 groups were balanced for TP53 aberrations and included exclusively U-CLL cases (supplemental Table 1). In order to select the appropriate concentration of the inhibitor, we performed a titration assay, to end up to a final concentration of 25 nM (supplemental Figure 6), which is considerably toxic, leading to ∼30% viable cells. This choice was intentional as we wanted to test our hypothesis that TAp63-elevated expression levels confer to resistance in venetoclax even under a rather extreme condition. Cell viability was measured by flow cytometry at 24 and 48 hours after treatment. As control groups, we used cells derived from the same CLL cases treated exclusively with dimethyl sulfoxide (DMSO), the inhibitor diluent. TAp63high cases were found more resistant to treatment with venetoclax as they showed no statistically significant reduction in cell viability compared with the respective controls. In sharp contrast, cell viability in TAp63lowcases was significantly decreased after venetoclax treatment at both timepoints (24 hours: FD, 3.63; P = .004; 48 hours: FD, 7.17; P = .005; Figure 4Α-Β).
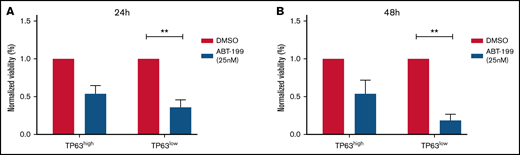
TAp63high CLL cases are resistant to the BCL2 inhibitor venetoclax. Bar graph illustrating the normalized viability (to DMSO-treated cells), measured by flow cytometry, in TAp63high (n = 8) vs TAp63low (n = 6) cases after 24 and 48 hours of venetoclax treatment. TAp63high cases exhibit no statistically significant decrease in cell viability, whereas cell viability in TAp63low cases was significantly reduced at both the 24-hour (A) and the 48-hour (B) timepoints. Because normalized viability is depicted in the graph, the value of each DMSO samples is equal to 1. **P ≤ .01. ABT-199, venetoclax.
TAp63high CLL cases are resistant to the BCL2 inhibitor venetoclax. Bar graph illustrating the normalized viability (to DMSO-treated cells), measured by flow cytometry, in TAp63high (n = 8) vs TAp63low (n = 6) cases after 24 and 48 hours of venetoclax treatment. TAp63high cases exhibit no statistically significant decrease in cell viability, whereas cell viability in TAp63low cases was significantly reduced at both the 24-hour (A) and the 48-hour (B) timepoints. Because normalized viability is depicted in the graph, the value of each DMSO samples is equal to 1. **P ≤ .01. ABT-199, venetoclax.
Discussion
In the present study we explored the links between p63 overexpression and resistance to apoptosis in CLL through assessing its expression in disease variants with distinct clinicobiological features but also in various stages throughout the disease course. Moreover, given that TAp63, the exclusive p63 isoform in CLL, participates in an antiapoptotic pathway involving BCL2 in normal B cells,5 we also investigated whether a TAp63/BCL2 axis might operate in CLL cells as well.
Our results confirm and significantly extend our previous report that TAp63 likely contributes to clinical aggressiveness of CLL by correlating high TAp63 mRNA expression with adverse clinical outcomes, including shorter TTFT and OS. This is in line with evidence in follicular lymphoma and diffuse large B-cell lymphoma, where elevated TAp63 expression levels are associated to higher grade, increased tumor cell proliferation, and decreased OS.26-28 Evidently, therefore, the TP63 gene emerges as yet another player in shaping aggressiveness in malignancies of mature B cells.
This argument is supported by the herein reported fluctuations in TAp63 mRNA expression in longitudinal samples of CLL patients treated with chemoimmunotherapy. In more detail, augmented TAp63 levels were documented at the timepoints of progression and disease relapse compared with diagnosis, alluding to a relevant role of TAp63 in chemoresistance. This contrasts previous findings that TAp63 induced by chemotherapeutic agents can activate apoptosis in solid cancers (eg, head and neck), at least in vitro,29 raising the intriguing hypothesis that the cellular context shapes the impact of TAp63. In this context, it is also relevant to mention our recent finding of TAp63 downregulation in vivo in patients with CLL under ibrutinib monotherapy who responded to this treatment.30 Combined with the herein reported TAp63 overexpression in CLL cases failing ibrutinib treatment, these findings are in line with our hypothesis that TAp63-elevated levels are linked to treatment resistance in CLL.
Next, we investigated potential molecular connections between Tap63 and the BCL2 antiapoptotic protein and found strong correlation at both the mRNA and the protein levels, as shown by (1) TP63 RNA silencing in primary CLL cells and (2) TP63 downregulation in CRISPR-edited MEC CLL cells. Overexpression of these 2 proteins has been reported previously in different cancer types (eg, thyroid and basal cell carcinoma).31,32 Here, we take this observation one step further by providing evidence that TAp63 likely modulates BCL2 expression, considering that downregulation of the former induces a similar effect in the latter. Corroborative evidence was provided by TAp63 cistrome analysis, which highlighted BCL2 as one of the TAp63 direct transcriptional targets, supporting that the TAp63/BCL2 axis is also activated in CLL cells. More specifically, we discovered significant binding events and identified the characteristic TAp63 binding motif in distinct regions throughout the BCL2 gene. Interestingly, the stronger binding signals are characterized as part of a previously described active SE in CLL.20 This SE belongs to the conserved gene regulatory network architecture of the CLL genome, is an open-chromatin region marked by the H3K27ac epigenetic modification, typical of active regulatory elements, and includes part of the BCL2 promoter, intronic regions, and the 3′ end of the gene. BCL2 gene activation through the above-described SE may contribute to the common transcriptional upregulation of this antiapoptotic molecule in CLL.
Despite substantial evidence regarding the transcriptional targets of the alternative p63 isoform deltaNp63, in both normal and malignant tissues,19,33,34 the network of TAp63 target genes in cancer remains uncharacterized. Using stringent criteria, we identified ∼200 and 1500 gene targets in CLL cells and MEC1 cells, respectively, a large fraction of which contained the characteristic binding motif of TAp63 and other p63 family members. Highly conserved sequences contain the characteristic p53 family motif, contrary to tissue-specific binding sites, which are characterized by alternative binding motifs (data not shown). Comparison of our results with available data of ATAC-seq and H3K27ac ChIP-seq performed in MEC1 cells and previously published data20 supports that a large fraction of TAp63 genome-wide binding sites is located in active and accessible chromatin regions, as previously described in keratinocytes.35
Gene ontology analysis revealed significant enrichment in immune processes characteristic of the B-cell identity and regulation of apoptotic mechanisms and DNA damage. These findings are in line with previous evidence that p63 isoforms can act either separately or in interaction with other members of the p53 protein family upon DNA damage and activate a transcriptional cascade.36
Prompted by our finding that a TAp63/BCL2 axis is functional in CLL, we also assessed ex vivo whether TAp63 expression may influence the responses to venetoclax, an exceptionally selective BCL2 inhibitor that provokes cell apoptosis by morphologically imitating the physiologic antagonists of BCL2.24 We report that CLL cases with elevated TAp63 levels displayed reduced death rates and, therefore, resistance to venetoclax, whereas cases displaying low TAp63 levels exhibited the expected apoptotic behavior. Relevant to mention, 1 of the additional transcriptional targets of TAp63 identified in our study was NOTCH2, previously reported to contribute to venetoclax resistance in CLL.37 Hence, one could argue that TAp63 may influence the cellular response to venetoclax in (at least) a twofold manner (ie, through transcriptional regulation of both BCL2 and NOTCH2).
In conclusion, TAp63 emerges as a novel player underlying aggressiveness and treatment resistance in CLL. This claim is supported by the finding of concerted regulation between TAp63 and the prosurvival protein BCL2, thus hinting at a novel mechanism that likely contributes to the antiapoptotic phenotype of CLL cells. Admittedly, a possible impact of TAp63 on cell viability through modulation of other processes besides apoptosis (eg, necrosis or autophagy) cannot be a priori excluded and should be further investigated. That notwithstanding, elevated TAp63 expression appears to be linked with adverse clinical features and also results in resistance to the BCL2 inhibitor venetoclax, widely used in the treatment of patients with CLL.
Acknowledgments
The authors would like to thank Paolo Ghia from the IRCCS (Istituto di Ricovero e Cura a Carattere Scientifico) San Raffaele Hospital, in Milan, Italy, for the kind provision of the MEC1 cell line and Federika Barbaglio and Cristina Scielzo from the Malignant B-cell biology and 3D modelling unit in IRCCS San Raffaele Hospital, Milan, Italy, for performing the STR profiling assay in the MEC1 cell line. Icons used in the creation of visual abstract are made by Freepik and Pixel Perfect from www.flaticon.com or obtained from Uniprot database (entries Q9H3D4 and P10415 for p63 and BCL2 correspondingly).
This work was supported in part by the project ODYSSEAS (Intelligent and Automated Systems for enabling the Design, Simulation, and Development of Integrated Processes and Products), implemented under the “Action for the Strategic Development on the Research and Technological Sector,” funded by the Operational Programme “Competitiveness, Entrepreneurship, and Innovation” (NSRF 2014-2020), and cofinanced by Greece and the European Union with grant agreement no. MIS 5002462; the project “BBMRI: Biobanking and Biomolecular Resources Research Infrastructure,” which is implemented under the action “Reinforcement of the Research and Innovation Infrastructure,” funded by the Operational Programme “Competitiveness, Entrepreneurship, and Innovation” (NSRF 2014-2020), and cofinanced by Greece and the European Union (European Regional Development Fund) with grant agreement no. MIS5028275; the “Hellenic Network for Precision Medicine” in the framework of the Hellenic Republic – Siemens Settlement Agreement; the Bodossaki Foundation with a postgraduate scholarship; and the project "Employing NGS technology for improved, non-invasive early detection, staging and prediction of progression in lymphoma patients” – TRANSCAN NOVEL, funded by the ERANET on Translational Cancer Research JTC2016 program.
Authorship
Contribution: S.L. designed the research, performed the study, and wrote the study; D.G., S.P., and S.F. performed the study and assisted in data analysis; S.N., M.T., G.V., F.P., and A.C. assisted in research, data analysis, and interpretation; A.A. and N.S. provided patient samples and revised the study; A.K., A.M.M., and D.T. revised the study; M.A. assisted in research and revised the study; N.P. designed the research, assisted in data analysis, and revised the study; and K.S. designed and supervised the research and wrote the study.
Conflict-of-interest disclosure: K.S. and A.C. received research support from Janssen Pharmaceutical. The remaining authors declare no competing financial interests.
Correspondence: Kostas Stamatopoulos, Institute of Applied Biosciences, CERTH, 6th km Charilaou-Thermis, 57001 Thermi, Thessaloniki, Greece; e-mail: kostas.stamatopoulos@certh.gr.

