

Key Points
A recipient variant correlated with DPB1 expression is associated with the risks of GVHD and relapse after unrelated HCT.
Larger cohorts would be needed to detect other genotypic associations with aGVHD, cGVHD, and relapse after allogeneic HCT.

Abstract
Previous studies have identified more than 200 genetic variants associated with acute or chronic graft-versus-host disease (aGVHD; cGVHD) or recurrent malignancy after allogeneic hematopoietic cell transplantation (HCT). We tested these candidate donor and recipient variants in a cohort of 4270 HCT recipients of European ancestry and in subcohorts of 1827 sibling and 1447 unrelated recipients who had 10/10 HLA-A, B, C, DRB1, and DQB1-matched donors. We also carried out a genome-wide association study (GWAS) for these same outcomes. The discovery and replication analysis of candidate variants identified a group of closely linked recipient HLA-DPB1 single-nucleotide polymorphisms (SNPs) associated with an increased risk of aGVHD and a corresponding decreased risk of recurrent malignancy after unrelated HCT. These results reflect a correlation with the level of HLA-DPB1 expression previously shown to affect the risks of aGVHD and relapse in unrelated recipients. Our GWAS identified an association of cGVHD with a locus of X-linked recipient intron variants in NHS, a gene that regulates actin remodeling and cell morphology. Evaluation of this association in a second replication cohort did not confirm the original replication results, and we did not reach any definitive conclusion regarding the validity of this discovery. The cohort used for our study is larger than those used in most previous HCT studies but is smaller than those typically used for other genotype-phenotype association studies. Genomic and disease data from our study are available for further analysis in combination with data from other cohorts.
Introduction
Many studies have suggested that genetic variants in donors and recipients are associated with acute and chronic graft-versus-host disease (aGVHD; cGVHD) and persistent, progressive, or recurrent malignancy (ie, relapse) after allogeneic hematopoietic cell transplantation (HCT). aGVHD and cGVHD represent immune-mediated injury mediated by donor cells in recipient tissues, and to some extent, relapse represents a lack of immune-mediated attack on malignant cells that remain viable in the recipient after the pretransplant conditioning regimen. Genetic association studies could help identify mechanisms that contribute to these outcomes and could be used to stratify patients for appropriate clinical interventions in patients with unusually high or low risk of an outcome.
No large study has comprehensively evaluated genetic associations with the risks of aGVHD, cGVHD, or relapse, and although some associations have been described in multiple publications, the extent of publication bias remains unknown, and the validity of many such associations remains to be determined. In the current study, we took a 2-fold approach to address these gaps. First, from a review of the literature to February 2021, we compiled a list of 213 variants reported as individual SNPs, SNP haplotypes, SNP combinations, or indels having statistically significant associations with aGVHD, cGVHD, or relapse after HCT. We tested 201 of these candidate recipient and donor variants for association with aGVHD, cGVHD, or relapse in a cohort of 4270 HCT recipients of European ancestry with related or unrelated donors at our center. Second, we conducted a genome-wide association study (GWAS) to identify donor and recipient variants associated with the same endpoints. Both analyses used a similar discovery and replication approach to control false-positive results.
Methods
Study population
All recipient and donor blood samples were collected before HCT according to research protocols approved by the FHCRC Institutional Review Board (IRB). Project-specific IRB approval was obtained for the use of clinical data and research biospecimens. The study was conducted in accordance with the Declaration of Helsinki.
The FHCRC study cohort included 4270 recipients of European ancestry who had a first allogeneic HCT with marrow or growth factor-mobilized blood cells at the Fred Hutchinson Cancer Research Center and Seattle Cancer Care Alliance from 1990 through 2011. Syngeneic or cord blood donors were excluded. A single prior autologous HCT was allowed. Conditioning regimens were categorized as myeloablative or nonmyeloablative according to the intensity of chemotherapy and total body irradiation. The study was limited to recipients of European (EUR) ancestry because the number of available non-EUR recipients was too small for a meaningful analysis. EUR ancestry was defined using the minimum covariant determinant method as implemented by Conomos and colleagues.1 Indications for HCT included hematological malignancy or myelodysplasia. Donors and recipient 4-digit typing of HLA-A, B, C, DRB1, and DQB1 alleles was determined as described previously.2 The overall FHCRC study cohort included 1827 recipients with 10/10 HLA-A, B, C, DRB1, DQB1-matched sibling donors and 1447 recipients with 10/10-matched unrelated donors. We used a second cohort from the National Marrow Donor Program (NMDP)/Center for International Blood and Marrow Transplant Research (CIBMTR) Repository to further test the replication of a newly discovered GWAS association. This cohort consisted of 793 recipients with 10/10 HLA-A, B, C, DRB1, DQB1-matched sibling donors. Samples in the NMDP/CIBMTR cohort were self-identified as of EUR ancestry. Genetic ancestry outliers were removed after clustering the samples in the space of the first 2 principal components. Deidentified individual participant data from the Fred Hutch cohort are available in the National Center for Biotechnology Information database of Genotypes and Phenotypes (ncbi.nlm.nih.gov/gap/, accession number phs001918). The supplemental Material file provides complete data from the analysis of candidate variants and a list of the strongest associations from the GWAS.
Literature search
We performed a PubMed search to identify studies that reported a donor or recipient single nucleotide polymorphism (SNP), SNP haplotype, or combinations of SNPs associated with aGVHD, cGVHD, or recurrent malignancy after allogeneic HCT at a statistical significance level of P ≤ .05. Other genetic variants such as tandem repeats associated with these outcomes were excluded because the genotyping arrays used for our study are not informative for such variants.
Sample preparation, genotyping, QA/QC, and imputation
Details regarding the preparation of genomic DNA samples from donors and recipients have been described previously.3 Donor samples were not available for 293 (7%) pairs, and recipient samples were not available for 420 (10%) pairs. Details of DNA amplification, genotyping platforms, hybridization, and genotyping and imputation algorithms have been described previously.2 Genotyping of the NMDP/CIBMTR samples was done via TaqMan assay by the Genomics & Bioinformatics shared resource at FHCRC. Quality assurance and quality control followed standard methods as described previously.2
Endpoints
The 6 outcomes tested in this study included aGVHD categorized as peak grade 2 to 4, 2b to 4, and 3 to 4 severity, stage 2 to 4 gut GVHD, cGVHD, and recurrent or progressive malignancy (ie, relapse). Grade 2b to 4 aGVHD excludes isolated stage 1 gut GVHD, which is frequently recognized at our center.4 cGVHD was diagnosed according to historical criteria because NIH grading was not available for many patients. Donor and recipient variants were evaluated for association with all 6 outcomes regardless of the associations reported previously in the literature.
Statistical analysis
Candidate variants were assessed for association with outcomes under allelic, recessive, and dominant genotypic models. For a variant with major and minor alleles ‘a’ and ‘b,’ the allelic model tests whether the number of minor ‘b’ alleles (0, 1, or 2) in the donor or recipient is associated with the risk of aGVHD, cGVHD, or relapse. The recessive genotypic model compares outcomes associated with ‘bb’ genotype vs the combined ‘aa’ and ‘ab’ genotypes, while the dominant genotypic model compares outcomes with the combined ‘bb’ and ‘ab’ genotypes vs the ‘aa’ genotype.
The association of genotypes with each outcome was based on cause-specific hazard ratio (HR) analysis using Cox regression, treating death as a competing risk for all endpoints and relapse as a competing risk for aGVHD and cGVHD. All analyses were conducted in 2 phases. The FHCRC study cohort was randomized in a 3:2 split into discovery and replication cohorts. Accordingly, the overall discovery cohort included a total of 2560 recipients, 1096 with 10/10 HLA-matched sibling donors and 884 with 10/10 HLA-matched unrelated donors. Candidate variants with P ≤ .005 for association with an outcome in the discovery cohort were tested in the replication cohort as described below. Posthoc power estimates for discovery were calculated for an HR ≥1.5 or ≤0.67, based on the estimated standard error of the log HR and a 2-sided .005 significance level.
The GWAS included both the recipient and donor genomes and all 6 outcomes but was limited to the allelic model. Variants with minor allele frequencies (MAFs) >0.01 and P ≤ 5.0 × 10⁻⁷ for association with an outcome in the discovery phase were tested in the replication phase.
In replication testing of candidate and genome-wide discoveries, Bonferroni adjustments for multiple comparisons was applied separately for the 18 combinations of genome (donor and recipient), endpoint (aGVHD, cGVHD, and relapse), and cohort (all patients, matched sibling, and matched unrelated) but did not include different genetic models or subcategories of aGVHD applied to the same variant, and variants in linkage disequilibrium with r2 > 0.7 for the same genome-outcome association were counted only once. Posthoc power estimates for replication were calculated for the discovery HR point estimate and the estimated standard error of the replication log HR, with a Bonferroni-corrected significance level reflecting the number of discovery findings.
Genotype-phenotype associations replicated in univariable analysis were tested in a multivariable analysis that adjusted for clinical covariates known to be associated with the endpoint, although such covariates cannot be confounders of a genotype-phenotype association unless they are also related to the genotype in question, which is generally implausible.
Results
Evaluation of candidates for associations with aGVHD, cGVHD, and relapse
The literature search identified 196 unique variants, 16 haplotypes, and 1 SNP combination associated with aGVHD, cGVHD, or relapse (supplemental Tables 1 and 2). Among these, 167 were associated with aGVHD, 64 with cGVHD, and 43 with relapse. Supplemental Table 3 summarizes the quality control assessment of the candidate variants genotyped or imputed on the 3 platforms used for our study and used for analysis. For 3 variants (rs333, rs5902434, and rs16375) that failed QC or were not in our data set, we used rs113341849, rs2037973, and rs1633078, respectively, as proxies for analysis (r2 ≥ 0.97). Twelve other variants that failed QC or were not in our data set (rs11023435, rs1131012, rs12953, rs16375, rs281865545, rs2910164, rs3211371, rs366631, rs396991, rs4415345, rs5902434, rs71647806) could not be analyzed because no appropriate proxies could be identified.
Table 1 summarizes demographic, clinical, and transplant characteristics of patients in the FHCRC study cohort. As expected, the subcohort of 10/10 HLA-matched unrelated recipients differed from the 10/10 HLA-matched sibling recipients in having younger donors, more frequent HLA-DPB1 mismatching, and less frequent use of single agents for immunosuppression after HCT. Supplemental Figure 1 shows the cumulative incidence frequencies of aGVHD, cGVHD, and relapse in the overall FHCRC study cohort and the related and unrelated subcohorts.
Characteristics of the study cohorts
| Characteristic | All patients (n = 4270) n (%) | Siblings (n = 1827) n (%) | Unrelated (n = 1447) n (%) |
|---|---|---|---|
| Recipients genotyped | 3850 (90) | 1676 (92) | 1315 (91) |
| Donors genotyped | 3977 (93) | 1780 (97) | 1338 (92) |
| Patient age at transplantation, y | 43 (0-78) | 45 (0-74) | 44 (0-78) |
| Median | 0 | 0 | 0 |
| Range | 78 | 74 | 78 |
| Donor age, y | 39 | 44 | 33 |
| Median | 19 | 0 | 18 |
| Range | 83 | 83 | 61 |
| Diagnosis | |||
| Acute leukemia | 1761 (41) | 698 (38) | 602 (42) |
| Chronic myeloid leukemia | 1032 (24) | 378 (21) | 342 (24) |
| Myelodysplastic syndrome or myeloproliferative neoplasm | 736 (17) | 297 (16) | 298 (21) |
| Chronic lymphocytic leukemia | 116 (3) | 61 (3) | 43 (3) |
| Malignant lymphoma or multiple myeloma | 625 (15) | 393 (22) | 162 (11) |
| Disease risk* | |||
| Low | 936 (22) | 385 (21) | 314 (22) |
| Intermediate | 1199 (28) | 465 (25) | 460 (32) |
| High | 1881 (44) | 871 (48) | 567 (39) |
| Not classified | 254 (6) | 106 (6) | 106 (7) |
| Donor-recipient gender | |||
| Male to male | 1438 (34) | 563 (31) | 560 (39) |
| Male to female | 953 (22) | 389 (21) | 345 (24) |
| Female to male | 1038 (24) | 500 (27) | 290 (20) |
| Female to female | 839 (20) | 375 (21) | 251 (17) |
| Graft source | |||
| Bone marrow | 2325 (54) | 905 (50) | 701 (48) |
| Mobilized blood cells | 1945 (46) | 922 (50) | 746 (52) |
| Conditioning | |||
| Myeloablative <900 cGy total body irradiation | 1515 (35) | 840 (46) | 456 (32) |
| Myeloablative ≥900 cGy total body irradiation | 2021 (47) | 674 (37) | 664 (46) |
| Nonmyeloablative | 734 (17) | 313 (17) | 327 (23) |
| Initial posttransplant immunosuppression | |||
| Cyclosporine and methotrexate | 2363 (55) | 959 (52) | 684 (47) |
| Cyclosporine and mycophenolate mofetil | 672 (16) | 298 (16) | 291 (20) |
| Tacrolimus and methotrexate | 608 (14) | 183 (10) | 303 (21) |
| Tacrolimus and mycophenolate mofetil | 169 (4) | 74 (4) | 86 (6) |
| Cyclosporine or tacrolimus alone | 218 (5) | 198 (11) | 8 (1) |
| Methotrexate or mycophenolate mofetil alone | 76 (2) | 70 (4) | 3 (<1) |
| Other (cyclophosphamide or antithymocyte globulin) | 164 (4) | 45 (2) | 72 (5) |
Low risk is chronic myeloid leukemia in chronic phase or myelodysplastic syndrome-refractory anemia; intermediate risk, acute leukemia, chronic lymphocytic leukemia, or non-Hodgkin lymphoma in remission; high risk, all others.
The 196 tested candidate variants in the donor and recipient genomes were tested for association with the 3 outcomes according to the 3 genetic models in the overall FHCRC cohort and the related and unrelated subcohorts, respectively (supplemental Tables 4-6). Table 2 summarizes the discovery and replication results for the overall study cohort and the sibling and unrelated donor cohorts according to the donor and recipient genomes and the outcomes. In this summary, different subcategories of aGVHD and different genetic models associated with the same variant and outcome were counted only once. The discovery analysis identified 66 variant-outcome associations with P ≤ 5 × 10⁻³ (supplemental Tables 7-9). These 66 variant-outcome associations were reduced to 50 signals when groups of variants with linkage disequilibrium r2 ≥ 0.7 were counted only once for any given outcome association. Three of the 50 signals were replicated, 1 for relapse in the overall study cohort, and 1 each for aGVHD and relapse in the unrelated subcohort, all representing recipient HLA-DPB1 variants in high linkage disequilibrium with each other (r2 > 0.7).
Summary of candidate variant results
| Outcome, cohort, and genome | Number of discovery variants* | Number of discovery signals† | Number of replicated signals‡ |
|---|---|---|---|
| aGVHD§ | |||
| All donors | 6 | 5 | 0 |
| All recipients | 7 | 6 | 0 |
| 10/10 HLA-matched sibling donors | 10 | 6 | 0 |
| 10/10 HLA-matched sibling recipients | 5 | 5 | 0 |
| 10/10 HLA-matched unrelated donors | 5 | 3 | 0 |
| 10/10 HLA-matched unrelated recipients | 12 | 9 | 1 |
| cGVHD | |||
| All donors | 0 | 0 | 0 |
| All recipients | 2 | 2 | 0 |
| 10/10 HLA-matched sibling donors | 2 | 2 | 0 |
| 10/10 HLA-matched sibling recipients | 1 | 1 | 0 |
| 10/10 HLA-matched unrelated donors | 2 | 2 | 0 |
| 10/10 HLA-matched unrelated recipients | 2 | 1 | 0 |
| Relapse | |||
| All donors | 3 | 3 | 0 |
| All recipients | 2 | 1 | 1 |
| 10/10 HLA-matched sibling donors | 0 | 0 | 0 |
| 10/10 HLA-matched sibling recipients | 4 | 3 | 0 |
| 10/10 HLA-matched unrelated donors | 0 | 0 | 0 |
| 10/10 HLA-matched unrelated recipients | 3 | 1 | 1 |
P < .005; counts do not include different genetic models for the same outcome.
Groups of variants with r2 > 0.7.
Threshold P values corrected for the number of discovery signals.
Different subcategories of aGVHD associated with the same variant are counted only once.
Table 3 shows results for all candidate HLA-DPB1-recipient variants that met or approached Bonferroni-adjusted significance for association with aGVHD or relapse in the FHCRC replication cohort. In the overall replication cohort, the combined recipient A/G or GG genotypes of rs9277378 were associated with an increased risk of grade 2b to 4 aGVHD compared with the recipient AA genotype. In unrelated recipients, each minor allele of rs927378, rs9277535, or rs9277542 was associated with a stepwise 25% to 30% increased risk of grade 2b to 4 aGVHD in the allelic model (Figure 1A). These 3 variants did not have any statistically significant association with the risk of grade 2b to 4 aGVHD in the sibling subcohort (rs9277542, allelic model: HR, 1.08; 95% CI, 0.93-1.24; P = .32). In the overall replication cohort, recipients with the homozygous minor alleles of rs9277378 and rs9277542 had an approximately 30% lower risk of relapse compared with recipients with other genotypes. Unrelated recipients with the homozygous minor alleles of rs9277378, rs9277535, and rs9277542 had an approximately 55% lower risk of relapse compared with unrelated recipients with other genotypes (Figure 1B). These 3 recipient variants did not have any statistically significant association with the risk of relapse in the sibling subcohort (rs9277542, recessive model: HR, 0.72; 95% CI, 0.48-1.09; P = .10).
Association of candidate HLA-DPB1-recipient variants with aGVHD and relapse after HCT
| Discovery results | Replication results | |||||||||||||||
|---|---|---|---|---|---|---|---|---|---|---|---|---|---|---|---|---|
| Variant | Alleles* | Cohort | Endpoint | Model | MAF† | P | HR | LB | UB | Signals | Bf-C | P | HR | LB | UB | Power‡ |
| rs9277378 | A/G | ALL | GVHD2b | Dominant | 0.29 | .003 | 1.19 | 1.1 | 1.3 | 6 | 0.008 | .01 | 1.20 | 1.0 | 1.4 | 41 |
| rs9277378 | A/G | URD | GVHD2b | Allelic | 0.28 | .0008 | 1.28 | 1.1 | 1.5 | 9 | 0.006 | .008 | 1.28 | 1.1 | 1.5 | 47 |
| rs9277535 | A/G | URD | GVHD2b | Allelic | 0.24 | .003 | 1.26 | 1.1 | 1.5 | 9 | 0.006 | .01 | 1.27 | 1.1 | 1.5 | 39 |
| rs9277542 | T/C | URD | GVHD2b | Allelic | 0.29 | .0004 | 1.29 | 1.1 | 1.5 | 9 | 0.006 | .006 | 1.28 | 1.1 | 1.5 | 54 |
| rs9277378 | A/G | ALL | Relapse | Recessive | 0.29 | .002 | 0.63 | 0.5 | 0.9 | 1 | 0.05 | .05 | 0.72 | 0.5 | 1.0 | 73 |
| rs9277542 | T/C | ALL | Relapse | Recessive | 0.29 | .0004 | 0.59 | 0.4 | 0.8 | 1 | 0.05 | .04 | 0.70 | 0.5 | 1.0 | 83 |
| rs9277378 | A/G | URD | Relapse | Recessive | 0.29 | .001 | 0.40 | 0.2 | 0.8 | 1 | 0.05 | .03 | 0.49 | 0.2 | 1.0 | 71 |
| rs9277535 | A/G | URD | Relapse | Recessive | 0.24 | .005 | 0.40 | 0.2 | 0.9 | 1 | 0.05 | .02 | 0.41 | 0.2 | 1.0 | 53 |
| rs9277542 | T/C | URD | Relapse | Recessive | 0.29 | .0008 | 0.39 | 0.2 | 0.7 | 1 | 0.05 | .01 | 0.45 | 0.2 | 0.9 | 73 |
P values in bold met prespecified statistical criteria for replication. Bf-C indicates the threshold P value after Bonferroni correction for the number of discovery signals in each cohort-endpoint combination.
Chr, chromosome; HR, hazard ratio; LB, lower boundary of the 95% confidence interval; MAF, minor allele frequency; SNP, single nucleotide polymorphism; UB, upper boundary of the 95% confidence interval; URD, unrelated.
Plus-strand major/minor alleles.
Minor allele frequency in the combined discovery and replication samples used for the evaluation.
Estimates represent the power to detect the discovery effect size at the 2-sided Bonferroni-corrected significance level using the observed replication standard error.
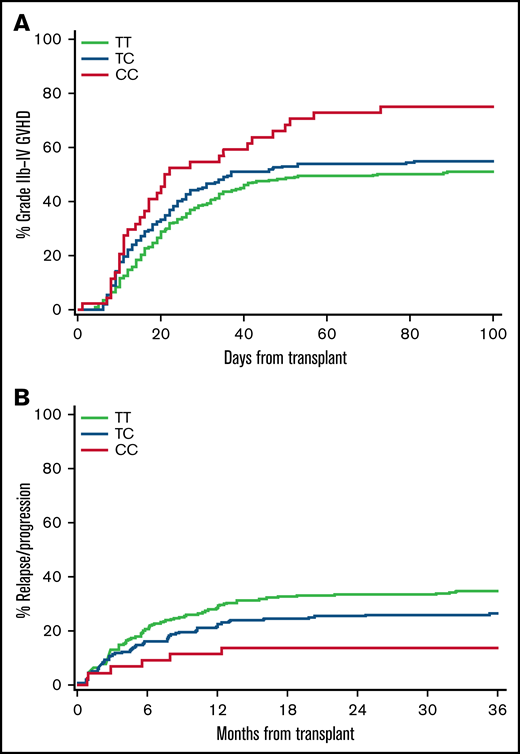
Recipient genotypes of rs9277542 are associated with risks of aGVHD and recurrent malignancy in HLA-10/10-matched unrelated recipients. (A) Cumulative incidence of grade 2b to 4 aGVHD according to recipient rs9277542 genotypes in the replication cohort. Grades 2b to 4 aGVHD excludes isolated upper gastrointestinal GVHD. (B) Cumulative incidence of recurrent malignancy according to rs9277542 genotypes in the replication cohort.
Recipient genotypes of rs9277542 are associated with risks of aGVHD and recurrent malignancy in HLA-10/10-matched unrelated recipients. (A) Cumulative incidence of grade 2b to 4 aGVHD according to recipient rs9277542 genotypes in the replication cohort. Grades 2b to 4 aGVHD excludes isolated upper gastrointestinal GVHD. (B) Cumulative incidence of recurrent malignancy according to rs9277542 genotypes in the replication cohort.
Multivariate analyses with adjustments for donor type, donor-recipient gender combination, patient and donor age, marrow or growth factor-mobilized blood cell graft, the intensity of the conditioning regimen and use of total body irradiation, initial GVHD prophylaxis regimens, and disease risk group did not change the HR estimates in the replication cohort (Table 4). In the replication cohort, HR for the associations with the risk of grade 2b to 4 aGVHD and relapse were modestly attenuated after adjustment for the number of graft-versus-host, host-versus-graft, and bidirectional HLA-DPB1 mismatches; the number of mismatched high expression HLA-DPB1 alleles in the recipient; the presence of nonpermissive T-cell epitope mismatching; and in the overall cohort, the number of HLA-A, B, C, DRB1, and DQB1 mismatches (Table 4). These results indicate that the recipient HLA-DPB1 variants are associated with recipient HLA-DPB1 mismatching, which at least partly accounts for the observed associations with grades 2b to 4 aGVHD and relapse.
Adjusted association of candidate HLA-DPB1-recipient variants with aGVHD and relapse in the replication cohort
| Unadjusted | Clinical adjustment* | HLA-DPB1 adjustment† | |||||||||||||
|---|---|---|---|---|---|---|---|---|---|---|---|---|---|---|---|
| Variant | Cohort | Endpoint | Model | P | HR | LB | UB | P | HR | LB | UB | P | HR | LB | UB |
| rs9277378 | ALL | GVHD2b | Dominant | .01 | 1.20 | 1.0 | 1.4 | .01 | 1.20 | 1.0 | 1.4 | .31 | 1.09 | 0.9 | 1.3 |
| rs9277378 | URD | GVHD2b | Allelic | .008 | 1.28 | 1.1 | 1.5 | .01 | 1.27 | 1.1 | 1.5 | .23 | 1.21 | 0.9 | 1.7 |
| rs9277535 | URD | GVHD2b | Allelic | .01 | 1.27 | 1.1 | 1.5 | .03 | 1.24 | 1.0 | 1.5 | .49 | 1.11 | 0.8 | 1.5 |
| rs9277542 | URD | GVHD2b | Allelic | .006 | 1.28 | 1.1 | 1.5 | .008 | 1.29 | 1.1 | 1.5 | .22 | 1.22 | 0.9 | 1.7 |
| rs9277378 | ALL | Relapse | Recessive | .05 | 0.72 | 0.5 | 1.0 | .03 | 0.69 | 0.5 | 1.0 | .19 | 0.79 | 0.5 | 1.1 |
| rs9277542 | ALL | Relapse | Recessive | .04 | 0.70 | 0.5 | 1.0 | .02 | 0.68 | 0.5 | 1.0 | .16 | 0.78 | 0.5 | 1.1 |
| rs9277378 | URD | Relapse | Recessive | .03 | 0.49 | 0.2 | 1.0 | .01 | 0.44 | 0.2 | 0.9 | .18 | 0.59 | 0.3 | 1.3 |
| rs9277535 | URD | Relapse | Recessive | .02 | 0.41 | 0.2 | 1.0 | .01 | 0.37 | 0.2 | 0.9 | .12 | 0.47 | 0.2 | 1.4 |
| rs9277542 | URD | Relapse | Recessive | .01 | 0.45 | 0.2 | 0.9 | .005 | 0.41 | 0.2 | 0.8 | .13 | 0.55 | 0.2 | 1.2 |
See Table 3 for definitions.
Adjustment factors for GVHD 2b included donor type, donor-recipient gender combination, patient and donor age, marrow or growth factor-mobilized blood cell graft, intensity of the conditioning regimen and use of total body irradiation, and initial GVHD prophylaxis regimens. Adjustment factors for relapse also included the disease risk group.
Adjustment factors included the number of GVH, HVG, and bidirectional HLA-DPB1 mismatches; the number of mismatched high expression HLA-DPB1 alleles in the recipient; the presence of nonpermissive T-cell epitope mismatching; the number of HLA-A, B, C, DRB1, and DQB1 mismatches in the overall cohort.
Power constraints in the analysis of candidate variants
Posthoc analysis of results in the overall discovery cohort showed that power to detect HR ≤0.67 or ≥1.5 using the allelic model at a 2-sided significance level of .005 was at least 80% for most of the variants tested for association with all endpoints except stage 2 to 4 gut GVHD (supplemental Figure 2). Among sibling recipients, power was lower for both stage 2 to 4 aGVHD and grade 3 to 4 aGVHD, and among unrelated recipients, power was lower for stage 2 to 4 aGVHD, grade 3 to 4 aGVHD, and cGVHD.
GWAS of variant associations with aGVHD, cGVHD, and relapse
Supplemental Tables 10 and 11 summarize the GWAS discovery results and quality control results from the testing donor and recipient genotype associations with aGVHD, cGVHD, and relapse in the overall FHCRC cohort and the sibling and unrelated subcohorts. The discovery analysis identified 274 variant-outcome associations with P ≤ 5 × 10⁻⁷ (Table 5). These 274 variant-outcome associations were reduced to 52 signals when groups of variants with linkage disequilibrium r2 ≥ 0.7 were counted only once for any given outcome association. Only 1 of the 49 signals was replicated. In the sibling cohort, the minor alleles of rs12557901 and 4 other recipient variants with mutual r2 > 0.9 were associated with a decreased risk of cGVHD (Table 6). Figure 2A shows the cumulative incidence frequencies of cGVHD according to the recipient rs12559701 genotypes and sex in the sibling cohort. Figure 2B shows the location of the variant on the X chromosome. The locus contains a distinct cluster of 14 variants with mutual r2 > 0.8, spanning a 14.5 kb region in the first intron of NHS. These variants encompass regulatory elements in numerous tissues (supplemental Figure 3).
Summary of GWAS results
| Outcome, cohort, and genome | Number of discovery variants* | Number of discovery signals† | Number of replicated signals‡ |
|---|---|---|---|
| aGVHD§ | |||
| All donors | 7 | 4 | 0 |
| All recipients | 155 | 9 | 0 |
| 10/10 HLA-matched sibling donors | 28 | 7 | 0 |
| 10/10 HLA-matched sibling recipients | 34 | 5 | 0 |
| 10/10 HLA-matched unrelated donors | 8 | 3 | 0 |
| 10/10 HLA-matched unrelated recipients | 13 | 8 | 0 |
| cGVHD | |||
| All donors | 3 | 1 | 0 |
| All recipients | 5 | 3 | 0 |
| 10/10 HLA-matched sibling donors | 0 | 0 | 0 |
| 10/10 HLA-matched sibling recipients | 8 | 2 | 1 |
| 10/10 HLA-matched unrelated donors | 2 | 1 | 0 |
| 10/10 HLA-matched unrelated recipients | 2 | 2 | 0 |
| Relapse | |||
| All donors | 1 | 1 | 0 |
| All recipients | 1 | 1 | 0 |
| 10/10 HLA-matched sibling donors | 2 | 1 | 0 |
| 10/10 HLA-matched sibling recipients | 3 | 2 | 0 |
| 10/10 HLA-matched unrelated donors | 1 | 1 | 0 |
| 10/10 HLA-matched unrelated recipients | 1 | 1 | 0 |
P < 5 × 10⁻⁷.
Groups of variants with r2 > 0.7.
Threshold P values corrected for the number of discovery signals.
Different subcategories of aGVHD associated with the same variant are counted only once.
Association of recipient variants with cGVHD in 10/10 HLA-matched siblings
| Discovery results | Replication results | ||||||||||
|---|---|---|---|---|---|---|---|---|---|---|---|
| Variant* | Gene | Alleles† | MAF‡ | P | HR§ | LB | UB | Pǁ | HR§ | LB | UB |
| rs12559701 | NHS | C/T | 0.37 | 2.4E-07 | 0.70 | 0.6 | 0.8 | .005 | 0.79 | 0.7 | 0.9 |
| rs12558116 | NHS | T/C | 0.37 | 4.2E-07 | 0.71 | 0.6 | 0.8 | .005 | 0.79 | 0.7 | 0.9 |
| rs7057951 | NHS | C/A | 0.36 | 3.6E-07 | 0.70 | 0.6 | 0.8 | .011 | 0.81 | 0.7 | 1.0 |
| rs17246484 | NHS | T/C | 0.36 | 4.7E-07 | 0.71 | 0.6 | 0.8 | .007 | 0.80 | 0.7 | 0.9 |
| rs12007131 | NHS | T/C | 0.37 | 3.8E-07 | 0.70 | 0.6 | 0.8 | .006 | 0.80 | 0.7 | 0.9 |
HR, hazard ratio; LB, lower boundary of the 95% confidence interval; MAF, minor allele frequency; SNP, single nucleotide polymorphism; UB, upper boundary of the 95% confidence interval.
All variants are in strong linkage disequilibrium with r2 > 0.90.
Plus strand major/minor alleles.
MAFs in the samples used for the test.
HRs reflect the allelic model.
The Bonferroni-corrected threshold of statistical significance is 0.025 based on the number of signals.
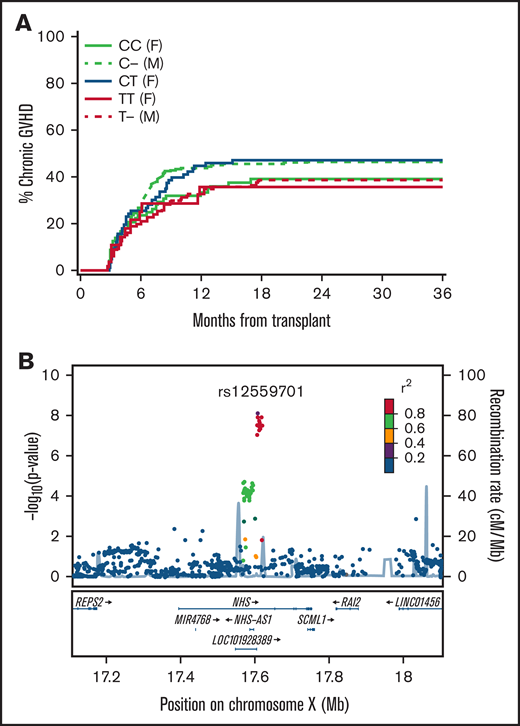
Recipient genotypes of rs12559701 are associated with the risk of cGVHD in the HLA-10/10-matched sibling cohort. (A) Cumulative incidence of cGVHD according to recipient rs125597901 genotypes and gender in the replication cohort. (B) Locus-zoom plot shows -log10 (P values) for association with cGVHD in the combined discovery and replication cohorts as a function of position in a 0.5 Mb region on either side of rs12559701 on chromosome X. Correlation coefficient r2 values for linkage disequilibrium with rs12559701 are coded according to the inset. Genes within this region are displayed in the lower panel.
Recipient genotypes of rs12559701 are associated with the risk of cGVHD in the HLA-10/10-matched sibling cohort. (A) Cumulative incidence of cGVHD according to recipient rs125597901 genotypes and gender in the replication cohort. (B) Locus-zoom plot shows -log10 (P values) for association with cGVHD in the combined discovery and replication cohorts as a function of position in a 0.5 Mb region on either side of rs12559701 on chromosome X. Correlation coefficient r2 values for linkage disequilibrium with rs12559701 are coded according to the inset. Genes within this region are displayed in the lower panel.
The recipients’ NHS variants were not associated with the risk of cGVHD after HCT from unrelated donors (HR, 0.95; 95% CI, 0.80-1.14; P = .60), which raised concern that the association in related recipients was not valid, despite its replication in the FHCRC cohort. To assess the validity of this observation, we tested the association in an independent cohort of 10/10 HLA-matched sibling recipients from the NMDP. Characteristics of this cohort are summarized in supplemental Table 12. In this independent cohort, the minor allele of rs12559701 was not associated with a decreased risk of cGVHD (HR, 1.1; 95% CI, 0.98-1.24; P = .10). Multivariate adjustment for clinical risk factors did not change the association of rs12559701 with cGVHD in either replication cohort (results not shown).
Discussion
Our rigorous discovery and replication testing of candidates for associations with aGVHD, cGVHD, and relapse identified a group of closely linked recipient HLA-DPB1 variants associated with an increased risk of aGVHD and a corresponding decreased risk of recurrent malignancy after unrelated HCT. These associations did not reach statistical significance in sibling recipients, although the HR point estimate was >1.0 for the risk of aGVHD and <1.0 for the risk of relapse. Our GWAS identified an association of cGVHD with a locus of X-linked recipient intron variants in NHS, a gene that regulates actin remodeling and cell morphology.5-7 Mutations in NHS have been implicated in Nance-Horan syndrome,8 which is characterized by craniofacial developmental abnormalities.9 The NHS variants identified in the current study were associated with a decreased risk of cGVHD in sibling recipients but not in unrelated recipients. Evaluation of this association in a second replication cohort did not confirm the original replication results.
Three previous studies have identified a group of recipient HLA-DPB1-linked variants associated with aGVHD after unrelated HCT. Petersdorf and colleagues10 showed that rs9277534 alleles are associated with different levels of HLA-DPB1 expression. DPB1 genes with the rs9277534-A allele have lower expression than those with the rs9277534-G allele. The effects of differences in DPB1 expression were evaluated in unrelated donor-recipient pairs who were matched for the HLA-DPB1 allotype but mismatched for the other. After HCT from donors having mismatched HLA-DPB1 allotypes with low expression, the risk of grades 2 to 4 aGVHD corresponded with expression of the mismatched HLA-DPB1 allotype in the recipient: high expression in the recipient was associated with a higher risk of aGVHD compared with those with low expression. The same type of analysis showed a corresponding association with a lower risk of relapse in recipients with high HLA-DPB1 expression.
Goyal and colleagues11 reported an alternative GWAS approach using pooled donor samples and pooled recipient samples from cases with grade 3 to 4 GVHD compared with controls with no aGVHD. The 2 HLA-DPB1 variants identified in this study were rs9277378 and rs9277542, which were also identified in our study. The authors noted that these 2 SNPs have high linkage with rs9277534 (rs9277378 r2 = 0.96, rs9277542 r2 = 1.0). The use of a case-control design did not allow an analysis of survival or population-based estimates of the risks of aGVHD. Goyal and colleagues11 also identified an association of rs9277341 with grade 3 to 4 GVHD. The authors noted that this intronic HLA-DPA1 variant is in linkage disequilibrium with rs3077, a 3′-UTR variant associated with HLA-DPA1 expression (r2 = 0.48). In our discovery cohort, the recipient rs9277341 genotype was associated with grade 2b to 4 aGVHD in the allelic model (HR, 1.28; 95% CI, 1.08-1.52; P = .004) and the dominant model (HR, 1.39; 95% CI, 1.11-1.74; P = .003) (supplemental Table 7). These results were not confirmed in our replication cohort (allelic model HR, 1.06; 95% CI, 0.85-1.33; P = .62; dominant model HR, 1.23; 95% CI, 0.93-1.63; P = .16), although the power for replication after Bonferroni correction was low.
More recently, Petersdorf and colleagues12 extended their earlier results by showing that high expression HLA-DPB1 alleles in the recipient increased the risk of aGVHD regardless of the expression level in the donor and by showing that each HLA-DPB1-recipient mismatch increases the risk of aGVHD when added to a single HLA-A, B, C, DRB1, or DQB1 mismatch. This study also confirmed previous results showing that the risk of aGVHD is higher when recipient HLA-DPB1 mismatching involves a nonpermissive T-cell epitope compared with mismatching that involves a permissive epitope.13,14 Linkage disequilibrium between rs9277341 and the HLA-DPB1 alleles associated with GVHD and relapse in our study accounts for the attenuation of HRs in the analyses that were adjusted for HLA-DPB1 expression, T-cell epitope mismatching, and the number of HLA-A, B, C, DRB1, and DQB1 mismatches. Our data are not sufficient to determine whether the HLA-DPB1 variants that we identified have any association with aGVHD or relapse that is independent of HLA-DPB1 expression.
NHS encodes a variety of splice variants and protein isoforms that have multifunctional activities. Within the locus we identified, rs7892218 and rs5909459 variants have enhancer activity,15 and all 14 variants have been identified as expression quantitative trait loci with lower expression of NHS in cultured fibroblasts and sigmoid colon and higher expression in the pancreas (Gtex Portal, accessed on 26 April 2021). We could not identify mechanisms that might account for an association of recipient NHS variants with the risk of cGVHD, and we could not explain how this association might apply in sibling recipients but not in unrelated recipients. These considerations motivated our effort to test the association of the NHS locus with cGVHD in a second replication cohort. In both replication cohorts, cGVHD was diagnosed according to historical criteria, and demographic and transplant characteristics were similar in the 2 replication cohorts. In testing rs12559701 as a representative of the locus, however, we found no evidence to support an association with cGVHD in the second replication cohort. For this reason, we did not reach any definitive conclusion regarding the validity of this discovery.
Our analyses have some limitations. First, we were not able to evaluate copy number variants that have been implicated as important determinants of GVHD or relapse in some studies. Second, the sample sets of up to 3850 recipients and 3977 donors used for discovery are small relative to many of the datasets used for current GWAS analyses. Accordingly, the 1 × 10⁻⁶ threshold of statistical significance that we used for GWAS discovery is much less stringent than the 5 × 10⁻⁸ threshold typically used for genome-wide significance. Finally, our analysis is subject to false-positive results that are frequently observed by chance. We attempted to control false-positive results by using a discovery and replication approach in both our candidate variant and GWAS analyses.
A further consideration is that the analysis was restricted to EUR ancestry samples since they made up the predominant ancestral group (86%) in our study. Though unlikely, including a relatively small number of samples from multiple other non-EUR or admixed populations could lead to false-positive or false-negative results due to nongenetic associations of ancestry with GVHD or relapse. Deidentified individual donor and recipient genomic and disease data from the Fred Hutch cohort are available from the National Center for Biotechnology Information database of Genotypes and Phenotypes (dbGAP) (accession #phs001918) to be combined with data from other centers for analyses of other ancestral groups.
Our results do not exclude the possibility that variants other than the 2 that we identified in this study are associated with risks of GVHD or relapse. As a striking example, at least 10 previous reports have shown that the recipient rs1800872 genotype in IL10 is associated with the risk of aGVHD (supplemental Table 1). In the current study, this candidate did not meet the P < .005 threshold prespecified for discoveries to avoid an excessive statistical penalty for multiple comparisons in testing for replication, although 4 of the 12 tests for association in the overall recipient cohort had P values between .01 and .03. In the analysis of candidate variants, power was adequate to detect HRs >1.5 or <0.67 for all endpoints except stage 2 to 4 gut GVHD in the overall cohort, making it unlikely that our analysis missed associations with more extreme HRs that would have unquestionable clinical significance. Supplemental Tables 12 and 13 summarize the combined discovery plus replication cohort-wide statistical analysis and quality control results from testing donor and recipient variants with MAF >1% and P ≤ 5 × 10⁻⁷ for association with aGVHD, cGVHD, or relapse with the allelic model for metanalysis with results from other cohorts.
Acknowledgments
The authors thank Angela M. Bryce for DNA extraction of NMDP/CIBMTR samples. Genotyping of these samples was done by the genomics shared resource supported by the Fred Hutch/University of Washington Cancer Consortium (P30 CA015704).
This work was supported by grants from the National Institutes of Health AI33484, AI049213, CA015704, CA18029, HL087690, HL088201, HL094260, and HL105914. The Genotype-Tissue Expression (GTEx) Project was supported by the Common Fund of the Office of the Director of the National Institutes of Health and by NCI, NHGRI, NHLBI, NIDA, NIMH, and NINDS. Deidentified samples and data were provided by the NMDP/CIBMTR supported primarily by Public Health Service U24CA076518 from the National Cancer Institute (NCI), the National Heart, Lung and Blood Institute (NHLBI), and the National Institute of Allergy and Infectious Diseases (NIAID), by HHSH250201700006C from the Health Resources and Services Administration (HRSA), and by N00014-20-1-2705 and N00014-20-1-2832 from the Office of Naval Research.
Authorship
Contribution: J.A.H., P.J.M., D.M.L., and B.E.S. were responsible for the study concept and design, interpretation of results, and writing of the manuscript; D.M.L. and B.E.S. were responsible for data acquisition, imputation, informatics analyses, quality control, and statistical analyses; C.L.S. genotyped NMDP/CIBMTR samples; S.R.S. provided NMDP/CIBMTR samples and deidentified clinical data, and all authors other than J.A.H. revised draft manuscripts and approved the final version of the manuscript.
Conflict-of-interest disclosure: The authors declare no competing financial interests.
John A. Hansen died on 31 July 2019.
Correspondence: Paul J. Martin, Fred Hutchinson Cancer Research Center, 1100 Fairview Ave N, Seattle, WA 98109-1024; e-mail: pmartin@fredhutch.org.

