

Key Points
OS and ORR of tisagenlecleucel were compared with those of historical therapy for r/r DLBCL after ≥2 therapy lines.
Tisagenlecleucel was associated with significantly longer OS and higher response rate vs historical therapy.
Visual Abstract

Abstract
No head-to-head trials have compared the efficacy of tisagenlecleucel vs historical treatments for adults with relapsed or refractory diffuse large B-cell lymphoma (r/r DLBCL). This study indirectly compared the overall survival (OS) and overall response rate (ORR) associated with tisagenlecleucel, using data from the JULIET study (Study of Efficacy and Safety of CTL019 in Adult DLBCL Patients; #NCT02445248), vs historical treatments assessed in the CORAL (Collaborative Trial in Relapsed Aggressive Lymphoma) study follow-up population. To assess treatment effects in the treated (full analysis set [FAS]) and enrolled (intention-to-treat [ITT]) study populations, the JULIET FAS vs the CORAL follow-up FAS and JULIET ITT vs CORAL follow-up ITT populations were separately compared. Propensity score weighting using standardized mortality ratio weight (SMRW) and fine stratification weight (FSW) was used to compare OS and ORR, adjusting for baseline confounders. The results indicated that tisagenlecleucel was associated with a lower hazard of death among the FAS (adjusted hazard ratio [95% confidence interval], both FSW and SMRW, 0.44 [0.32, 0.59]) and ITT populations (FSW, 0.60 [0.44, 0.77]; SMRW, 0.57 [0.44, 0.73]; all, P < .001). Median OS was 12.48 months (JULIET) vs 4.34 to 4.40 months (CORAL) for the FAS, and 8.25 (JULIET) months vs 4.04 to 4.86 (CORAL) months for the ITT populations. Tisagenlecleucel was associated with a significantly higher ORR compared with historical treatments among the FAS (adjusted response rate difference [95% confidence interval], both FSW and SMRW, 36% [22%, 0.48%]; P < .001) and among the ITT populations after SMRW adjustment (11% [0%, 22%]; P = .043). This analysis supports that improved response and OS are achieved in patients with r/r DLBCL treated with tisagenlecleucel compared with those treated with alternative historical treatments.
Introduction
Diffuse large B-cell lymphoma (DLBCL), the most common subtype of non-Hodgkin lymphoma,1,2 has an annual incidence of new cases of ∼5.6 per 100 000 in the United States.3 DLBCL is commonly first treated with a combination of chemotherapy and the monoclonal antibody rituximab, although ∼30% to 40% of patients ultimately relapse or develop refractory (r/r) disease.4,5 For these patients, chemoimmunotherapy followed by consolidation with high-dose therapy and autologous hematopoietic cell transplantation (autoHCT) for responders offers the best chance of cure.6 However, approximately one-half of patients are ineligible or unwilling to undergo autoHCT,7 and outcomes after relapse post-autoHCT are poor.8,9 Before the introduction of chimeric antigen receptor T-cell (CAR-T) therapies, adults with r/r DLBCL not receiving autoHCT had few treatment options after second line (2L) therapy, primarily limited to salvage chemotherapy, palliative therapy, and/or best supportive care.5,10-16
Tisagenlecleucel is one of several CAR-T therapies that have altered the treatment landscape for r/r DLBCL. Tisagenlecleucel binds to the CD19 antigen on the surface of normal and cancerous B cells to eliminate them after infusion into the patient.17-20 In 2018, the US Food and Drug Administration approved tisagenlecleucel for adults with r/r DLBCL after ≥2 lines of treatment, based on the efficacy shown in the phase 2 single-arm JULIET study (Study of Efficacy and Safety of CTL019 in Adult DLBCL Patients; #NCT02445248). In JULIET, the overall response rate (ORR) among patients receiving tisagenlecleucel was 52%, with a complete response (CR) rate of 41%. In comparison, a pooled analysis of several large studies of salvage chemotherapy in r/r DLBCL (SCHOLAR-1 [Retrospective Non-Hodgkin Lymphoma Research]) reported an ORR of 26%, with just 7% of patients achieving CR.5 Thus, tisagenlecleucel provides a new therapeutic option and improved response for patients faced with historically dismal clinical outcomes.4,5,16,17,21-23
In the absence of head-to-head trials comparing tisagenlecleucel with historical treatments for r/r DLBCL, an indirect treatment comparison using individual patient data from the JULIET and CORAL (Collaborative Trial in Relapsed Aggressive Lymphoma) studies was conducted. CORAL was a phase 3 clinical study of 2L therapy that randomly assigned adults with relapsed DLBCL to 1 of 2 chemotherapy regimens followed by autoHCT when feasible (#NCT00137995).22 The CORAL investigators collected extensive follow-up data regarding patients’ subsequent treatments (ie, third line and above [3L+]) and long-term survival status, which represent the efficacy of conventional 3L+ treatments (ie, historical control treatments).
The current study indirectly compared the overall survival (OS) and ORR associated with tisagenlecleucel and historical control treatments as 3L+ therapies for adults with r/r DLBCL. To assess the efficacy of tisagenlecleucel vs historical control treatments among both prescribed and treated patients, the enrolled intention-to-treat (ITT) populations and patients who ultimately received treatment (ie, the full analysis set [FAS]) were compared separately.
Methods
Data source
This study used patient-level data from the JULIET (data-cut, February 20, 2020; data on file, Novartis)17 and CORAL studies.22,24 JULIET enrolled 167 patients (ie, ITT population); of these, 115 were infused with tisagenlecleucel (ie, FAS).17 CORAL enrolled 477 patients with r/r DLBCL (July 2003-June 2008) who received 2L treatment.22,24 Among them, 297 relapsed or failed to respond to 2L treatment,9,21 and they constituted the CORAL follow-up population for this indirect comparison. The patient-level data from CORAL were obtained from the Lymphoma Academic Research Organisation (LYSARC).25
Sample selection and study populations
To assess treatment effects in the treated (FAS) and the enrolled (ITT) study populations, separate analyses were conducted comparing the following: (1) the JULIET FAS vs the CORAL follow-up FAS; and (2) the JULIET ITT population vs the CORAL follow-up ITT population. To construct comparable patient populations, patients from the CORAL follow-up population were selected based on the inclusion/exclusion criteria of JULIET (Figure 1).
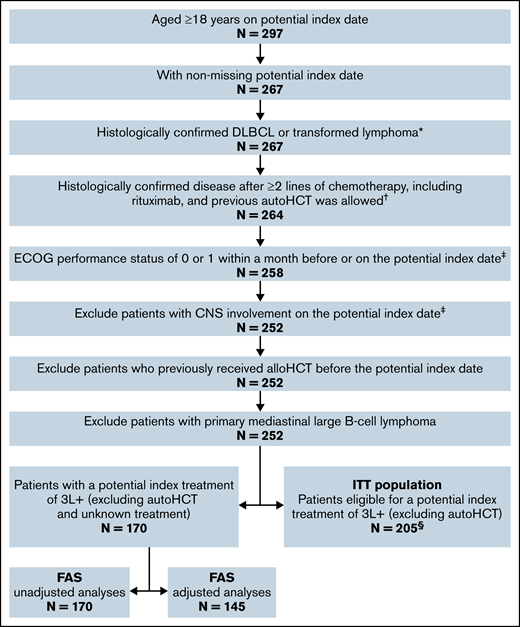
Sample selection for the CORAL follow-up FAS and ITT populations. *All patients in CORAL follow-up were assumed to have histologically confirmed DLBCL or transformed lymphoma based on the CORAL studies.9,21 †CORAL patients were randomly assigned to receive rituximab-based 2L treatment, although 3 patients did not ultimately receive rituximab in 2L and were excluded in this step. ‡A large proportion of patients in CORAL follow-up did not have an Eastern Cooperative Oncology Group (ECOG) or central nervous system (CNS) assessment; those with a missing/unknown ECOG status or CNS assessment were included in the analyses to preserve the sample size. §The ITT population had N = 205 in both the adjusted and unadjusted analyses.
FAS populations.
The JULIET FAS (N = 114) included all patients who received tisagenlecleucel in JULIET (N = 115), after excluding 1 patient with neuroendocrine tumor who was initially misclassified as DLBCL. The CORAL follow-up FAS (N = 170) included patients from the CORAL follow-up period selected per JULIET criteria (Figure 1). In addition, patients were required to have received one of the following therapies in 3L+ as an index treatment: any chemotherapy, immunotherapy (rituximab/lenalidomide/ofatumumab)-based treatment, brentuximab vedotin, ibrutinib, axicabtagene ciloleucel (axi-cel), polatuzumab vedotin, allogeneic hematopoietic cell transplant (alloHCT), or best supportive care. Unknown treatment and autoHCT were not considered qualified index treatments as JULIET enrolled patients who had failed, were ineligible for, or did not consent to autoHCT.
ITT populations.
The JULIET ITT population (N = 166) included all patients who enrolled in JULIET regardless of whether they received tisagenlecleucel infusion. The CORAL follow-up ITT population (N = 205) included the CORAL FAS and patients without a documented 3L+ treatment. autoHCT was not considered a qualified index treatment of the CORAL follow-up ITT.
Study endpoints
OS.
For the FAS populations, OS was defined as the time from the date of tisagenlecleucel infusion (for JULIET) or from the date of index treatment initiation (for the CORAL follow-up) to the date of death due to any reason. For the ITT populations, OS was defined as the time from the date of enrollment (JULIET) or from the selected index date (CORAL follow-up) to the date of death due to any reason. The index date for CORAL follow-up ITT was defined as the date of the selected index treatment initiation, if known, or the date of relapse from last line if the initiation date of the index treatment was missing.
ORR.
The ORR was defined as the proportion of patients with a best overall disease response of CR or partial response. In JULIET, response was evaluated by a central independent review committee using the 2014 Lugano Classification,26 in which CR did not include unconfirmed CR. In CORAL, response was measured by an investigator using the 1999 International Working Group (IWG) response criteria,27 in which unconfirmed CR was included under CR. Responses for the JULIET patients were assessed among the JULIET main cohort only; that is, patients treated or intended to receive tisagenlecleucel from the US manufacturing facility (FAS, N = 98; ITT, N = 146), per the JULIET study protocol. For both studies, patients with unknown response or without an index treatment were considered nonresponders.
Primary analyses
Unadjusted analysis for OS and ORR.
The number of prior lines was identified as a prognostic factor that was important to balance across groups (supplemental Table 1). Thus, for CORAL follow-up patients with multiple treatments that qualified as potential index treatments, the index treatment line that was more common in JULIET was selected as the index treatment in CORAL follow-up. Not all patients in the CORAL follow-up ITT population received a qualified index treatment; in cases of missing index treatments, the selection was performed on potential index dates. When the selected index treatment initiation date was unknown, the date of last treatment failure was used as the index date.
After the selection of index treatments/date, the median OS with corresponding 95% confidence interval (CI) and unadjusted hazard ratios (HRs) with corresponding 95% CIs, comparing tisagenlecleucel vs historical control treatments, were reported. Kaplan-Meier curves of OS were generated. The ORR was compared as the difference in response rate between tisagenlecleucel and historical control treatments, with 95% CIs estimated.
Adjusted analysis for OS and ORR.
The selection of the index treatment of CORAL follow-up patients with multiple index-qualifying treatments was conducted similarly to the unadjusted analyses. A generalized linear model with logit link was used to estimate the propensity score per-patient per-line to be enrolled/treated in JULIET based on the confounders. The therapy line with the highest propensity score was selected as the index treatment.
After the selection of the index treatment/date, propensity score weighting based on both standardized mortality ratio weight (SMRW) and fine stratification weight (FSW) was used to minimize confounding and obtain an unbiased HR. The bootstrapping approach was used to estimate the 95% CI for HRs. Kaplan-Meier curves were generated for OS after propensity score weighting.
Potential confounders for the adjusted analyses were identified based on a systematic literature search (data on file, Novartis) and ranked by clinical experts as “not important,” “less important,” or “very important” (supplemental Table 1). Only confounders deemed as less important or very important with ≥80% nonmissing values for both JULIET and CORAL follow-up patients were used in the adjusted analyses. Patients with missing values for the selected confounders were excluded from the adjusted analyses.
Comparison of baseline characteristics.
Continuous baseline characteristics were summarized by using mean, standard deviation, and median. Binary and categorical baseline characteristics were summarized by count and proportion. In the unadjusted analyses, statistical comparisons were performed between tisagenlecleucel vs historical control treatments by using Student t tests for means, Wilcoxon rank sum tests for medians, and χ2 tests for categorical variables (unless the frequency was <5, and then Fisher’s exact tests were used). In the adjusted analyses, standardized mean differences were estimated comparing tisagenlecleucel and historical control treatments using SMRW and FSW.
Sensitivity analyses
Three sensitivity analyses were performed to assess the robustness of the results. In sensitivity analysis I, the first available index treatment/date was selected for CORAL follow-up patients with multiple qualifying index treatments/dates. In sensitivity analysis II, all relevant confounders considered "very important" or "less important" were used in the adjusted analyses regardless of the missing data percentage. In sensitivity analysis III, CORAL follow-up patients were required to have received first-line rituximab.
Software
All analyses were conducted by using SAS 9.4 software (SAS Institute Inc., Cary, NC) and R software version 3.6.3 (R Foundation for Statistical Computing, Vienna, Austria). Statistical significance was considered at a level of .05 (α = 0.05).
Results
JULIET FAS vs CORAL follow-up FAS
Sample selection and study populations.
For the unadjusted analyses, the JULIET FAS (N = 114) comprised all patients who received tisagenlecleucel infusion. In the CORAL follow-up FAS, 170 of 297 patients who had failed 2L treatment met the sample selection criteria and had a qualified index treatment in 3L+ (Figure 1).
The adjusted analyses adjusted for age at initial diagnosis, Ann Arbor disease stage, extranodal site involvement, status of disease (ie, relapsed after last line, refractory to all lines, refractory to last line but not all lines), time to 2L start after diagnosis, prior hematopoietic cell transplant (HCT), and number of relapses. Due to missing data on selected confounders, 145 patients were included in the CORAL follow-up FAS for comparison with 111 patients in the JULIET FAS for the adjusted analyses.
Index treatment.
In the unadjusted and adjusted analyses, the most common index treatment line in both the JULIET FAS and the CORAL follow-up FAS was 3L (unadjusted, 43.9% and 80.6%, respectively; adjusted, 45.0% and 81.4%), followed by fourth line (4L) (unadjusted, 31.6% and 12.9%; adjusted, 30.6% and 13.1%) (supplemental Table 2). The proportion of patients with 3L was much higher in CORAL follow-up FAS than in JULIET FAS. The most common index treatment among the CORAL follow-up FAS was chemotherapy in the unadjusted and adjusted analyses (88.8% and 93.8%), followed by immunotherapy (28.8% and 30.3%), alloHCT (11.2% and 11.0%), and best supportive care (4.1% in both) (Table 1). All patients in the JULIET FAS received tisagenlecleucel infusion as the index treatment.
Index treatment selected for the CORAL follow-up population
| Index treatment of CORAL follow-up FAS* | Unadjusted analyses | Adjusted analyses |
|---|---|---|
| CORAL follow-up (N = 170) | CORAL follow-up (N = 145) | |
| Any chemotherapy (monotherapy or combination) | 151 (88.82%) | 136 (93.79%) |
| Immunotherapy | 49 (28.82%) | 44 (30.34%) |
| Rituximab-based treatment | 48 (28.24%) | 43 (29.66%) |
| Ofatumumab-based treatment | 1 (0.59%) | 1 (0.69%) |
| Lenalidomide-based treatment | 1 (0.59%) | 1 (0.69%) |
| alloHCT | 19 (11.18%) | 16 (11.03%) |
| Best supportive care | 7 (4.12%) | 6 (4.14%) |
| Index treatment of CORAL follow-up ITT* | Unadjusted analyses | Adjusted analyses |
|---|---|---|
| CORAL follow-up (N = 205) | CORAL follow-up (N = 205) | |
| Without documented 3L+ index treatments | 21 (10.24%) | 21 (10.24%) |
| With documented 3L+ treatments | ||
| Any chemotherapy (monotherapy or combination) | 140 (76.09%) | 143 (77.72%) |
| Immunotherapy | 45 (24.46%) | 45 (24.46%) |
| Rituximab-based treatment | 44 (23.91%) | 44 (23.91%) |
| Ofatumumab-based treatment | 1 (0.54%) | 1 (0.54%) |
| Lenalidomide-based treatment | 1 (0.54%) | 1 (0.54%) |
| alloHCT | 19 (10.33%) | 19 (10.33%) |
| Best supportive care | 7 (3.80%) | 6 (3.26%) |
Some patients received >1 treatment in the same line of therapy; therefore, the categories are not mutually exclusive. Brentuximab vedotin, ibrutinib, axi-cel, and polatuzumab vedotin were also considered as potential index treatments; however, no patients received these therapies.
Baseline characteristics.
The unadjusted baseline characteristics for the JULIET FAS and CORAL follow-up FAS are presented in Table 2. Most baseline characteristics were balanced between groups.
Patient characteristics for the JULIET FAS and CORAL follow-up FAS, unadjusted analyses
| Characteristic | JULIET (N = 114) | CORAL Follow-up (N = 170) | P |
|---|---|---|---|
| Confounders | |||
| Age at initial diagnosis | .119 | ||
| ≤60 y | 82 (71.9%) | 137 (80.6%) | |
| >60 y | 32 (28.1%) | 33 (19.4%) | |
| Mean ± SD, y | 51.1 ± 12.9 | 50.1 ± 11.2 | .527 |
| Ann Arbor disease stage | .161 | ||
| I or II | 26 (22.8%) | 45 (31.5%) | |
| III or IV | 88 (77.2%) | 98 (68.5%) | |
| Extranodal site involvement | .001* | ||
| 0-1 | 64 (56.1%) | 111 (76.6%) | |
| ≥2 extranodal organs | 50 (43.9%) | 34 (23.4%) | |
| Status of disease | .359 | ||
| Relapsed after last line | 51 (44.7%) | 89 (52.4%) | |
| Refractory to all lines | 22 (19.3%) | 24 (14.1%) | |
| Refractory to last line but not to all lines | 41 (36.0%) | 57 (33.5%) | |
| Time to 2L start after diagnosis | .417 | ||
| <12 mo | 62 (55.9%) | 82 (48.2%) | |
| ≥12 and ≤24 mo | 27 (24.3%) | 45 (26.5%) | |
| >24 mo | 22 (19.8%) | 43 (25.3%) | |
| Serum LDH level | .411 | ||
| Normal (LDH ≤ULN) | 46 (40.4%) | 48 (34.5%) | |
| Elevated (LDH >ULN) | 68 (59.6%) | 91 (65.5%) | |
| ECOG performance status | — | ||
| 0-1 | 114 (100.0%) | 33 (100.0%) | |
| Prior HCT† | .678 | ||
| Yes | 56 (49.1%) | 78 (45.9%) | |
| No | 58 (50.9%) | 92 (54.1%) | |
| No. of relapses excluding refractory‡ | |||
| Mean ± SD | 1.4 ± 1.0 | 1.5 ± 0.9 | .703 |
| Median (minimum, maximum) | 1.0 (0.0, 4.0) | 2.0 (0.0, 5.0) | .583 |
| Other baseline variables | |||
| Age | |||
| Mean ± SD, y | 53.7 (13.1) | 53.0 (11.3) | .629 |
| Sex | .659 | ||
| Female | 44 (38.6%) | 60 (35.3%) | |
| Male | 70 (61.4%) | 110 (64.7%) | |
| Ann Arbor disease stage at diagnosis | .106 | ||
| I or II | 33 (30.3%) | 69 (40.6%) | |
| III or IV | 76 (69.7%) | 101 (59.4%) | |
| IPI§ | .012 | ||
| <2 risk factors | 30 (26.3%) | 14 (12.3%) | |
| ≥2 risk factors | 84 (73.7%) | 100 (87.7%) | |
| No. of prior lines of therapies | |||
| Mean ± SD | 2.8 ± 1.0 | 2.3 ± 0.7 | <.001* |
| Median (minimum, maximum) | 3.0 (1.0, 6.0) | 2.0 (2.0, 6.0) | <.001* |
Unless otherwise indicated, numbers and percentages were only summarized among non-missing observations. –, p not calculated; ECOG, Eastern Cooperative Oncology Group; IPI, International Prognostic Index; LDH, lactate dehydrogenase; SD, standard deviation; ULN, upper limit of normal.
P < .05.
Prior HCT only included prior autoHCT because records with prior alloHCT were excluded.
The number of relapses was defined as the total number of lines before the index treatment where patient had a CR or partial response and relapsed later.
The IPI includes the following risk factors: age >60 years, elevated LDH, stage III or IV disease, ECOG performance status ≥2, and ≥2 extranodal sites.
The propensity score–weighted baseline characteristics for the JULIET FAS and CORAL follow-up FAS are presented in supplemental Table 3. The JULIET FAS and CORAL follow-up FAS were well balanced across variables used to estimate the propensity score in both the FSW and SMRW approaches, reflected by all standardized mean differences <0.1. For the variables not included in the propensity score adjustment, few residual differences remained.
Comparison of efficacy.
OS.
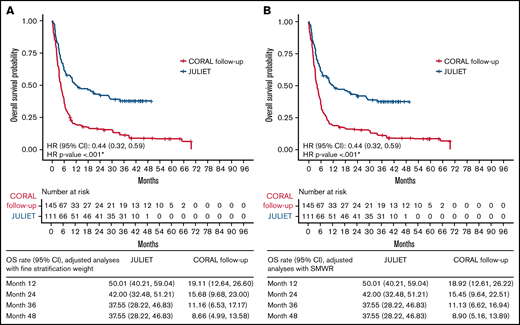
Tisagenlecleucel was associated with a significantly lower hazard of death, by 46% in the unadjusted analyses (HR [95% CI], 0.54 [0.41, 0.73]) and 56% in the adjusted analyses, with either FSW or SMRW (both HR [95% CI], 0.44 [0.32, 0.59]; all, P < .001) compared with historical control treatment (Table 3). The adjusted OS rate at 12 months was 50% for the JULIET FAS vs 19% for the CORAL follow-up FAS; at 48 months, the adjusted OS rates were 38% and 9%, respectively, regardless of adjustment approach (Figure 2).
Comparison of OS and ORR for the JULIET FAS vs CORAL follow-up FAS
| Method | N | Median (95% CI) OS, mo | HR (JULIET vs CORAL follow-up) | |||
|---|---|---|---|---|---|---|
| JULIET | CORAL follow-up | JULIET | CORAL follow-up | Estimate (95% CI) | P | |
| Unadjusted analyses | 114 | 170 | 11.07 (6.64, 23.85) | 5.36 (4.34, 6.37) | 0.54 (0.41, 0.73) | <.001* |
| Adjusted analyses† | ||||||
| FSW | 111 | 145 | 12.48 (6.64, 28.68) | 4.40 (3.48, 5.45) | 0.44 (0.32, 0.59) | <.001* |
| SMRW | 111 | 145 | 12.48 (6.64, 28.68) | 4.34 (3.48, 5.39) | 0.44 (0.32, 0.59) | <.001* |
| N | ORR (%) | Response rate difference (JULIET main cohort vs CORAL follow-up) | ||||
|---|---|---|---|---|---|---|
| JULIET main cohort | CORAL follow-up | JULIET main cohort | CORAL follow-up | Estimate (95% CI) | P | |
| Unadjusted analyses | 98 | 170 | 55% | 31% | 0.25 (0.12, 0.37) | <.001* |
| Adjusted analyses† | ||||||
| FSW | 95 | 145 | 57% | 21% | 0.36 (0.22, 0.48) | <.001* |
| SMRW | 95 | 145 | 57% | 21% | 0.36 (0.23, 0.48) | <.001* |
P < .05.
Age at initial diagnosis, Ann Arbor disease stage, extranodal site involvement, status of disease, time to 2L start after diagnosis, prior HCT, and number of relapses were included in the adjusted analyses.
ORR.
Tisagenlecleucel was associated with a significantly higher ORR, with a response rate of 55% compared with 31% for historical control treatment (difference, 25% [95% CI, 12%, 37%]) in the unadjusted analyses (Table 3). In the adjusted analyses, using either FSW or SMRW, tisagenlecleucel had a significantly higher ORR, with a response rate of 57% vs 21% for historical control treatment (difference, 36% [95% CI: FSW, 22%, 48%; SMRW, 23%, 48%]; all, P < .001).
Sensitivity analyses.
The findings from the 3 sensitivity analyses were consistent with the results of the primary analysis. Tisagenlecleucel was associated with significantly lower hazards of death than historical control treatment, using both FSW and SMRW, in each case (supplemental Table 4).
JULIET ITT vs CORAL follow-up ITT populations
Sample selection and study populations.
For the unadjusted analyses, 205 of 297 patients who failed 2L treatment in CORAL met the selection criteria for the CORAL follow-up ITT population (Figure 1). The JULIET ITT population included all patients enrolled in JULIET (N = 166).
For the adjusted analyses, confounders with <20% of missing data, including age at initial diagnosis, status of disease, time to 2L start after diagnosis, prior HCT, and number of relapses, were considered. Due to missing data for selected confounders, 205 patients in the CORAL follow-up ITT were compared with 163 patients in the JULIET ITT in the adjusted analyses (Figure 1).
Index treatment.
For the unadjusted and adjusted analyses, the most common index treatment line in both the JULIET ITT and CORAL follow-up ITT populations was 3L (unadjusted, 43.4% and 76.6%, respectively; adjusted, 44.2% and 77.6%), followed by 4L (unadjusted, 31.3% and 15.6%; adjusted: 30.7% and 16.1%) (supplemental Table 2). The proportion of patients with 3L was much higher in CORAL follow-up ITT than in JULIET ITT. In the CORAL follow-up ITT population, 10.2% had no index treatment (Table 1). Among patients in the CORAL follow-up ITT population with documented 3L+ treatments, the majority received chemotherapy monotherapy or combination therapy as the index treatment (adjusted, 76.1%; unadjusted, 77.7%). In the JULIET ITT population, 31.3% (52 of 166) and 31.9% (52 of 163) did not receive tisagenlecleucel infusion as the index treatment in the unadjusted and adjusted analyses.
Baseline characteristics.
Some significant differences were observed between the unadjusted baseline characteristics of the JULIET ITT and CORAL follow-up ITT populations (Table 4).
Patient characteristics for the JULIET ITT and CORAL follow-up ITT populations, unadjusted analyses
| Characteristic | JULIET (N = 166) | CORAL follow-up (N = 205) | P |
|---|---|---|---|
| Confounders | |||
| Age at initial diagnosis | .001* | ||
| ≤60 y | 107 (64.5%) | 166 (81.0%) | |
| >60 y | 59 (35.5%) | 39 (19.0%) | |
| Mean ± SD, y | 53.3 ± 12.7 | 49.9 ± 11.4 | .007* |
| Ann Arbor disease stage | .028* | ||
| I or II | 35 (21.1%) | 49 (32.7%) | |
| III or IV | 131 (78.9%) | 101 (67.3%) | |
| Extranodal site involvement | <.001* | ||
| 0-1 | 94 (56.6%) | 116 (76.3%) | |
| ≥2 extranodal organs | 72 (43.4%) | 36 (23.7%) | |
| Status of disease | .318 | ||
| Relapsed after last line | 68 (41.0%) | 100 (48.8%) | |
| Refractory to all lines | 30 (18.1%) | 31 (15.1%) | |
| Refractory to last line but not to all lines | 68 (41.0%) | 74 (36.1%) | |
| Time to 2L start after diagnosis | .112 | ||
| <12 mo | 94 (57.7%) | 99 (48.3%) | |
| ≥12 and ≤24 mo | 41 (25.2%) | 54 (26.3%) | |
| >24 mo | 28 (17.2%) | 52 (25.4%) | |
| Serum LDH level | 1.000 | ||
| Normal (LDH ≤ ULN) | 59 (35.5%) | 50 (35.2%) | |
| Elevated (LDH > ULN) | 107 (64.5%) | 92 (64.8%) | |
| ECOG performance status | — | ||
| 0-1 | 166 (100.0%) | 31 (100.0%) | |
| Prior HCT† | .554 | ||
| Yes | 74 (44.6%) | 84 (41.0%) | |
| No | 92 (55.4%) | 121 (59.0%) | |
| No. of relapses excluding refractory‡ | |||
| Mean ± SD | 1.4 ± 0.9 | 1.4 ± 0.9 | .636 |
| Median (minimum, maximum) | 1.0 (0.0, 4.0) | 2.0 (0.0, 5.0) | .528 |
| Other baseline variables | |||
| Age, y | |||
| Mean ± SD, y | 55.8 ± 12.9 | 52.7 ± 11.5 | .016* |
| Sex | .965 | ||
| Female | 62 (37.3%) | 75 (36.6%) | |
| Male | 104 (62.7%) | 130 (63.4%) | |
| Ann Arbor disease stage at diagnosis | .033* | ||
| I or II | 42 (26.4%) | 77 (37.6%) | |
| III or IV | 117 (73.6%) | 128 (62.4%) | |
| IPI§ | .172 | ||
| <2 risk factors | 33 (19.9%) | 15 (12.9%) | |
| ≥2 risk factors | 133 (80.1%) | 101 (87.1%) | |
| No. of prior lines of therapies | |||
| Mean ± SD | 2.9 ± 1.2 | 2.3 ± 0.7 | <.001* |
| Median (minimum, maximum) | 3.0 (1.0, 8.0) | 2.0 (2.0, 6.0) | <.001* |
Unless otherwise indicated, numbers and percentages were only summarized among non-missing observations. –, p not calculated; ECOG, Eastern Cooperative Oncology Group; IPI, International Prognostic Index; LDH, lactate dehydrogenase; SD, standard deviation; ULN, upper limit of normal.
P < .05.
Prior HCT only included prior autoHCT because records with prior alloHCT were excluded.
The number of relapses was defined as the total number of lines before the index treatment in which the patient had a CR or partial response and relapsed later.
The IPI includes the following risk factors: age >60 years, elevated LDH, stage III or IV disease, ECOG performance status ≥2, and ≥2 extranodal sites.
The adjusted baseline characteristics for the JULIET ITT and CORAL follow-up ITT populations post–propensity score weighting are presented in supplemental Table 5. For variables included in the propensity score model, the weighted means were largely balanced after SMRW and FSW (the absolute values of the standardized mean difference were <0.1 or slightly >0.1). For variables not included in the model, some variables such as the proportion with ≥2 International Prognostic Index risk factors remained unbalanced.
Comparison of efficacy.
OS.
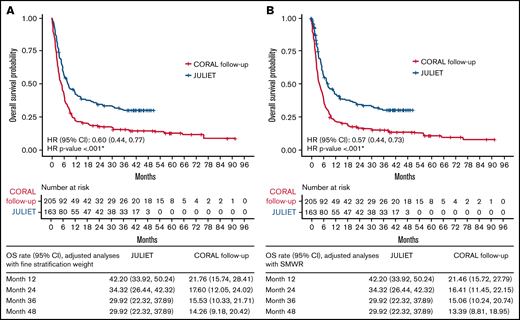
Compared with the analyzed historical control treatments, tisagenlecleucel was associated with a significantly lower hazard of death, by 35% (HR [95% CI], 0.65 [0.51, 0.83]) in the unadjusted comparison, and by 40% and 43% with FSW (HR [95% CI], 0.60 [0.44, 0.77]) and SMRW (HR [95% CI], 0.57 [0.44, 0.73]; all, P < .001) in the adjusted comparison, respectively (Table 5). Using FSW or SMRW, the OS rates at 12 and 48 months were 42% and 30% for the JULIET ITT population, respectively (Figure 3). The OS rates at 12 and 48 months for the CORAL follow-up ITT population were 22% and 14%, respectively, with FSW and 22% and 13% with SMRW.
Comparison of OS and ORR for the JULIET ITT vs CORAL follow-up ITT populations
| Method | N | Median (95% CI) OS, mo | HR (JULIET vs CORAL Follow up) | |||
|---|---|---|---|---|---|---|
| JULIET | CORAL follow-up | JULIET | CORAL follow-up | Estimate (95% CI) | P | |
| OS | ||||||
| Unadjusted analyses | 166 | 205 | 8.25 (5.82, 11.70) | 5.13 (3.88, 6.21) | 0.65 (0.51, 0.83) | <.001* |
| Adjusted analyses† | ||||||
| FSW | 163 | 205 | 8.25 (5.82, 12.42) | 4.86 (3.52, 6.08) | 0.60 (0.44, 0.77) | <.001* |
| SMRW | 163 | 205 | 8.25 (5.82, 12.42) | 4.04 (3.25, 5.75) | 0.57 (0.44, 0.73) | <.001* |
| Method | N | ORR, (%) | Response rate difference (JULIET Main Cohort vs CORAL Follow-up) | |||
|---|---|---|---|---|---|---|
| JULIET main cohort | CORAL follow-up | JULIET main cohort | CORAL follow-up | Estimate (95% CI) | P | |
| ORR | ||||||
| Unadjusted analyses | 146 | 205 | 37% | 30% | 0.07 (–0.03, 0.17) | .191 |
| Adjusted analyses† | ||||||
| FSW | 143 | 205 | 38% | 29% | 0.09 (–0.01, 0.20) | .097 |
| SMRW | 143 | 205 | 38% | 27% | 0.11 (0.00, 0.22) | .043* |
P < .05.
Age at initial diagnosis, status of disease, time to 2L start after diagnosis, prior HCT, and number of relapses were included in the adjusted analysis.
ORR.
The ORR was comparable between tisagenlecleucel (37%) and historical control (30%) treatments in the unadjusted analysis, with a response rate difference of 7% (95% CI, [–3%, 17%]; P = .191) (Table 5). However, tisagenlecleucel was associated with a significantly higher ORR (38%) compared with historical control treatment (27%) in the adjusted analyses with SMRW (difference of 11% [95% CI, 0%, 22%]; P = .043). In the adjusted analyses with FSW, the ORR associated with tisagenlecleucel (38%) was numerically but not significantly higher than that of historical control treatments (29%), with a difference of 9% (95% CI, −1%, 20%; P = .097).
Sensitivity analyses.
The findings from the 3 sensitivity analyses were consistent with the primary analysis results. After adjusting for confounders, tisagenlecleucel was associated with significantly lower hazards of death than historical control treatment, using both FSW and SMRW, in each case (supplemental Table 6).
Discussion
With tisagenlecleucel as a novel therapy for r/r DLBCL, it is valuable to understand its comparative effectiveness vs conventional therapies to guide patient access and treatment selection. In the absence of head-to-head trials, this study used patient-level data from JULIET and the CORAL follow-up period to indirectly compare the treatment effects of tisagenlecleucel and historical control treatments on OS and ORR. The results indicated that tisagenlecleucel as a 3L+ treatment was associated with a significantly lower hazard of death compared with historical control treatment, by 40% to 56%, in the adjusted main analyses of both the FAS and ITT populations. Furthermore, tisagenlecleucel was associated with a significantly higher ORR compared with historical control treatments among the FAS populations, with and without adjustment for differences in confounders (by 25% and 36%, respectively), as well as a significantly higher ORR after SMRW adjustment in the ITT population (by 11%).
The aforementioned findings were consistent across the 3 sensitivity analyses, attesting to their robustness. In sensitivity analysis I, the first qualified index treatment was selected for CORAL follow-up patients, with >90% of patients assigned 3L as the index treatment. This comparison was conservative against tisagenlecleucel given CORAL follow-up patients who would be assigned a 4L and above (4L+) index treatment may have been assigned a 3L index treatment, and OS would be longer among patients assigned 3L vs 4L+. Nevertheless, the results confirmed that tisagenlecleucel was associated with significant clinical benefits compared with historical control treatment. In sensitivity analysis II, which included all relevant confounders regardless of missing percentage, tisagenlecleucel was associated with a significantly longer OS compared with historical control treatment in both the FAS and ITT populations. In sensitivity analysis III, in which CORAL follow-up patients who received first-line rituximab were selected for a more conservative match to the JULIET FAS and ITT populations, the differences in OS between tisagenlecleucel and historical control treatment remained significant. An additional comparison was performed between CORAL follow-up patients and the 68 JULIET patients who were determined to be evaluable for efficacy by the US Food and Drug Administration. The results were very similar to what was observed in the main analysis when including the entire FAS population (supplemental Table 7).
To our knowledge, only one other study has compared a CAR-T cell therapy vs historical control treatment as 3L+ treatment of r/r DLBCL using patient-level data. Specifically, Neelapu et al28 compared the 2-year clinical outcomes with conventional chemotherapy vs with axi-cel using data from the SCHOLAR-1 and ZUMA-1 (Study Evaluating the Safety and Efficacy of KTE-C19 in Adult Participants With Refractory Aggressive Non-Hodgkin Lymphoma) studies, respectively, using propensity scoring to create similar patient populations. The study reported that axi-cel was associated with a higher ORR and CR rate vs conventional chemotherapy (ORR and CR, 83% and 54% in ZUMA-1 vs 34% and 12% in SCHOLAR-1, respectively). The 2-year OS was reported to be 54% in ZUMA-1 and 20% in SCHOLAR-1, with a 73% reduction in the hazard of death comparing axi-cel with conventional chemotherapy. Neelapu et al did not include tisagenlecleucel in the comparison.
There are very few tisagenlecleucel-focused studies with which to compare the current findings. In a European Medicines Agency (EMA) assessment report, a matching adjusted indirect comparison using individual patient-level data (with an earlier data-cut of JULIET vs the present data) and pooled aggregate CORAL follow-up data9,21 indirectly compared OS and ORR between tisagenlecleucel and historical control treatment. The EMA assessment reached similar conclusions as the current study; tisagenlecleucel was associated with a significantly longer OS compared with historical control treatments (HR [95% CI]: JULIET FAS, 0.41 [0.31, 0.54]; JULIET ITT, 0.53 [0.42, 0.68]). The current analyses validate the results of the EMA assessment using a more robust statistical approach and more complete and current data. The EMA assessment included patients who would not meet JULIET inclusion and exclusion criteria; conversely, the current study identified comparable CORAL follow-up patients based on JULIET criteria. In addition, the current study adjusted for more confounders deemed important by medical experts, enabling a more robust estimate of treatment effect. Specifically, the EMA study adjusted for sex, International Prognostic Index, autoHCT as the most recent therapy, and relapse after autoHCT; our study further adjusted for age at initial diagnosis, Ann Arbor disease stage, extranodal site involvement, status of disease, time to 2L start after diagnosis, prior HCT, and number of relapses. Finally, our study suggests a greater clinical benefit with respect to ORR (a difference of 36% in the FAS and 11% in the ITT population with SMRW adjustment) compared with the results of the EMA assessment (a difference of 12.2% and −5%, respectively). The larger difference in the current study could be due to the use of a more comparable patient population permitted by patient-level data from CORAL follow-up.
The current study compared the treatment efficacy of tisagenlecleucel vs historical control treatment in both the FAS and ITT populations. However, JULIET was conducted early in the clinical use of tisagenlecleucel; since that time, the manufacturing capacity, processes, and logistical management of tisagenlecleucel have been optimized in commercial real-world environments.29 These optimizations would enable that a higher proportion of eligible populations receive tisagenlecleucel earlier in the disease course, potentially increasing the benefit. Thus, the therapy effect among the ITT population observed in early clinical trials of CAR-T therapies may be underestimated. Future studies using real-world evidence of the efficacy of tisagenlecleucel and historical control treatments will be valuable to validate the current findings.
The findings of the current study should also be considered in light of several limitations. First, the distribution of index treatment lines was not exactly matched between groups, even after line selection, with JULIET patients being more heavily treated than CORAL follow-up patients. The majority of CORAL follow-up patients had 3L as the index line (>75%), in which the proportion was only 43% to 45% in JULIET (for both the FAS and ITT populations). The distribution of index lines did not change much for CORAL patients even with adjustment (supplemental Table 2); however, adjustment permitted a better balance on baseline characteristics between trials. In addition, the ITT population of the CORAL follow-up study included 35 patients who did not have a documented 3L treatment. Because the JULIET ITT population included patients who did not receive tisagenlecleucel and received other treatments, and outside a clinical trial, their treatments might also be undocumented, these 35 patients were included in the analyses.
Second, lymphoma management has evolved since the conduct of CORAL, which may explain why there were fewer later lines (4L+) observed in the CORAL follow-up patients and, as such, less opportunity for improvement on outcomes. A difference in the type of subsequent treatment was also observed. The most commonly used subsequent treatment was chemotherapy among the CORAL follow-up patients, whereas immunotherapies, biologic agents, and chemotherapies were commonly used in the JULIET populations. In addition, imaging techniques have evolved between the conduct of CORAL and JULIET; thus, the extranodal involvement variable may not be fully comparable between JULIET and CORAL follow-up.
Third, certain confounders, such as double/triple gene hits (MYC/BCL2/BCL6), MYC-IG rearrangement, and bulky disease were considered important but were unavailable in the CORAL follow-up data for adjustment (supplemental Table 1). Similarly, certain potentially important confounders such as serum lactate dehydrogenase level and Eastern Cooperative Oncology Group performance status could not be adjusted because missingness was >20% in the CORAL follow-up data.
Fourth, there were differing definitions of clinical response (CORAL used the 1999 IWG response criteria,27 whereas JULIET used the 2007 revised IWG response criteria30 ) and differing response assessment timing between trials; thus, comparisons of OS are more relevant than comparisons of response. Finally, information on progression-free survival was not available in the CORAL follow-up patient-level data, and therefore such comparisons were not feasible.
In summary, this study used patient-level data from JULIET and CORAL follow-up to indirectly compare OS and ORR associated with tisagenlecleucel and historical control treatments for r/r DLBCL after 2L+ of therapy. The benefit of tisagenlecleucel was confirmed by its significantly higher ORRs and significantly longer OS compared with historical control treatment among both the treated and ITT populations.
Acknowledgments
Shelley Batts, an employee of Analysis Group, Inc., provided drafts and editorial assistance to the authors during preparation of the manuscript. Support for this assistance was provided by Novartis, Inc.
Funding support for this article was provided by Novartis Pharmaceuticals.
Authorship
Contribution: All authors participated in designing and performing the research; analytic tools were contributed by H.Y., X.C., and C.Y.; data collection was performed by J.Z., E.S., M.J., M.M.-P., A.A., E.D., R.T.M., C.T., and G.S.; H.Y., X.C., and C.Y. performed the statistical analysis; and all authors analyzed and interpreted the data and wrote/reviewed the manuscript.
Conflict-of-interest disclosure: H.Y., X.C., and C.Y. are employees of Analysis Group, Inc., which has received consulting fees from Novartis Pharmaceuticals for the conduct of this research. J.Z., E.S., M.J., M.M.-P., A.A., and E.D. are employees of Novartis Pharmaceuticals and hold stock/options. C.T. reports honoraria from Janssen, Beigene, AbbVie, and Novartis; and research funding from Janssen, Beigene, and AbbVie. G.S. reports honoraria from Bayer, AbbVie, Epizyme, MorphoSys, and Regeneron; and is a consultant to AbbVie, Beigene, BMS/Celgene, Debiopharm, Epizyme, Genentech/Roche, Genmab, Incyte, Janssen, Kite/Gilead, Loxo, Miltenyi, MorphoSys, Novartis, Rapt, Regeneron, Takeda, VelosBio, and Allogene. R.T.M. is an advisor or consultant for AlloVir, Artiva, CRISPR Therapeutics, CytoDyn, Incyte, and Novartis; reports honoraria from Bristol Myers Squibb/Celgene, Incyte, Intellia, and Kite; research support from BMS, AlloVir, and Novartis; participation in a data and safety monitoring board for Athersys and Novartis; and holds a patent with Athersys.
Correspondence: Gilles Salles, Memorial Sloan-Kettering Cancer Center, 1275 York Avenue, New York, NY 10065; e-mail: sallesg@mskcc.org.

