

Key Points
This is the first reported randomized trial of immune checkpoint inhibitor therapy in older patients with AML.
Azacitidine combined with the PD-L1 inhibitor durvalumab was feasible but did not improve outcomes over azacitidine alone.

Abstract
Evidence suggests that combining immunotherapy with hypomethylating agents may enhance antitumor activity. This phase 2 study investigated the activity and safety of durvalumab, a programmed death-ligand 1 (PD-L1) inhibitor, combined with azacitidine for patients aged ≥65 years with acute myeloid leukemia (AML), including analyses to identify biomarkers of treatment response. Patients were randomized to first-line therapy with azacitidine 75 mg/m2 on days 1 through 7 with (Arm A, n = 64) or without (Arm B, n = 65) durvalumab 1500 mg on day 1 every 4 weeks. Overall response rate (complete response [CR] + CR with incomplete blood recovery) was similar in both arms (Arm A, 31.3%; Arm B, 35.4%), as were overall survival (Arm A, 13.0 months; Arm B, 14.4 months) and duration of response (Arm A, 24.6 weeks; Arm B, 51.7 weeks; P = .0765). No new safety signals emerged with combination treatment. The most frequently reported treatment-emergent adverse events were constipation (Arm A, 57.8%; Arm B, 53.2%) and thrombocytopenia (Arm A, 42.2%; Arm B, 45.2%). DNA methylation, mutational status, and PD-L1 expression were not associated with response to treatment. In this study, first-line combination therapy with durvalumab and azacitidine in older patients with AML was feasible but did not improve clinical efficacy compared with azacitidine alone. ClinicalTrials.gov: NCT02775903.
Introduction
Increased expression of inhibitory checkpoint molecules (programmed cell death protein 1 [PD-1], OX40, T-cell immunoglobulin, mucin domain-containing protein 3 [TIM-3], and lymphocyte-activation gene 3 [LAG3]) by effector T-cell subsets in the bone marrow (BM) has been reported in patients with acute myeloid leukemia (AML) vs healthy donors and is further enhanced in patients with multiple AML relapses.1 Programmed death-ligand 1 (PD-L1; CD274) expression on tumor blasts has also been reported to be elevated in patients with tumor protein p53 [TP53]-mutated AML.1 A recent analysis of RNA-sequencing and mutation data from The Cancer Genome Atlas database suggested that high coexpression of certain checkpoint molecules, such as PD-1/cytotoxic T-lymphocyte-associated protein 4 (CTLA-4) and PD-L2/CTLA-4, may be predictive of poor overall survival (OS) in AML.2
Epigenetic therapies, including azacitidine, may shift the tumor environment from immune evasion to immune recognition through multiple mechanisms such as reversal of epigenetic silencing/hypermethylation to elicit expression of tumor antigens,3-5 upregulation of antigen processing and presentation,6 increase in T-cell infiltration and chemokines,6-8 and induction of interferon response.6,9 Epigenetic therapies, however, also upregulate the expression of inhibitory checkpoint molecules such as PD-L1, which may lead to treatment resistance.10-12 Immune checkpoint (ICP) blockade, both as monotherapy and in combination with hypomethylating agents (HMAs), has shown clinical benefit in patients with relapsed or refractory AML, including following relapse after allogeneic stem cell transplantation.13-15
Durvalumab is a PD-L1-blocking antibody approved for the treatment of select patients with advanced lung cancers and is under investigation in numerous cancer types.16 Blockade of PD-L1 with durvalumab in combination with azacitidine may enhance T-cell-mediated antitumor activity and improve clinical outcomes in patients with AML.
We report the final results from FUSION-AML-001, the first randomized study to compare the efficacy and safety of first-line combination therapy with durvalumab and azacitidine vs azacitidine monotherapy in older patients with AML. Additionally, extensive exploratory biomarker analyses, including global DNA methylation, peripheral blood (PB) and BM immunophenotyping, mutation profiling, and RNA sequencing of genes of interest, were performed to identify biomarkers of response to combination therapy and infer the impact of treatment in the tumor microenvironment (TME).
Methods
Patients
Eligible patients were aged ≥65 years with centrally confirmed de novo AML (BM blasts ≥20%), or AML secondary to prior myelodysplastic syndrome (MDS) or exposure to potentially leukemogenic agents with the primary malignancy in remission ≥2 years. Patients were required to have centrally confirmed intermediate or poor risk status based on cytogenetics and Eastern Cooperative Oncology Group performance status 0 to 2. Patients with prior hematopoietic stem cell transplantation (HSCT) or who were eligible for HSCT were ineligible, as were those who had previously received any formulation of azacitidine or decitabine. Complete exclusion criteria are provided in the supplemental Methods.
Study design and treatments
FUSION-AML-001 (NCT02775903) was an open-label, international, randomized, phase 2 study (supplemental Figure 1). Patients were randomized 1:1 to combination therapy with azacitidine 75 mg/m2 subcutaneously days 1 through 7 and durvalumab 1500 mg by IV day 1 every 4 weeks (Q4W) (Arm A) or monotherapy with azacitidine 75 mg/m2 subcutaneously days 1 through 7 Q4W (Arm B) and stratified according to cytogenetic risk (intermediate vs poor). Treatment continued through 6 cycles, and if an overall response or other clinical benefit was obtained, continued until disease progression or unacceptable toxicity.
Dose modifications
The azacitidine dose could be modified as follows: nonhematologic toxicity: dose interruption, delay, or discontinuation, depending on toxicity grade; hematologic toxicity: dose delay followed by dose reduction if platelet count and absolute neutrophil count did not recover within 14 days; unexplained reductions in serum bicarbonate (<20 mmol/L), dose reduction by 50% on the next cycle; and unexplained elevations in serum creatinine or blood urea nitrogen ≥twofold above baseline values and above the upper limit of normal, with next cycle delayed until values returned to normal or baseline and dose reduction by 50% on the next treatment cycle.
With durvalumab, modifications to address immune-mediated adverse events (AEs) were based on toxicity grade per National Cancer Institute Common Terminology Criteria for Adverse Events (CTCAE) version 4.03. For grade 2 or 3 events, the dose was interrupted until toxicity resolved to grade ≤1. Durvalumab was discontinued permanently (1) for recurrence of a prior grade 3 treatment-related AE after resuming treatment, (2) for a grade 4 event or a grade 2 or 3 event with a high likelihood of morbidity/mortality, and (3) if the corticosteroid dose could not be reduced to ≤10 mg prednisone per day, or equivalent, within 12 weeks after the final dose. In the event that a participant assigned to the combination treatment arm discontinued treatment with durvalumab or subcutaneous azacitidine because of drug-related toxicity, treatment with single-agent durvalumab or subcutaneous azacitidine may have continued until any discontinuation criterion was met.
Disease status was centrally evaluated at the end of cycles 3 and 6 (before day 1 procedures of cycles 4 and 7) and at the end of every third treatment cycle thereafter. All patients were followed every 3 months until death, loss to follow-up, or withdrawal of consent to further follow-up for survival and subsequent AML-related therapies.
The study protocol was approved by each study site’s institutional review board/independent ethics committee before commencement (supplemental Table). The sponsor, its authorized representative, and investigators abided by Good Clinical Practice, as described in the International Council for Harmonisation guideline E6 and in accordance with the general ethical principles outlined in the Declaration of Helsinki. The study was conducted in accordance with applicable national, state, and local laws of the relevant regulatory authorities. All patients or their guardians provided informed consent.
Endpoints and assessments
Efficacy.
The primary endpoint was the overall response rate (ORR), defined as complete remission (CR) or CR with incomplete blood recovery (CRi) based on modified International Working Group (IWG) 2003 response criteria for AML.17 Key secondary endpoints were (1) time to response per IWG 2003 criteria, defined as the time from randomization to first documented response; (2) duration of response, defined as the time from response/improvement until relapse or disease progression (IWG 2003 criteria); (3) hematologic improvement (HI) rate, defined as HI-N (HI-neutrophil response) +HI-P (HI-platelet response) +HI-E (HI-erythroid response) (IWG 2003 criteria); (4) complete cytogenetic response, defined as the proportion of patients who achieved complete cytogenetic response (IWG 2003 criteria); (5) relapse-free survival, defined as the time from CR, partial remission, or marrow complete remission until first relapse, death from any cause, or loss to follow-up; (6) 1-year survival; and (7) OS, defined as the time from randomization to any-cause death.
Safety.
Safety was assessed using AEs, laboratory assessments, electrocardiogram, vital signs, and physical examination. These assessments were made at screening, at regular predetermined time points during treatment, at treatment discontinuation, and at days 28 (azacitidine) and 90 (durvalumab) of follow-up. AEs were graded according to the CTCAE version 4.03 criteria.
Pharmacokinetics (PKs).
Blood samples for PK assessment were collected at the end of infusion on day 1 of cycles 1 and 4 (considered peak concentrations) and preinfusion (90 to 5 minutes before dosing) on day 1 of cycles 2, 4, and 6 (considered as trough concentrations in the previous cycles). Serum durvalumab concentrations were measured using a validated electrochemiluminescence method.18 PK concentration data and summary statistics were tabulated.
Exploratory biomarker analysis
DNA methylation analyses.
DNA was extracted from PB samples collected at cycle 1 day 1 (C1D1) (pretreatment) and C2D1 (on-treatment). DNA was quantified with the PicoGreen DNA kit (LabCorp, Burlington, NC). The Infinium MethylationEPIC Array (Illumina, San Diego, CA) was used to determine the global DNA methylation score (GDMS) and focal DNA demethylation in PD-L1 and PD-L2 regulatory regions. β-values were calculated by taking the ratio of methyl-probe intensities to all probe intensities. GDMS was calculated by tabulating the percentage of highly methylated loci (β-value > 0.7), with a change in GDMS calculated by subtracting GDMS at C2D1 from GDMS at C1D1.
Immunophenotyping and immune checkpoint molecule expression.
PB collected at C1D1 (pretreatment), C1D8, C1D15, C2D1, and C2D15 was analyzed by Q2 Solutions (Morrisville, NC and Edinburgh, United Kingdom). Three separate panels of antibodies were used to measure the abundance of T-cell subsets. Changes in abundance were determined by measuring percent change at each time point to the mean at C1D1.
BM aspirates were collected at screening, C3D22 (cycle 3 day 22), and C6D22 (cycle 6 day 22). Processing and flow cytometry were performed at the Munich Leukemia Laboratory (https://www.mll.com/en.html). Flow cytometry antibodies were used to detect granulocytes, lymphocytes, monocytes, T cells, and tumor blasts that were gated on the basis of CD34 and CD117 variant expression. BM cells were also assessed for expression of surface PD-L1 (detected by using clone 29E.2A3), PD-1, and T-cell immunoglobulin and mucin domain-containing protein 3 (TIM-3). QuantiBRITE beads were used to measure protein expression, which was reported as molecules of equivalent soluble fluorochrome (MESF).
Mutation profiling.
The Munich Leukemia Laboratory used a next-generation targeted sequence assay to assess and characterize gene mutations of samples collected at screening. The 38 genes assessed included those frequently mutated in AML. The mean sequencing coverage across the panel and samples was approximately 3000x. Genetic alterations not matching the reference sequence were classified as mutated, wild-type (WT) (or common single nucleotide polymorphism [SNP]), or as a nondetrimental variant. Mutational load and coverage were assessed at each nonreference location.
RNA sequencing.
EA Genomics (Q2 Solutions) used the Qiagen Micro RNeasy kit (Hilden, Germany) to sequence RNA of BM aspirates collected at screening and at C3D22. RNA sequencing was performed on an Illumina HiSeq 2500, with 2 × 50 bp read lengths using TruSeq SBS v4 chemistry (Illumina). Strand-specific libraries were prepared by using polyA enrichment and included barcodes.
Alignment was performed using a 2-pass mode with STAR (v2.5.2b) on the full hg38 human genome, and gene-level counts were obtained using the quantmode GeneCounts option. Gene expression was then normalized with the function “voom” in the R package “limma.” Where gene expression is presented in box plots, boxes represent the mean and SEM, which were calculated using ggplot after the data were normalized with voom and log2 transformed.
Statistical analyses
Assuming a treatment effect of 100% relative improvement of CR and CRi (from 25% to 50% absolute CR and CRi rates), a sample size of 110 patients was needed to provide 80% power to detect such an effect at the 5% level of statistical significance. The primary analysis was conducted after all patients completed 6 cycles and had an assessment of their disease.
Study populations included the following: intent-to-treat (ITT) population, defined as all randomized patients; the efficacy evaluable (EE) population, which included patients in the ITT population who completed 6 treatment cycles unless they established an earlier response or discontinued the study due to death or disease progression; the safety population, defined as all patients who received at least 1 dose of any study treatment; and the PK population, defined as all patients who received at least 1 dose of study treatment and had at least 1 measurable durvalumab concentration.
Efficacy analyses were performed on the ITT population and supported by analyses conducted in the EE population. Continuous variables were summarized by descriptive statistics (n, mean, SD, Q1 and Q3, median, minimum [min], and maximum [max]). Early safety monitoring meetings were held after 12 patients completed 2 treatment cycles. Additional analyses were conducted approximately 12 months after the last patient was enrolled.
ORR was summarized together with a 2-sided 95% confidence interval (CI). Patients who discontinued before treatment cycle 6 without achieving an objective response were counted as nonresponders. The OS curve and OS at 6 and 12 months were estimated with the Kaplan-Meier method. Patients who were alive at the time of the clinical data cutoff date were censored at the earlier of last assessment at which the patient was known to be alive or the cutoff date. All patients lost to follow-up before the clinical data cutoff date were also censored at the time of last contact. Statistical analyses for the primary and secondary endpoints were conducted with SAS version 9.3 or higher.
Results
Patients and treatment
The study was conducted from 3 June 2016 to 31 October 2018 at clinical sites in Europe and the United States. A total of 129 patients were randomized, with 64 in Arm A and 65 in Arm B. As of the clinical data cutoff date, 18 patients (8 in Arm A, 10 in Arm B) continued to receive treatment, and 111 patients (56 in Arm A, 55 in Arm B) had discontinued. Baseline demographics and disease characteristics were generally balanced across arms. Approximately one-quarter had poor cytogenetic risk (Arm A, 25.0%; Arm B, 24.6%). Tumor mutations in TP53 were found in 33.0% of patients in Arm A and 26.0% in Arm B (Table 1). The median duration of follow-up was 15.7 months. Treatment exposure was similar in both arms. The median number of treatment cycles was 6.5 and 6.7 in Arms A and B, respectively, and more than half of patients completed ≥4 treatment cycles (supplemental Figure 2).
Baseline demographics and disease characteristics
| Parameter | Arm A azacitidine + durvalumab n = 64 | Arm B azacitidine n = 65 |
|---|---|---|
| Median age (range), y | 76.0 (65-89) | 75.0 (65-87) |
| Sex, M/F, n | 40/24 | 31/34 |
| ECOG status 0/1/2, % | 29.7/62.5/7.8 | 40.0/49.2/10.8 |
| Median hemoglobin, g/L | 88.5 | 93.0 |
| Median transfusion burden, units/28 d | 2.00 | 2.00 |
| Median platelet count, ×109/L | 55.5 | 42.0 |
| Low platelets (<100 000), % | 0 | 0 |
| Median ANC, ×109/L | 0.595 | 0.430 |
| Low ANC (<100), % | ||
| Band form | 0 | 0 |
| Segmented | 58 (91) | 55 (92) |
| Median time since diagnosis, months | 1.00 | 0.80 |
| Secondary AML, % | ||
| Yes | 42.2 | 41.5 |
| No | 56.3 | 56.9 |
| Cytogenetic risk category per NCCN guidelines, % | ||
| Intermediate | 39.1 | 40.0 |
| Poor | 25.0 | 24.6 |
| Missing | 35.9 | 35.4 |
| Median BM blasts, % | 34.00 | 32.00 |
| BM blast % category, %* | ||
| <20 | 3.1 | 6.2 |
| 20 to <30 | 37.5 | 35.4 |
| ≥30 | 57.8 | 58.5 |
| Main WHO classes, % | ||
| AML with MDS-related changes | 39.1 | 58.5 |
| AML not otherwise specified | 39.1 | 27.7 |
| TP53 mutation status, %† | ||
| WT | 67 | 74 |
| Mutated | 33 | 26 |
ANC, absolute neutrophil count; ECOG, Eastern Cooperative Oncology Group; F, female; IPSS-R, Revised International Prognostic Scoring System; M, male; WHO, World Health Organization.
Missing category not displayed.
n = 105.
Efficacy
No statistically significant difference in ORR was observed between treatment arms in the ITT population (Arm A, 31%; Arm B, 35%; P = .6180) (Table 2). Rates of morphologic CR and CRi were similar in both arms (CR: Arm A, 17%; Arm B, 22%; CRi: Arm A, 14%; Arm B, 14%). Partial remission (PR) was observed in 6 patients (4 [6%] in Arm A and 2 [3%] in Arm B). The single recipient of a subsequent allogeneic stem cell transplant (Arm B) achieved a CR. Among 43 responders, response was ongoing in 16 (37.2%) patients (supplemental Figure 3). Median duration of response was 24.6 weeks in Arm A and 51.7 weeks in Arm B (P = .0765). The median times to first response and best overall response were similar in both arms. Median OS was also similar, at 13.0 months in Arm A and 14.4 months in Arm B.
Treatment response, ITT population*
| Response | Arm A, azacitidine + durvalumab n = 64 n (%) [95% CI] | Arm B, azacitidine n = 65 n (%) [95% CI] |
|---|---|---|
| ORR (CR + CRi) | 20 (31.3) [19.89-42.61] | 23 (35.4) [23.76-47.01] |
| CR | 11 (17.2) [7.94-26.43] | 14 (21.5) [11.54-31.53] |
| CRi | 9 (14.1) [5.55-22.58] | 9 (13.8) [5.45-22.24] |
| PR | 4 (6.3) [0.32-12.18] | 2 (3.1) [0.0-7.28] |
| HI | 27 (42.2) [30.09-54.29] | 25 (38.5) [26.63-50.29] |
| SD | 23 (35.9) | 21 (32.3) |
Defined as all randomized patients.
In terms of cytogenetic response, both treatments resulted in a similar cytogenetic response. Among evaluable patients, a complete cytogenetic response was identified in 6 of 53 patients in Arm A (11.3%; 95% CI, 2.79-19.85) and 8 of 50 patients in Arm B (16.0%; 95% CI, 5.84-26.16). Blast reduction was reported in 34 of 43 (79%) patients in Arm A and 34 of 44 (77%) patients in Arm B. Maximal blast reduction for responders is shown in Figure 1.
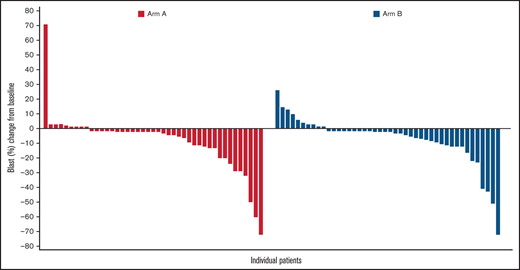
Maximal blast reduction from baseline for responders. The waterfall plot shows the percentage of blast reduction for all responders. Each responder’s blast percentage is illustrated as a bar along the x-axis. The y-axis shows the change from baseline in the percentage of blasts.
Maximal blast reduction from baseline for responders. The waterfall plot shows the percentage of blast reduction for all responders. Each responder’s blast percentage is illustrated as a bar along the x-axis. The y-axis shows the change from baseline in the percentage of blasts.
Safety
The overall incidence of AEs was similar in both arms of the study. All patients in Arm A and >98% in Arm B experienced at least 1 treatment-emergent AE (TEAE). In Arm A, AEs were treatment-related in 50 (78.1%) patients receiving durvalumab and 56 (87.5%) of those receiving azacitidine; in Arm B, AEs were treatment-related in 50 (80.6%) patients. The most frequently reported TEAEs were constipation (Arm A, 57.8%; Arm B, 53.2%) and thrombocytopenia (Arm A, 42.2%; Arm B, 45.2%) (supplemental Figure 4). Anemia occurred in 30% and 31% of patients in Arms A and B, respectively, and neutropenia in 36% and 34%. An AE ≥grade 3 was experienced by 96.9% of patients in Arm A and 88.7% in Arm B, with hematologic toxicities being the most frequently reported grade 3 or 4 TEAEs. Serious AEs (SAEs) were numerically more frequent in Arm A (87.5%) than in Arm B (71.0%); the most frequent SAEs occurring in ≥15% of patients were febrile neutropenia (Arm A, 35.9%; Arm B, 22.6%) and pneumonia (Arm A, 23.4%; Arm B, 12.9%).
Permanent treatment discontinuation due to AEs was reported in 11 (20%) patients in Arm A and 2 (4%) patients in Arm B, and 12 of 126 (9.5%) patients required azacitidine dose reduction due to AEs (Arm A, 10 patients; Arm B, 2 patients). The most common AEs related to discontinuation were pneumonitis and febrile neutropenia. A total of 18 immune-mediated AEs (imAEs) due to durvalumab were reported, including 5 cases of pneumonitis (1 grade 1; 3 grade 3, 1 grade 4), 2 cases of dermatitis (1 grade 2; 1 grade 3), and 1 case each of neuropathy, synovitis, TH1 and above peripheral sensory neuropathy (all grade 2), enteritis, arthritis, myocarditis, hepatitis, thyroiditis, bullous pemphigoid (all grade 3), colitis, and progressive multifocal leukoencephalopathy (both grade 4). imAEs occurred throughout treatment. Patients who experienced grade 3 and 4 imAEs discontinued durvalumab. One case of progressive multifocal leukoencephalopathy in Arm A was a potentially immune-mediated SAE that had not resolved at the time of treatment discontinuation; the patient subsequently died due to AML progression 6 months later.
There were 35 on-treatment deaths (24 [37.5%] in Arm A and 11 [17.7%] in Arm B), of which 20 were due to AEs (Arm A, 11 [17.2%]; Arm B, 9 [14.5%]). Deaths due to AML, pneumonia, and sepsis occurred more often in Arm A than in Arm B. In Arm A, deaths (all-cause) were due to AML (9 [14.1%]), pneumonia (3 [4.7%]), sepsis (2 [3.1%]), and cardiopulmonary failure, general physical health deterioration, respiratory tract infection, death, septic shock, lactic acidosis, cerebrovascular accident, ischemic stroke, dyspnea, and respiratory failure (1 patient each [1.6%]). In Arm B, deaths (all-cause) were due to AML (3 [4.8%]), and cardiac failure chronic, pneumonia, sepsis, septic shock, cerebral hemorrhage, cerebral infarction, acute kidney injury, and respiratory failure (1 patient each [1.6%]).
PK analyses
Geometric means (geometric coefficient of variation [CV] percentage) of peak durvalumab concentrations in cycles 1 and 4 in Arm A were 302 μg/mL (210%, n = 59) and 348 μg/mL (71%, n = 35), respectively. Geometric means (geometric CV percentage) of trough durvalumab concentrations in cycles 1, 3, and 5 were 46.0 μg/mL (75%, n = 51), 50.8 μg/mL (370%, n = 38), and 72.0 μg/mL (422%, n = 30), respectively.
Biomarker analyses
Global DNA methylation was assessed in PB samples following 1 cycle of treatment with or without durvalumab. Results showed a decrease of the GDMS in 50 of 55 (90.9%) patients with a negligible difference between Arms A and B (Figure 2). Mean GDMS in AML patients was reduced from 482 375 pretreatment to 463 645 after 1 cycle of azacitidine monotherapy.

Analysis of methylation patterns during treatment. The figure shows changes in GDMS in PB of patients with AML upon treatment with azacitidine + durvalumab or azacitidine.
Analysis of methylation patterns during treatment. The figure shows changes in GDMS in PB of patients with AML upon treatment with azacitidine + durvalumab or azacitidine.
Changes in surface PD-L1 expression on BM cells during treatment were evaluated by flow cytometry and presented in Figure 3. At baseline, mean PD-L1 surface expression in BM immune cells was highest in monocytes (Arm A, 1397 MESF; Arm B, 1514 MESF), followed in Arm A by tumor blasts (1003 MESF) and granulocytes (645 MESF) and in Arm B by granulocytes (776 MESF) and tumor blasts (585 MESF) (Figure 3A). In Arm A, PD-L1 expression on monocytes was noticeably increased at the end of treatment cycle 3 for matched patients, while changes in expression on granulocytes and tumor blasts were minimal (Figure 3B). In Arm B, PD-L1 expression was unchanged in monocytes, granulocytes, and myeloid blasts (Figure 3A,B). Changes in surface PD-L2 expression are shown in supplemental Figure 5. A trend toward lower PD-L2 surface expression on myeloid blasts was not observed after treatment of unmatched patients (supplemental Figure 5A) but was observed for matched patients in Arm B only (supplemental Figure 5B).
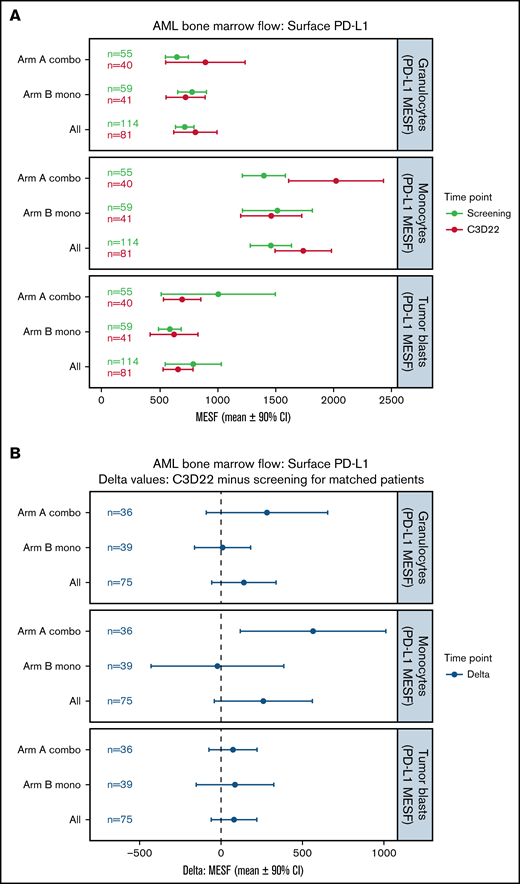
Changes in surface PD-L1 expression on BM cells during treatment. (A) This plot represents the mean (circles) and 90% CIs (error bars) for surface PD-L1 (CD274) abundance (MESF) at screening and C3D22 on 3 different cell types: granulocytes, monocytes, and tumor blasts. PD-L1 is notably higher at C3D22 compared with screening on monocytes for Arm A patients because the CIs are not overlapping. (B) This plot represents the mean (circles) and 90% CIs (error bars) of the C3D22 minus screening values for patients who had both time points measured. In this plot, we also observed that PD-L1 has an increased density on monocytes for Arm A patients because the CIs do not span the dashed line at zero. However, PD-L1 on tumor cells is not increased beyond the CI in either plot. Combo, combination therapy; Mono, monotherapy.
Changes in surface PD-L1 expression on BM cells during treatment. (A) This plot represents the mean (circles) and 90% CIs (error bars) for surface PD-L1 (CD274) abundance (MESF) at screening and C3D22 on 3 different cell types: granulocytes, monocytes, and tumor blasts. PD-L1 is notably higher at C3D22 compared with screening on monocytes for Arm A patients because the CIs are not overlapping. (B) This plot represents the mean (circles) and 90% CIs (error bars) of the C3D22 minus screening values for patients who had both time points measured. In this plot, we also observed that PD-L1 has an increased density on monocytes for Arm A patients because the CIs do not span the dashed line at zero. However, PD-L1 on tumor cells is not increased beyond the CI in either plot. Combo, combination therapy; Mono, monotherapy.
To evaluate for treatment-mediated changes in BM immune cells, flow cytometry analysis was carried out, and supplemental Figure 6 summarizes changes in abundance of lymphocytes, CD3-positive T cells, and tumor blasts. A reduction in tumor blasts was noted in both groups of unmatched (supplemental Figure 6A) and matched (supplemental Figure 6B) patients after treatment cycle 3, indicating a reduction in tumor burden. Because there was no difference between treatment arms, reduction in tumor cell burden was likely a response to azacitidine alone. There were no clinically meaningful differences between arms in lymphocytes and T cells (supplemental Figure 6A,B). Analysis of PB CD4-positive (supplemental Figure 7A) and CD8-positive (supplemental Figure 7B) T cells in Arms A and B showed no differences in abundance from baseline through cycle 2.
RNA sequencing analysis of BM mononuclear cells was used to identify changes in gene expression of immune-related genes. Results showed that expression of T-cell genes, PD-L1, and the interferon-γ (γ) signature (the mean of CD274, LAG3, IFNG, and CXCL9) was increased on treatment compared with baseline (Figure 4A), with similar increases in both arms. For example, in patients who provided both a screening and cycle 3 sample, CD3D increased by a mean of 2× in both arms. Many additional T-cell genes shared this pattern (supplemental Figure 8A). Other genes of interest are tumor marker CD34, which was consistently reduced on treatment, and PNMA Family Member 5 (PNMA5), a cancer-testis antigen that was highly upregulated in both arms (Figure 4A). Additionally, within both arms, the interferon-γ signature increased on treatment in paired samples as shown by a 90% CI >0 (Figure 4A). When patients were stratified by response, the increase was observed only in responders (Figure 4B, left and right panels), and the additional T-cell genes had similar patterns (supplemental Figure 8B).
![RNA-sequencing analyses. (A) Increase or decrease of gene expression from screening to C3D22, split by treatment arm. CD3D (T-cell gene), PDCD1 (PD-1), CD274 (PD-L1), interferon-γ signature (mean of 4 genes [CD274, LAG3, IFNG, CXCL9]), CD34 (gene expressed on tumor cells), and PNMA5 (cancer-testis antigen). The x-axis is the log2 of the fold change between C3D22 and screening for patients with samples at both time points. (B) Interferon-γ signature at screening and at C3D22 in responders vs nonresponders to treatment with azacitidine and durvalumab (Arm A) or azacitidine monotherapy (Arm B). The plot on the left shows the screening samples and C3D22 samples separately, with lines connecting those which are from the same patient. The y-axis is the expression score. The right plot shows the fold change for those patients with both time points. The y-axis is the log2 of the fold change between C3D22 and screening. For all plots in A and B, the line in the middle of the box is the mean, and the edges of the boxes are the 90% CIs.](https://ash.silverchair-cdn.com/ash/content_public/journal/bloodadvances/6/7/10.1182_bloodadvances.2021006138/6/m_advancesadv2021006138f4.png?Expires=1771000616&Signature=hIKyxzp4W3xxekgCzZpx-45ITlWAPnqpTX~USvHCQe5sW7lu1b1PoPCf82tqneJdCGBULPRdmTfRLqu-wrM1QIPX-r0AM6wQktrUHtEhTH3jjCMEkoikffmqFEbUHUCZUZBSY45aW4O0GnR3pbjp-5EE9UI-ghz8pvMRuAxLbWjMP7oz-THwWtUAg6Drqdt9XLlVAgop5Hy79vHU5dv-E8Eb1dzZHOyy9cqFAQquj9T52gJAudzC2qrZN-8aocqYIg2pWL2liO9O3d1-zYkcwVyTxESuMe1OFUDpObmIkBogVITXZFd1QGHVTrc47fGBHXYq1xuqmIK6HgO1x~qdVQ__&Key-Pair-Id=APKAIE5G5CRDK6RD3PGA)
RNA-sequencing analyses. (A) Increase or decrease of gene expression from screening to C3D22, split by treatment arm. CD3D (T-cell gene), PDCD1 (PD-1), CD274 (PD-L1), interferon-γ signature (mean of 4 genes [CD274, LAG3, IFNG, CXCL9]), CD34 (gene expressed on tumor cells), and PNMA5 (cancer-testis antigen). The x-axis is the log2 of the fold change between C3D22 and screening for patients with samples at both time points. (B) Interferon-γ signature at screening and at C3D22 in responders vs nonresponders to treatment with azacitidine and durvalumab (Arm A) or azacitidine monotherapy (Arm B). The plot on the left shows the screening samples and C3D22 samples separately, with lines connecting those which are from the same patient. The y-axis is the expression score. The right plot shows the fold change for those patients with both time points. The y-axis is the log2 of the fold change between C3D22 and screening. For all plots in A and B, the line in the middle of the box is the mean, and the edges of the boxes are the 90% CIs.
RNA-sequencing analyses. (A) Increase or decrease of gene expression from screening to C3D22, split by treatment arm. CD3D (T-cell gene), PDCD1 (PD-1), CD274 (PD-L1), interferon-γ signature (mean of 4 genes [CD274, LAG3, IFNG, CXCL9]), CD34 (gene expressed on tumor cells), and PNMA5 (cancer-testis antigen). The x-axis is the log2 of the fold change between C3D22 and screening for patients with samples at both time points. (B) Interferon-γ signature at screening and at C3D22 in responders vs nonresponders to treatment with azacitidine and durvalumab (Arm A) or azacitidine monotherapy (Arm B). The plot on the left shows the screening samples and C3D22 samples separately, with lines connecting those which are from the same patient. The y-axis is the expression score. The right plot shows the fold change for those patients with both time points. The y-axis is the log2 of the fold change between C3D22 and screening. For all plots in A and B, the line in the middle of the box is the mean, and the edges of the boxes are the 90% CIs.
In a mutational analysis of 38 genes using targeted deep sequencing, the probability of overall response in patients with a mutation in a gene was compared with the probability of response in patients with WT (or nondetrimental) variants of that gene. This revealed not only that mutations in TP53 were present in similar proportions of patients in Arms A and B (Figure 5A), but also that patients with TP53 mutations had an ORR (35% [80% CI, 25%-47%]) that was similar to those with WT TP53 (34% [80% CI: 27%-41%]) when patients of Arms A and B were grouped into 2 cohorts based on mutation status (Figure 5B). None of the other genes had a significant influence on ORR (Figure 5B). When patients with a mutated gene in Arm A were compared with those with mutations of that gene in Arm B, 1 gene, RUNX family transcription factor 1 (RUNX1), was associated with a significantly decreased probability of ORR, while the probability of ORR with neurofibromin 1 (NF1) mutations trended toward significance (supplemental Figure 9).
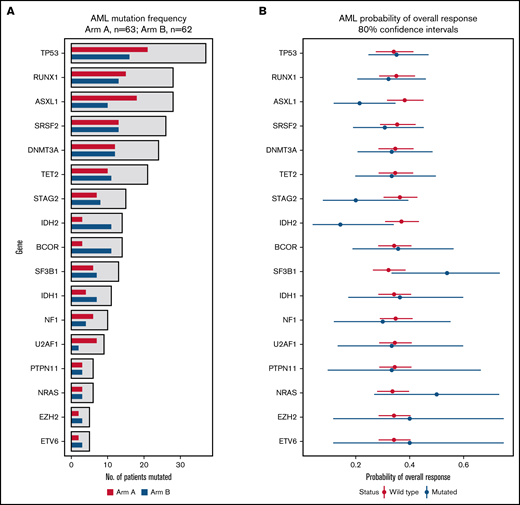
Effect of mutation status (WT vs mutated) on overall response. (A) The bar graph summarizes the mutation frequency for genes analyzed in this study. The x-axis presents the number of patients with a mutation, and the y-axis presents a bar for the genes of interest. Red bars, Arm A; blue bars, Arm B. (B) The graph summarizes probabilities of overall response among patients stratified by mutation status. The x-axis presents the odds ratio (circles) with 80% CIs (error bars) for overall response, and the y-axis presents the genes of interest. Red circles and error bars, WT gene status; blue circles and error bars, mutated gene status.
Effect of mutation status (WT vs mutated) on overall response. (A) The bar graph summarizes the mutation frequency for genes analyzed in this study. The x-axis presents the number of patients with a mutation, and the y-axis presents a bar for the genes of interest. Red bars, Arm A; blue bars, Arm B. (B) The graph summarizes probabilities of overall response among patients stratified by mutation status. The x-axis presents the odds ratio (circles) with 80% CIs (error bars) for overall response, and the y-axis presents the genes of interest. Red circles and error bars, WT gene status; blue circles and error bars, mutated gene status.
Discussion
Older patients with AML have very poor clinical outcomes with standard treatments. While azacitidine provides a benefit when compared with other chemotherapies, low survival rates and resistance to therapy remain ongoing challenges. We sought to determine if durvalumab-mediated blockade of PD-L1 could synergize with azacitidine to enhance antitumor activity and improve outcomes.
FUSION-AML-001 is the first randomized study to compare the efficacy and safety of the combination of durvalumab with azacitidine vs azacitidine alone as first-line treatment of patients with AML who were 65 years or older and to explore biomarkers of response to treatment. The results indicate that combination therapy was feasible and the safety profile of azacitidine plus durvalumab compared favorably to that of venetoclax plus azacitidine, decitabine, or low-dose cytarabine, which are combination therapies recently approved for older adults with newly diagnosed AML.19 The large number of patients with AML studied in this trial enabled the profile of imAEs with azacitidine and durvalumab to be determined. The imAEs observed in the combination treatment arm were expected when considering the safety profile of durvalumab, and all imAEs resolved after treatment.
In terms of efficacy, both overall antitumor response and survival were similar among patients who received durvalumab and azacitidine and those who received azacitidine alone. The addition of durvalumab did not result in a clinically meaningful improvement in ORR, HI, time to first or best response, duration of response, cytogenetic response, or any metrics of survival vs azacitidine monotherapy. Our results can be considered together with those of studies evaluating other combination treatments. In a single-arm trial of combination therapy with azacitidine and nivolumab in 70 patients with relapsed/refractory AML, the ORR was 33%, with 15 (22%) CR/CRis, 1 PR, and 1 HI maintained for >6 months.15 Median OS was 6.3 months. Pretreatment percentages of BM and PB CD3 and CD8 cells were significant predictors of response.15
Our extensive exploratory biomarker analysis has provided insight as to why no difference in efficacy was observed between treatment arms. First, combination treatment in older patients with AML promoted global hypomethylation and led to increased PD-L1 surface expression that was restricted to monocytes. These data suggest that differentiated cells in the TME might exert immune suppressive effects. Second, patients in both arms also had an increase in the percentage of lymphocytes, possibly due to improved BM function. Finally, the addition of durvalumab had no apparent effect on reversing T-cell exhaustion, based on a lack of increased PB and BM T-cell abundance. The RNA-sequencing analysis, which showed that T-cell genes, PD-L1, and the interferon-γ signature increased similarly in patients of both arms, was consistent with the observed increase in PD-L1 surface expression and BM immune changes during treatment. A phase 1b/2 study of azacitidine and avelumab in relapsed/refractory AML found that the combination was well tolerated and clinical activity was limited. BM blasts analyzed for immune-related markers by mass cytometry demonstrated significantly higher PD-L2 expression compared with PD-L1 both before and during therapy, with PD-L2 expression increasing on therapy, suggesting that high PD-L2 expression on BM blasts may be a mechanism of resistance to anti-PD-L1 therapy in AML. These results, together with the results from our study, indicate that anti-PD-L1 therapies are unlikely to be clinically beneficial in AML.20 A randomized phase 2 study to evaluate the efficacy of combining HMAs plus venetoclax with PD-1 blockade in the first-line setting for older patients with AML has been initiated (NCT04284787) and should provide additional information about the interaction of epigenetic therapies and the TME.21
In conclusion, first-line combination therapy with durvalumab and azacitidine was feasible in older patients with AML but did not provide response or survival advantages over azacitidine monotherapy. The absence of improved response was consistent with the lack of immune changes observed in the combination arm. Our findings are an important contribution to the field as they are derived from a controlled study that included in-depth analyses of tumor mutations, biomarkers, and immune cell populations. Thus, they provide high-level evidence that can be used to inform treatment decisions and maximize the benefits of ICP therapy for older patients with AML who were not eligible for HSCT. While anti-PD-L1 therapy may be of limited value in AML, other ICP blocking agents such as anti-PD-1, CTLA-4, CD47, TIM-3, and other novel agents may have a place in AML therapy based on promising early clinical data. Ongoing clinical trials with these and similar agents should clarify whether there is a role for immune checkpoint blockade in the management of AML.
Acknowledgments
The authors would like to thank the patients enrolled in the study and their families as well as associated clinical trial teams. The authors received editorial support in the preparation of this manuscript from Lauren Gallagher, RPh, PhD, of Peloton Advantage, LLC, an OPEN Health company (Parsippany, NJ) sponsored by Bristol Myers Squibb (Summit, NJ). The authors, however, directed and are fully responsible for all content and editorial decisions for this manuscript.
This trial (NCT02775903) was sponsored by Celgene, a Bristol Myers Squibb company, and supported by AstraZeneca/MedImmune.
Authorship
Contribution: I.B. contributed the translational plan to the study design; A.P. contributed to the study design; A.M.Z. and D.C.T. were study investigators; A.M.Z., D.C.T., A.H., M.T., M.T.V., J.C., and L.R.S. enrolled patients; A.M.Z., I.B., W.B.C., and B.A.F. collected and assembled data; I.B., C.L.B., W.B.C., V.E.H., E.T., B.A.F., A.P., and T.O. analyzed data; all authors interpreted data; B.F. and A.M.Z. prepared the manuscript; all authors reviewed and revised the manuscript; and all authors approved the final manuscript.
Conflict-of-interest disclosure: A.M.Z. is a Leukemia and Lymphoma Society Scholar in Clinical Research and was also supported by an NCI’s Cancer Clinical Investigator Team Leadership Award (CCITLA); received research funding (institutional) from Celgene/Bristol Myers Squibb, AbbVie, Astex, Pfizer, MedImmune/AstraZeneca, Boehringer Ingelheim, Trovagene/Cardiff Oncology, Incyte, Takeda, Novartis, Amgen, Aprea, and ADC Therapeutics; participated in advisory boards, and/or had a consultancy with and received honoraria from AbbVie, Otsuka, Pfizer, Celgene/BMS, Jazz, Incyte, Agios, Boehringer Ingelheim, Novartis, Acceleron, Astellas, Daiichi Sankyo, Cardinal Health, Taiho, Seattle Genetics, BeyondSpring, Trovagene/Cardiff Oncology, Takeda, Ionis, Amgen, Janssen, Epizyme, Syndax, Gilead, Kura, Aprea, Janssen, and Tyme; served on clinical trial committees for Novartis, AbbVie, Geron, Gilead, Kura, and Celgene/BMS; and received travel support for meetings from Pfizer, Novartis, and Cardiff Oncology. I.B., C.L.B., W.B.C., E.T., B.A.F., V.E.H., T.O., A.P., and S.R. are employees of Celgene, a Bristol Myers Squibb company, and may be shareholders. D.C.T. is supported by the National Institute for Health Research Royal Marsden/Institute of Cancer Research Biomedical Research Centre; research funding from Celgene. L.R.S. has received research funding from Celgene, Onconova Therapeutics, Forty-seven, Medimmune, and Takeda. M.T.V. received research funding from Celgene; speakers bureau for Celgene, Astellas, Jazz, and AbbVie. M.T. reports consultancy for Celgene, Astellas, Novartis; sponsored conferences and meetings with Celgene, Astellas, Amgen, Novartis, Pfizer, and Servier. All other authors report no competing financial interests.
Correspondence: Amer M. Zeidan, Department of Internal Medicine, Yale University and Yale Cancer Center, 37 College Street, First Floor, New Haven, CT 06510; e-mail: amer.zeidan@yale.edu.

