

Key Points
This is the first reported randomized trial of immune checkpoint inhibitor therapy in HR-MDS.
Azacitidine combined with the PD-L1 inhibitor durvalumab was feasible but did not improve outcomes over azacitidine alone.

Abstract
Azacitidine-mediated hypomethylation promotes tumor cell immune recognition but may increase the expression of inhibitory immune checkpoint molecules. We conducted the first randomized phase 2 study of azacitidine plus the immune checkpoint inhibitor durvalumab vs azacitidine monotherapy as first-line treatment for higher-risk myelodysplastic syndromes (HR-MDS). In all, 84 patients received 75 mg/m2 subcutaneous azacitidine (days 1-7 every 4 weeks) combined with 1500 mg intravenous durvalumab on day 1 every 4 weeks (Arm A) for at least 6 cycles or 75 mg/m² subcutaneous azacitidine alone (days 1-7 every 4 weeks) for at least 6 cycles (Arm B). After a median follow-up of 15.25 months, 8 patients in Arm A and 6 in Arm B remained on treatment. Patients in Arm A received a median of 7.9 treatment cycles and those in Arm B received a median of 7.0 treatment cycles with 73.7% and 65.9%, respectively, completing ≥4 cycles. The overall response rate (primary end point) was 61.9% in Arm A (26 of 42) and 47.6% in Arm B (20 of 42; P = .18), and median overall survival was 11.6 months (95% confidence interval, 9.5 months to not evaluable) vs 16.7 months (95% confidence interval, 9.8-23.5 months; P = .74). Durvalumab-related adverse events (AEs) were reported by 71.1% of patients; azacitidine-related AEs were reported by 82% (Arm A) and 81% (Arm B). Grade 3 or 4 hematologic AEs were reported in 89.5% (Arm A) vs 68.3% (Arm B) of patients. Patients with TP53 mutations tended to have a worse response than patients without these mutations. Azacitidine increased programmed cell death ligand 1 (PD-L1 [CD274]) surface expression on bone marrow granulocytes and monocytes, but not blasts, in both arms. In summary, combining azacitidine with durvalumab in patients with HR-MDS was feasible but with more toxicities and without significant improvement in clinical outcomes over azacitidine alone. This trial was registered at www.clinicaltrials.gov as #NCT02775903.
Introduction
Loss of antitumor immune surveillance through immune checkpoint (ICP) interactions is considered a key step in cancer development,1 including myelodysplastic syndromes (MDS).2-4 In MDS, immune dysregulation occurs through mechanisms including T-cell–mediated bone marrow (BM) suppression, cytokine expression, overactivation of pathways involved in innate immunity, and aberrant mesenchymal stromal cell activity.2 As these pathologic processes progress, cytopenias worsen and programmed cell death ligand 1 (PD-L1 [CD274]) is expressed on clonal cells, allowing immune escape and the potential for progression to acute myeloid leukemia (AML).2
Epigenetic therapies, including azacitidine, may shift the tumor microenvironment (TME) from immune evasion to immune recognition through mechanisms such as reversing epigenetic silencing or hypermethylation to elicit tumor antigen expression5-7 and activating diverse pathways involved in the immune response.8-11 In patients with MDS, including those treated with hypomethylating agents (HMAs), gene expression of ICP molecules (PD-L1, PD-L2, programmed cell death protein 1 [PD-1], and cytotoxic T-lymphocyte–associated protein 4 [CTLA4]) is abnormally upregulated in clonal cells and mesenchymal stromal cells in the TME.12-14 In addition, reduced methylation of the PD-1 promoter in T cells may lead to treatment resistance.12,14 As evidenced from chronic viral infection, increased expression of PD-1 leads to CD8+ T-cell exhaustion.15 In a phase 3 study comparing azacitidine with conventional care regimens in patients with higher-risk MDS (HR-MDS), azacitidine significantly prolonged median overall survival (OS), doubled 2-year OS, and lowered the risk of progression to AML. However, after 2 years, mortality was 50% among patients treated with azacitidine, highlighting the difficulty of achieving long-lasting remission with azacitidine monotherapy.16,17
Durvalumab is a PD-L1–blocking antibody being investigated in numerous cancer types and is approved for treatment of selected patients with advanced non–small cell and small cell lung cancers.18 PD-L1 expressed on malignant cells is the ligand for PD-1, which is expressed on T cells. By blocking interaction of PD-L1 and PD-1, durvalumab treatment promotes better T-cell antitumor responses. Blockade of PD-L1 with durvalumab in combination with azacitidine may synergistically enhance antitumor activity and improve clinical outcomes in patients with HR-MDS.
We report the final results from the first randomized trial of ICP blockade (ICB) in MDS. FUSION-AML-001 was a randomized phase 2 study comparing efficacy and safety of the combination of azacitidine and durvalumab vs azacitidine monotherapy as first-line treatment of patients with HR-MDS or AML. Results for the AML cohort are reported separately. In addition, epigenetic changes, immune profile changes, baseline mutations, and expression of genes of interest were analyzed to explore potential biomarkers of treatment response.
Methods
Patients
The study enrolled untreated patients age 18 years or older with centrally confirmed primary or secondary MDS (World Health Organization classification), intermediate-, high-, or very-high-risk disease per the Revised International Prognostic Scoring System (IPSS-R), and Eastern Cooperative Oncology Group performance status 0 to 2. A complete list of exclusion criteria is provided in the supplemental Methods.
Study design and treatments
FUSION-AML-001 (NCT02775903) was a randomized, open-label, international phase 2 study (Figure 1). After random assignment (1:1), patients received 75 mg/m2 subcutaneous azacitidine (days 1-7 every 4 weeks) combined with 1500 mg intravenous durvalumab on day 1 every 4 weeks for at least 6 cycles (Arm A) or 75 mg/m² subcutaneous azacitidine alone (days 1-7 every 4 weeks) for at least 6 cycles (Arm B).

Study design of the HR-MDS cohort in FUSION-AML-001. Randomization and treatment schedule for patients enrolled on the FUSION-AML-001 trial. IV, intravenous; Q4W, every 4 weeks; sc, subcutaneous; 3-monthly, once every 3 months.
Study design of the HR-MDS cohort in FUSION-AML-001. Randomization and treatment schedule for patients enrolled on the FUSION-AML-001 trial. IV, intravenous; Q4W, every 4 weeks; sc, subcutaneous; 3-monthly, once every 3 months.
Random assignment was stratified according to cytogenetic risk per IPSS-R cytogenetic risk categories. Patients were treated for at least 6 cycles unless the disease progressed or patients experienced unacceptable toxicity. The dose and schedule for durvalumab were selected on the basis of a phase 1/2 study that evaluated safety, tolerability, and pharmacokinetics of intravenous durvalumab given as monotherapy in patients with advanced solid tumors and on pharmacokinetic profile simulations for durvalumab. A fixed-dose schedule was selected on the basis of simulation results that demonstrated that body weight–based and fixed-dosing regimens yielded similar median steady-state pharmacokinetic concentrations, with slightly less overall between-subject variability with fixed dosing. Dose modifications for both azacitidine and durvalumab were permitted in any cycle for appropriate management of adverse events (AEs), as described in the supplemental Methods. Disease status was centrally evaluated at the end of cycles 3 and 6 and at the end of every third treatment cycle thereafter. All patients who discontinued treatment were observed for 28 days after the last dose of azacitidine and for 90 days after the last dose of durvalumab for safety. After the 28-day or the 90-day period, any progression to AML or suspected treatment-related serious AEs (SAEs) were evaluated until the date of study discontinuation. All patients were followed every 3 months for survival.
The study protocol was approved by the institutional review board or independent ethics committee at each study site before the study began. The sponsor, its authorized representative, and investigators abided by Good Clinical Practice as described in the International Council for Harmonisation Guideline E6 and in accordance with the general ethical principles outlined in the Declaration of Helsinki. The study was conducted in accordance with applicable national, state, and local laws of the pertinent regulatory authorities, and all patients provided informed consent.
End points and assessments
Efficacy.
The primary end point was the overall response rate (ORR), defined as complete response (CR), marrow CR (mCR), partial response (PR), or hematologic improvement (HI) based on modified International Working Group (IWG) 2006 response criteria.19 Key secondary end points were (1) time to response per IWG 2006 criteria,19 defined as time from random assignment to first documented response; (2) duration of response, defined as time from initial response or improvement until relapse or disease progression; (3) cytogenetic response, defined as the proportion of patients who achieved complete or partial cytogenetic response; (4) proportion of patients whose disease transformed to AML; (5) time to AML transformation; (6) relapse-free survival, defined as time from CR, mCR, or PR or until first relapse, death as a result of any cause, or lost to follow-up; (7) 1-year survival; (8) OS, defined as time from random assignment to death as a result of any cause; and (9) progression-free survival (PFS), defined as time from random assignment to the first documented disease progression, relapse, or death as a result of any cause, whichever occurred first.
Safety.
Safety assessments included AEs, laboratory measures, electrocardiograms, vital signs, and physical examinations. These assessments were made at screening, regular predetermined time points during treatment, treatment discontinuation, and days 28 and 90 of follow-up. AEs were graded according to National Cancer Institute Common Terminology Criteria for Adverse Events version 4.03. Treatment-related AEs were those that the investigator suspected were related to the study drug.
Pharmacokinetics.
Blood samples for pharmacokinetic assessment were collected at the end of infusion on day 1 of cycles 1 and 4 (considered peak concentrations) and pre-infusion (90 to 5 minutes before dosing) on day 1 of cycles 2, 4, and 6 (considered trough concentrations in the previous cycles). Serum durvalumab concentrations were measured by using a validated electrochemiluminescence method.20 Pharmacokinetic concentration data and summary statistics were tabulated.
Translational biomarker assessments
DNA methylation analyses.
DNA was extracted from peripheral blood (PB) samples collected at cycle 1 day 1 (C1D1; pretreatment) and C2D1 (during treatment) and quantified with PicoGreen DNA quantification (LabCorp, Burlington, NC). Changes in median global DNA methylation score (GDMS) and focal DNA demethylation in PD-L1 and PD-L2 regulatory regions were assessed using the Infinium MethylationEPIC Array (Illumina, San Diego, CA). The degree of methylation was assessed by using beta values calculated by taking the ratio of methyl: probe for all probe intensities. GDMS was calculated by tabulating the percentage of highly methylated loci (beta value >0.7). Change in GDMS was calculated by subtracting a patient’s C2D1 GDMS from the C1D1 GDMS.
Immunophenotyping and ICP molecule expression.
PB was collected at C1D1 (pretreatment), C1D8, C1D15, C2D1, and C2D15 for flow cytometry analyses. PB samples were collected in sodium-heparin tubes and shipped the same day at ambient temperature to the analytical laboratory (Q2 Solutions, Morrisville, NC, and Edinburgh, United Kingdom). Cells were resuspended and stained with 3 separate panels of antibodies. Change in abundance of T-cell subsets was determined by measuring percent change at each time point compared with the C1D1 mean.
BM aspirates were collected at screening, C3D22, and C6D22. Samples were sent to Munich Leukemia Laboratory (Münchner Leukämielabor [MLL]; https://www.mll.com/en.html) for processing and flow cytometry. A panel of flow cytometry antibodies was used to detect granulocytes, lymphocytes, monocytes, T cells, and tumor blasts, which were gated on the basis of CD34 and CD117 variant expression. Surface expression of PD-L1, PD-1, and T-cell immunoglobulin and mucin domain-3 (TIM-3) was assessed on BM cells. PD-L1 (clone 29E.2A3) surface expression was quantified using QuantiBrite beads and was reported as molecules of equivalent soluble fluorochrome (MESF).
Mutation profiling.
Gene mutations were assessed at screening with a next-generation targeted sequence assay at the MLL. The targeted 38-gene panel included the most commonly mutated genes observed in MDS. The mean sequencing coverage across the panel and samples was ∼3000×. MLL performed the primary analysis and categorized each non-reference genetic alteration as mutated, wild-type (or common single nucleotide polymorphism), or non-detrimental variant for each of the 38 genes, along with mutational load and coverage at each non-reference location.
RNA sequencing.
Gene expression analysis by RNA sequencing was performed on BM aspirates at screening and C3D22. RNA sequencing was performed at EA Genomics (Q2 Solutions, Morrisville, NC) by using the QIAGEN Micro RNAeasy kit (Hilden, Germany). Quality control checks included spectrophotometric measurements and agarose gel analysis. RNA sequencing libraries were prepared by using polyA enrichment and strand-specific library construction with barcodes. Samples were sequenced on an Illumina HiSeq 2500 with 2- × 50-bp read lengths using truSeq SBS v4 chemistry (Illumina).
Alignment was performed by using a 2-pass mode with STAR (v2.5.2b) on the full hg38 human genome, and gene level counts were obtained using the quantmode GeneCounts option. Gene expression was then normalized with the voom function in the limma R package. The plots of gene expression use the voom normalized and log2 transformed data and, in those plots, the boxes representing the mean and standard error of the mean were calculated using ggplot.
Statistical analyses
Assuming a treatment effect of 100% relative improvement to ORR of 36% to 72%, a sample size of 72 patients was needed to provide 90% power to detect an effect at the 5% level of statistical significance. The primary analysis was conducted on the intent-to-treat (all randomly assigned patients) population after all patients completed 6 cycles and had disease assessment. Additional details are presented in the supplemental Methods.
ORR was summarized with a 2-sided 95% confidence interval (CI). Patients who were alive at the time of the clinical data cutoff date were censored at the earlier of last assessment at which the patient was known to be alive or the cutoff date. All patients lost to follow-up before the clinical data cutoff were also censored at the time of last contact. Median PFS with a 2-sided 95% CI was provided for each treatment group. The OS curve and OS and PFS at 6 and 12 months were estimated and compared by using the Kaplan-Meier method. Statistical analyses for primary and secondary end points were conducted with SAS version 9.3 or higher.
Results
Patients and treatment
The study was conducted from June 3, 2016, to October 31, 2018, in Europe and the United States. A total of 84 patients (n = 42 per arm) were randomly assigned. As of the final clinical data cutoff date (October 31, 2018), 8 patients in Arm A and 6 in Arm B continued to receive treatment and 70 patients had discontinued treatment. Demographics and baseline disease characteristics were generally balanced across arms (Table 1). Median patient age was 73.5 years (range, 46-89 years), and 58% were males. Approximately half the patients in each arm were classified by IPSS-R as very high risk (Arm A, 47.6%; Arm B, 50.0%), with poor or very poor cytogenetic risk (Arm A, 52.3%; Arm B, 54.7%), and one-third had TP53 mutations (Arm A, 33.0%; Arm B, 30.0%).
Baseline demographics and disease characteristics
| Arm A (azacitidine + durvalumab) (n = 42) | Arm B (azacitidine monotherapy) (n = 42) | |||||
|---|---|---|---|---|---|---|
| No. | % | Median (range) | No. | % | Median (range) | |
| Age, y | 73.0 (46-83) | 74.5 (57-89) | ||||
| Sex | ||||||
| Male | 28 | 30 | ||||
| Female | 14 | 12 | ||||
| ECOG status | ||||||
| 0 | 40.5 | 42.9 | ||||
| 1 | 47.6 | 47.6 | ||||
| 2 | 7.1 | 9.5 | ||||
| Hemoglobin, g/L | 91.5 (54-125) | 89.0 (38-129) | ||||
| Transfusion burden, units/28 d | 0.50 (0.0-7.0) | 2.00 (0.0-8.0) | ||||
| Platelet count × 109/L | 55.0 (5-347) | 46.5 (11-355) | ||||
| Low platelets (<100 000) | 0 | 0 | ||||
| ANC × 109/L | 0.990 (0.03-14.22) | 0.965 (0.10-7.99) | ||||
| Low ANC (<100) | ||||||
| Band form | 0 | 0 | ||||
| Segmented | 29 | 76 | 33 | 83 | ||
| Time since diagnosis, months | 2.1 (0.4-93.8) | 2.5 (0.0-42.1) | ||||
| MDS | ||||||
| Primary | 88.1 | 95.2 | ||||
| Secondary | 11.9 | 4.8 | ||||
| IPSS-R risk category (central)* | ||||||
| Intermediate | 2.4 | 7.1 | ||||
| High | 42.9 | 38.1 | ||||
| Very high | 47.6 | 50.0 | ||||
| IPSS-R cytogenetic risk category | ||||||
| Good/very good | 26.2 | 26.2 | ||||
| Intermediate | 21.4 | 19.0 | ||||
| Poor/very poor | 52.3 | 54.7 | ||||
| Bone marrow blasts, % | 10.00 (1.0-19.0) | 8.00 (0.5-18.5) | ||||
| Bone marrow blast % category | ||||||
| ≤2 | 2.4 | 4.8 | ||||
| >2 to <5 | 11.9 | 7.1 | ||||
| 5-10 | 35.7 | 57.1 | ||||
| >10 | 47.6 | 28.6 | ||||
| Main WHO classes* | ||||||
| RAEB-1 | 31.0 | 38.1 | ||||
| RAEB-2 | 40.5 | 35.7 | ||||
| Others | 26.2 | 19.1 | ||||
| TP53 mutation status† | ||||||
| Wild-type | 67.0 | 70.0 | ||||
| Mutated | 33.0 | 30.0 | ||||
ANC, absolute neutrophil count; ECOG, Eastern Cooperative Oncology Group; RAEB, refractory anemia with excess blasts; WHO, World Health Organization.
Missing category not displayed.
Total of 76 patients across both arms.
The median duration of follow-up was 15.25 months (range, 0.03-24.66 months). Median duration of treatment with azacitidine was similar across arms (Arm A, 239 days; range, 28-716 days; Arm B, 210 days; range, 7-672 days), and median duration of treatment with durvalumab was 215 days (range, 28-713 days). Patients in Arms A and B received a median of 7.9 and 7.0 treatment cycles, respectively, with the majority completing ≥4 cycles (Arm A: azacitidine, 73.7% and durvalumab, 71.0%; Arm B: azacitidine, 65.9%) (supplemental Figure 1).
Efficacy
No statistically significant difference in ORR or HI was observed between treatment arms. The mCR rate in Arm A was numerically higher (35.7%; 95% CI, 21.2%-50.2%) than that in Arm B (19.0%; 95% CI, 7.2%-30.9%) (Table 2). In Arm A, 23 (54.8%) of 42 patients achieved mCR + HI compared with 16 (38.1%) of 42 in Arm B. Among 4 recipients of allogeneic stem cell transplant in Arm B, 2 patients achieved CR and 2 had unknown outcomes; no patient in Arm A received a transplant. Among 46 responders (CR + PR + mCR + HI: Arm A, n = 26; Arm B, n = 20; Table 2), response was ongoing in 22 patients (47.8%) at time of study discontinuation (supplemental Figure 2).
Treatment response for the ITT population (all randomly assigned patients)
| Response | Arm A (azacitidine + durvalumab) (n = 42) | Arm B (azacitidine) (n = 42) | P | ||
|---|---|---|---|---|---|
| No. (%) | 95% CI | No. (%) | 95% CI | ||
| ORR (CR + PR + mCR + HI) | 26 (61.9) | 47.22-76.59 | 20 (47.6) | 32.51-62.72 | .1838 |
| CR | 3 (7.1) | 0.00-14.93 | 4 (9.5) | 0.65-18.40 | |
| mCR | 15 (35.7) | 21.22-50.21 | 8 (19.0) | 7.17-30.92 | |
| PR | 0 | 0 | |||
| HI only | 8 (19.0) | 7.17-30.92 | 8 (19.0) | 7.17-30.92 | |
| SD | 6 (14.3) | 3 (7.1) | |||
ITT, intent to treat; PR, partial remission; SD, stable disease.
The 2 groups did not differ significantly in median time to first response (Arm A: 14.3 weeks; 95% CI, 11.3-20.9 weeks; Arm B: 18.4 weeks; 95% CI, 8.1-26.1 weeks; P = .70), median time to best response (Arm A: 14.3 weeks; 95% CI, 11.6-21.1 weeks; Arm B: 20.6 weeks; 95% CI, 11.9-24.1 weeks; P = .6245), and median duration of response (Arm A: 33.9 weeks; 95% CI, 22.1-47.4 weeks; Arm B: 39.7 weeks; 95% CI, 26.3 to not evaluable [NE]; P = .36).
Complete and partial cytogenetic responses were identified in 8 (38.1%) of 21 and 2 (9.5%) of 21 patients in Arm A, respectively, and 7 (30.4%) of 23 and 1 (4.3%) of 23 in Arm B, for an overall cytogenetic response of 10 (47.6%) in Arm A and 8 (34.8%) in Arm B. Blast reduction compared with baseline was reported in 31 (93.9%) of 33 patients in Arm A and 21 (72.4%) of 29 in Arm B, with maximum blast reduction >10% in 12 and 5 patients, respectively (Figure 2). Red blood cell transfusion independence for ≥56 days was achieved in 17 patients (40.5%) in Arm A and 14 patients (33.3%) in Arm B. In both groups, a similar proportion of patients had disease that progressed to AML (Arm A: 10 [23.8%]; Arm B: 7 [16.7%]) and similar median time to AML progression (Arm A: 19.6 months; 95% CI, 15.0-NE; Arm B: NE).
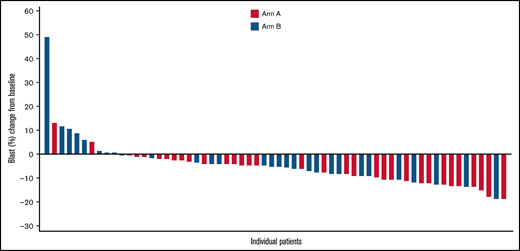
Waterfall plot of maximal blast reduction for each patient from baseline to lowest blast percentage. The graphic illustrates the percentage of blast reduction for all responders. Each responder’s blast percentage is shown as a bar along the x-axis.
Waterfall plot of maximal blast reduction for each patient from baseline to lowest blast percentage. The graphic illustrates the percentage of blast reduction for all responders. Each responder’s blast percentage is shown as a bar along the x-axis.
No differences were noted between Arms A and B for median relapse-free survival (3.7 months; 95% CI, 3.0-5.8 months vs NE; P = .61), median OS (11.6 months; 95% CI, 9.5-NE vs 16.7 months; 95% CI, 9.8-23.5 months; P = .74), and median PFS (8.7 months; 95% CI, 5.6-10.2 months vs 8.6 months; 95% CI, 3.4-11.2 months; P = .93). At 6 months, the PFS rate was 66% in Arm A vs 58% in Arm B, and at 12 months, PFS was 24% in Arm A vs 29% in Arm B. The OS rate at 6 months was 82% in Arm A vs 88% in Arm B, and at 12 months, the OS rate was 49% in Arm A vs 57% in Arm B. At 30 days, mortality was 0% in Arm A and 5% in Arm B; at 60 days, mortality was 8% in Arm A and 7% in Arm B.
Safety
All patients experienced at least 1 treatment-emergent AE (TEAE). In Arm A, TEAEs were related to durvalumab in 27 patients (71.1%) and to azacitidine in 31 patients (81.6%); in Arm B, TEAEs were related to azacitidine in 33 patients (80.5%). The most frequent TEAEs overall were neutropenia (Arm A, 68.4%; Arm B, 53.7%), constipation (Arm A, 57.9%; Arm B, 48.8%), and thrombocytopenia (Arm A, 52.6%; Arm B, 43.9%) (Figure 3). A grade 3 or 4 AE was reported in 97.4% of patients in Arm A and 85.4% in Arm B, the most frequent being hematologic toxicities (Arm A, 89.5%; Arm B, 68.3%). The most common grade 3 or 4 hematologic TEAEs were neutropenia (Arm A, 63.2%; Arm B, 48.8%), febrile neutropenia (Arm A, 42.1%; Arm B, 24.4%), thrombocytopenia (Arm A, 42.1%; Arm B, 31.7%), and anemia (Arm A, 31.6%; Arm B, 22.0%), whereas the most common nonhematologic TEAEs were pneumonia (Arm A, 15.8%; Arm B, 9.8%), asthenia (Arm A, 7.9%; Arm B, 12.2%), diarrhea (Arm A, 7.9%; Arm B, 0%), and urinary tract infection (Arm A, 7.9%; Arm B, 0%). SAEs occurred more commonly in Arm A (86.8%) than in Arm B (65.9%). The most frequent SAEs occurring in ≥15% of patients in either group were febrile neutropenia (Arm A, 36.8%; Arm B, 22.0%) and pneumonia (Arm A, 15.8%; Arm B, 7.3%). Five patients (13.2%) in Arm A and 1 in Arm B discontinued treatment permanently because of a TEAE, and 9 patients (11.4%) required azacitidine dose reduction (Arm A, 3 patients; Arm B, 6 patients). Seven durvalumab-related immune-mediated AEs were reported, including 2 cases of colitis and 1 case of transaminitis, all grade ≥3 requiring treatment discontinuation; 1 case each of autoimmune hemolytic anemia, dermatitis, and immune arthritis, all grade ≥3; and 1 case of grade 2 pneumonitis. All AEs resolved after treatment; however, 1 patient experienced a recurrence of colitis (grade 5).
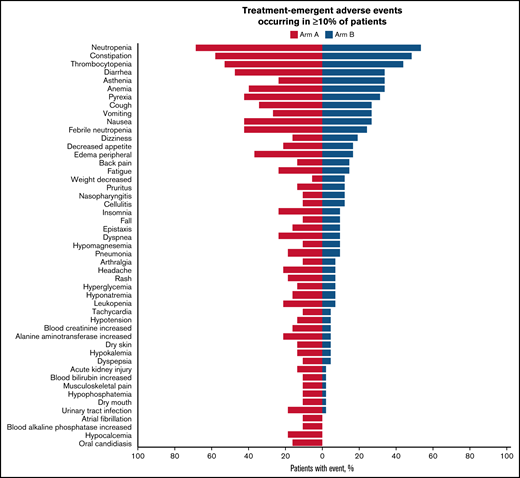
Summary of TEAEs among the safety population. The tornado plot summarizes TEAEs occurring in at least 10% of patients. The y-axis lists TEAEs by preferred term. The safety population is defined as patients who received at least 1 dose of any study treatment.
Summary of TEAEs among the safety population. The tornado plot summarizes TEAEs occurring in at least 10% of patients. The y-axis lists TEAEs by preferred term. The safety population is defined as patients who received at least 1 dose of any study treatment.
Of 17 on-treatment deaths (Arm A, 10 [26.3%]; Arm B, 7 [17.1%]), 14 were a result of AEs (Arm A, 8 deaths [21.1%]; Arm B, 6 deaths [14.6%]). Deaths in Arm A were the result of pneumonia (n = 2), septic shock (n = 2), or general physical decline, respiratory tract infection, colitis, cerebral hemorrhage, multiple organ dysfunction syndrome, or AML (n = 1 each). In Arm B, 7 deaths (all-cause) were a result of sepsis (n = 2) and esophageal infection, intestinal ischemia, cardiac failure, traumatic intracranial hemorrhage, and transformation to AML (n = 1 each). Of these, 2 AEs in Arm A (pneumonia and colitis) and 1 in Arm B (sepsis) were considered treatment related.
Pharmacokinetic analyses
Geometric means (geometric coefficient of variation [CV%]) of peak durvalumab concentrations in cycles 1 and 4 in Arm A were 350 μg/mL (42%, n = 35) and 347 μg/mL (100%, n = 25), respectively. Trough durvalumab concentrations (geometric means [geometric CV%]) in cycles 1, 3, and 5 were 64.0 μg/mL (82%, n = 35), 92.6 μg/mL (117%, n = 27), and 89.5 μg/mL (109%, n = 22), respectively.
Biomarker analyses
Azacitidine pharmacodynamic activity measured in PB samples indicated reductions in global methylation at the end of treatment cycle 1 across both arms. GDMS decreased in 36 (95%) of 38 patients across both arms from a mean of 474 580 to 454 920, with negligible differences between arms (supplemental Figure 3).
Baseline mean PD-L1 surface expression in BM immune cells was highest in monocytes (Arm A, 1213 MESF; Arm B, 1459 MESF), with similar expression in granulocytes (Arm A, 477 MESF; Arm B, 573 MESF) and myeloid blasts (Arm A, 530 MESF; Arm B, 556 MESF) (Figure 4). At the end of cycle 3, no treatment-induced changes in PD-L1 surface expression were observed in blasts from either arm. In contrast, Arm A had a nearly twofold upregulation of PD-L1 surface expression on monocytes and granulocytes. In Arm B, PD-L1 surface expression was higher at the end of cycle 3 in granulocytes only, but the variation between patients was high and the CI overlapped the screening levels (Figure 4). No notable increase in PD-L2 surface expression in BM immune cells or myeloid blasts was observed after treatment (supplemental Figure 4).
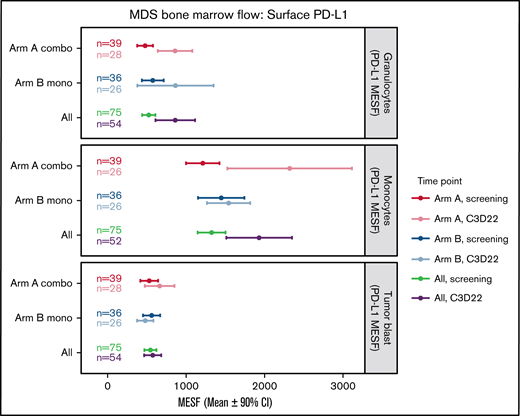
Changes in surface PD-L1 expression on BM cells during treatment. This plot represents the mean (circles) and 90% CIs (error bars) for surface PD-L1 (CD274) abundance (MESF) at screening and C3D22 on 3 different cell types: granulocytes, monocytes, and tumor blasts. PD-L1 is notably higher at C3D22 compared with screening on granulocytes and monocytes for patients in Arm A because the CIs are not overlapping. PD-L1 on tumor cells is not increased beyond the CI. Combo, combination therapy; Mono, monotherapy.
Changes in surface PD-L1 expression on BM cells during treatment. This plot represents the mean (circles) and 90% CIs (error bars) for surface PD-L1 (CD274) abundance (MESF) at screening and C3D22 on 3 different cell types: granulocytes, monocytes, and tumor blasts. PD-L1 is notably higher at C3D22 compared with screening on granulocytes and monocytes for patients in Arm A because the CIs are not overlapping. PD-L1 on tumor cells is not increased beyond the CI. Combo, combination therapy; Mono, monotherapy.
Treatment-induced changes in BM immune cells at the end of cycle 3 included a modest increase in the percentage of lymphocytes (10%) in both arms (supplemental Figure 5A), whereas only a small increase in the percentage of CD3+ T cells (5%) was observed when using paired measurements (supplemental Figure 5B). Tumor blasts, measured by flow cytometry, showed a slight decrease (<5%) when looking at 50 paired patients across both arms at the end of cycle 3, but no significant difference in reduction between arms was observed (supplemental Figure 5B). Treatment-induced changes in expression of ICP molecules PD-1 and TIM-3 on CD4+ or CD8+ BM CD3+ T cells were not observed in either arm (not shown). No apparent treatment-induced changes in PB T-cell abundance were observed at the time points measured (supplemental Figure 6A-B). These data suggest durvalumab did not promote T-cell expansion or enhance antitumor activity at the time points measured.
RNA sequencing analysis of BM mononuclear cells was used to identify changes in gene expression of immune-related genes. Results showed that expression of T-cell genes, PD-1, PD-L1, and the interferon-γ signature (the mean of PD-L1, LAG3, IFNG, and CXCL9) was increased on treatment compared with baseline (Figure 5A), with slightly larger increases in the combination therapy arm for some genes. For example, in patients who provided both a screening and cycle 3 sample, CD3D increased by a mean of 3.0 times in Arm A and 1.5 times in Arm B. Many additional T-cell genes shared this pattern (supplemental Figure 7A-B). Other genes of interest include the hematopoietic stem cell and tumor blast cell marker CD34, which was consistently reduced on treatment, and PNMA family member 5 (PNMA5), a cancer testis antigen that was highly upregulated in both arms (Figure 5A). In addition, within Arm A, the interferon-γ signature increased on treatment in paired samples as shown by a 90% CI >0 (Figure 5A). When patients were stratified by response, the increase was observed only in responders (Figure 5B). Patients in Arm B showed similar differences, but CIs were slightly overlapping at 0.
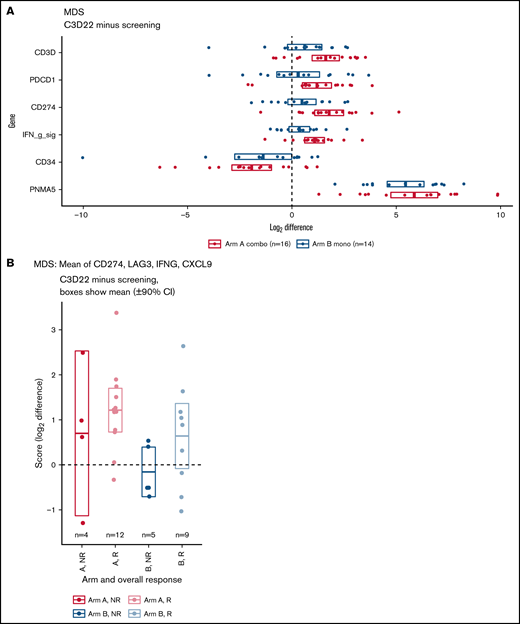
RNA-sequencing analyses. (A) Increase or decrease of gene expression from screening to C3D22 by treatment arm. Genes include CD3D (T-cell gene), PDCD1 (PD-1), CD274 (PD-L1), IFN g sig (interferon-γ signature) (mean of CD274, LAG3, IFNG, CXCL9), CD34 (gene expressed on tumor cells), and PNMA5 (cancer testis antigen). The x-axis is the log2 of the fold change between C3D22 and screening for patients with both time points. (B) Interferon-γ signature at screening and at C3D22 in responders (R) and nonresponders (NR) to treatment with azacitidine and durvalumab (Arm A) or azacitidine monotherapy (Arm B). The plot shows the fold change for those patients with screening samples and C3D22 samples. The y-axis is the log2 of the fold change between C3D22 and screening. The horizontal line in the middle of each box is the mean, and the upper and lower borders of the boxes are the 90% CIs.
RNA-sequencing analyses. (A) Increase or decrease of gene expression from screening to C3D22 by treatment arm. Genes include CD3D (T-cell gene), PDCD1 (PD-1), CD274 (PD-L1), IFN g sig (interferon-γ signature) (mean of CD274, LAG3, IFNG, CXCL9), CD34 (gene expressed on tumor cells), and PNMA5 (cancer testis antigen). The x-axis is the log2 of the fold change between C3D22 and screening for patients with both time points. (B) Interferon-γ signature at screening and at C3D22 in responders (R) and nonresponders (NR) to treatment with azacitidine and durvalumab (Arm A) or azacitidine monotherapy (Arm B). The plot shows the fold change for those patients with screening samples and C3D22 samples. The y-axis is the log2 of the fold change between C3D22 and screening. The horizontal line in the middle of each box is the mean, and the upper and lower borders of the boxes are the 90% CIs.
In a mutational analysis of 38 genes using targeted deep sequencing, the probability of overall response in patients with a gene mutation was compared with the probability of response in patients with wild-type (or nondetrimental) variants of that same gene (supplemental Figure 8). This analysis showed that mutations in TP53 were present in similar proportions of patients in both arms (supplemental Figure 8A), and that patients with TP53 mutations experienced poorer outcomes (41% ORR; 80% CI, 17%-56%) than did those with wild-type TP53 (61% ORR; 80% CI, 51%-70%) (supplemental Figure 8B). No significant differences in overall response were observed on the basis of the mutation status of other genes (supplemental Figure 8B). Furthermore, no significant differences in ORR were found in any sequenced genes when comparing patients with a mutated gene in Arm A with patients with mutations of that gene in Arm B (Figure 6).
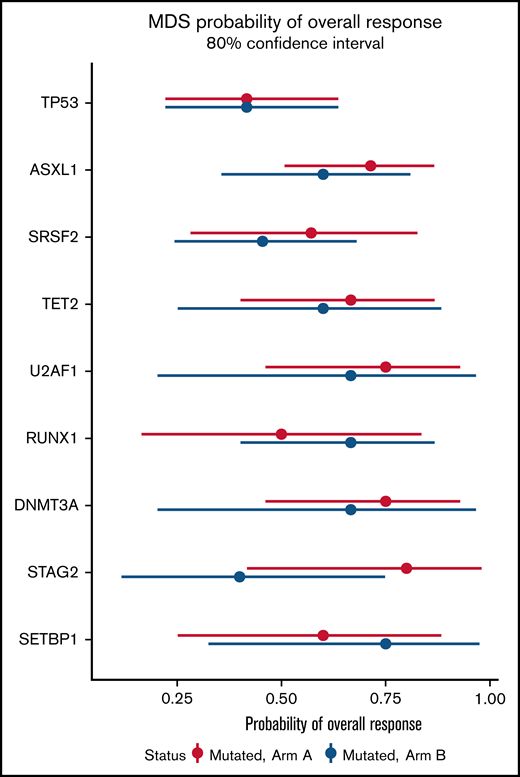
Probability of overall response for patients with somatic mutations in Arm A and Arm B. Effect of mutational status on overall response based on combination treatment with azacitidine and durvalumab vs azacitidine monotherapy. The x-axis presents the odds ratio (circles) with 80% CIs (error bars) for overall response and the y-axis presents the genes of interest.
Probability of overall response for patients with somatic mutations in Arm A and Arm B. Effect of mutational status on overall response based on combination treatment with azacitidine and durvalumab vs azacitidine monotherapy. The x-axis presents the odds ratio (circles) with 80% CIs (error bars) for overall response and the y-axis presents the genes of interest.
Discussion
Patients with HR-MDS have poor clinical outcomes. Although azacitidine improved OS in HR-MDS, CRs occurred in <15% of patients. Real-life analyses have suggested that survival among patients with HR-MDS treated with HMAs is only 11 to 17 months.21-23 Thus, there is a need to improve first-line therapy in patients with HR-MDS, ideally by adding non-myelosuppressive agents to the HMA backbone for this frail patient population.24,25
To our knowledge, this is the first large, randomized trial of azacitidine with or without ICB reported in untreated patients with HR-MDS. Previous studies were mostly single arm, were conducted at 1 or only a few centers, and were not randomized.26-28
Our results indicate that combination therapy yielded no unexpected safety issues, but did not result in a statistically or clinically meaningful difference in ORR, time to first or best response, duration of response, cytogenetic response, HI, or any metrics of survival vs azacitidine monotherapy. However, we did observe a reduction in marrow blast counts and higher rates of mCR and stable disease among patients who received combination therapy. The relatively large number of patients with HR-MDS in this trial enabled determination of the immune-mediated AE profile associated with azacitidine and durvalumab. Rates of hematologic AEs and infections were higher in the combination therapy group (89.5% vs 73.2% and 86.8% vs 65.9%, respectively). However, the TEAEs most frequently reported in this study (neutropenia, constipation, and thrombocytopenia) were not the same as those in a phase 2 study of combination therapy with azacitidine plus nivolumab or ipilimumab.29 The most common toxicities associated with nivolumab or ipilimumab combination therapy were skin rash (11%) and fatigue (9%); infection was reported in 6% of patients and febrile neutropenia in 5%. Enrollment of a less high-risk population could account for the differences in the safety profiles of the combination therapies that contained nivolumab or ipilimumab.
Our biomarker analyses showed that pretreatment surface expression of PD-L1 was highest on monocytes and lowest on BM blasts, suggesting that differentiated cells in the TME might exert immune suppressive effects. We also confirmed the pharmacodynamic activity of azacitidine on immune cells with observable increases in hypomethylation that promoted PD-L1 surface expression on monocytes and granulocytes, but surprisingly not on BM blasts at the time points measured.
Although treatment with azacitidine alone or in combination with durvalumab led to an increase in the percentage of BM lymphocytes, there was only a small reduction in tumor blasts, and no evidence that durvalumab promoted peripheral T-cell expansion or reduced PD-1 expression at the time points measured. RNA sequencing data were consistent with the observation that T cells and interferon-γ signaling were slightly increased in the BM after treatment with azacitidine, with slightly larger increases observed in responders and the combination arm. Mutational analyses revealed a negative role for TP53 mutations in response to treatment, suggesting that patient genetic background could be a potential driver of response. These data could help explain biologically why no strong differences in efficacy were observed between arms, but they do suggest that some patients might receive clinical benefit with this combination if they harbor favorable immune and genetic features. In conclusion, this is the first reported randomized trial of ICB among patients with HR-MDS. Across the HR-MDS population, there were no differences in response rates. Although combination therapy was feasible, more toxicities were observed in the combination arm, a finding that was not unanticipated given the profile of durvalumab. Our laboratory analyses suggest that therapy with durvalumab did not significantly enhance immunologic responses against blasts in patients treated with the combination, which might explain the negative clinical results. Given that durvalumab has proven clinical activity against other tumors, these results suggest that therapy with anti‒PD-L1 as a class is probably not helpful in all patients with HR-MDS, but it cannot be extrapolated to other classes of ICB such as anti-PD-1, anti-CTLA4, or anti-TIM-3 agents. Because of the small sample size in this trial, the possibility that patients with some MDS subtypes may benefit from ICB cannot be excluded. Extensive correlative and immunologic analyses should be incorporated in these trials to allow detection of biomarkers for clinical benefits, which might facilitate biomarker-driven patient selection in larger trials.
Acknowledgments
The authors thank the patients enrolled in the study and their families as well as associated clinical trial teams. Writing and editorial assistance was provided by Lauren Gallagher, of Peloton Advantage, LLC, an OPEN Health company (Parsippany, NJ) sponsored by Bristol Myers Squibb (Summit, NJ). The authors, however, directed and are fully responsible for all content and editorial decisions for this manuscript.
This trial (NCT02775903) was sponsored by Celgene, a Bristol Myers Squibb company, and supported by AstraZeneca/MedImmune.
Authorship
Contribution: I.B. contributed the translational plan to the study design; A.P. and G.G.M. contributed tto the study design; A.M.Z. served as the principal investigator; A.M.Z., G.G.M., M.T., L.R.S., M.T.V., and A.H. enrolled patients; I.B., W.B.C., B.A.F., and A.M.Z. collected and assembled the data; I.B., W.B.C., V.E.H., E.T., and B.A.F. analyzed biomarker data; A.P., T.O., S.R., and C.L.B. analyzed clinical data, including efficacy and safety data; K.O. analyzed pharmacokinetic data; A.P. and A.M.Z. analyzed data; B.A.F., I.B., A.P., and A.M.Z. prepared the manuscript; and all authors had access to primary trial data, interpreted the data, reviewed and revised the manuscript, and provided final approval of the manuscript.
Conflict-of-interest disclosure: A.M.Z. is a Leukemia and Lymphoma Society Scholar in Clinical Research; was supported by a National Cancer Institute Cancer Clinical Investigator Team Leadership Award; received research funding (institutional) from Celgene/Bristol Myers Squibb, AbbVie, Astex, Pfizer, MedImmune/AstraZeneca, Boehringer Ingelheim, Trovagene/Cardiff Oncology, Incyte, Takeda, Novartis, Amgen, Aprea, and ADC Therapeutics; participated in advisory boards and/or served as a consultant for and received honoraria from AbbVie, Otsuka, Pfizer, Celgene/Bristol Myers Squibb, Jazz Pharmaceuticals, Incyte, Agios, Boehringer Ingelheim, Novartis, Acceleron, Astellas, Daiichi Sankyo, Cardinal Health, Taiho, Seattle Genetics, BeyondSpring, Trovagene/Cardiff Oncology, Takeda, Ionis, Amgen, Janssen, Epizyme, Syndax, Gilead, Kura, Aprea, Janssen, and Tyme; served on clinical trial committees for Novartis, AbbVie, Geron, Gilead, Kura, and Celgene/Bristol Myers Squibb; and received travel support for meetings from Pfizer, Novartis, and Cardiff Oncology. I.B., C.L.B., W.B.C., E.T., B.A.F., V.E.H., K.O., T.O., A.P., and S.R. are employed by Bristol Myers Squibb and may be shareholders. L.R.S. received research funding from Celgene, Onconova Therapeutics, Forty Seven, MedImmune, and Takeda. M.T.V. received research funding from Celgene and participated in speakers bureaus for Celgene, Astellas, Jazz Pharmaceuticals, and AbbVie. M.T. served as a consultant for Celgene, Astellas, and Novartis and participated in sponsored conferences and meetings with Celgene, Astellas, Amgen, Novartis, Pfizer, and Servier. G.G.M. received support from Celgene and Bristol Myers Squibb. The remaining authors declare no competing financial interests.
The content of this article is solely the responsibility of the authors and does not necessarily represent the official views of the National Institutes of Health.
Correspondence: Amer M. Zeidan, Department of Internal Medicine, Yale University and Yale Cancer Center, 37 College St, First Floor, New Haven, CT 06510; email: amer.zeidan@yale.edu.

