

Key Points
Patients with FLT3-mutated R/R AML benefitted from gilteritinib regardless of comutations, FLT3-ITD allelic ratio, or FLT3-ITD length.
Resistance to gilteritinib was associated with acquired Ras/MAPK pathway gene mutations and FLT3 F691L mutations.

Abstract
The phase 3 Study of ASP2215 Versus Salvage Chemotherapy in Patients With Relapsed or Refractory Acute Myeloid Leukemia (AML) With FMS-like Tyrosine Kinase (FLT3) Mutation (ADMIRAL) trial demonstrated the superiority of the FLT3 inhibitor, gilteritinib, to salvage chemotherapy (SC) in patients with FLT3-mutated relapsed or refractory (R/R) AML. Baseline comutations, FLT3-internal tandem duplication (ITD) allelic ratio and length, and treatment-emergent mutations were analyzed in patients in the ADMIRAL trial. Baseline comutations were grouped according to gene subgroups (DNA methylation/hydroxymethylation, transcription, chromatin–spliceosome, receptor tyrosine kinase-Ras signaling, TP53-aneuploidy, NPM1, DNMT3A, DNMT3A/NPM1, WT-1, and IDH1/IDH2). Across all but 1 gene subgroup (TP53-aneuploidy), higher pretransplant response rates and a trend toward longer overall survival were observed with gilteritinib vs SC. Patients with DNMT3A/NPM1 comutations who received gilteritinib had the most favorable outcomes of any molecular subgroup analyzed. Survival outcomes with gilteritinib were not adversely affected by FLT3-ITD allelic ratio, FLT3-ITD length, or multiple FLT3-ITD mutations. Among patients who relapsed on gilteritinib, Ras/mitogen-activated protein kinase (MAPK) pathway and FLT3 F691L gene mutations were the most common mutational events associated with treatment resistance. However, the occurrence of Ras/MAPK pathway gene mutations at baseline did not preclude a clinical benefit from gilteritinib. Acquisition of multiple Ras/MAPK pathway gene mutations at relapse suggests a high level of pathway reactivation is needed to overcome the gilteritinib treatment effect. These findings provide insight into the R/R AML molecular profile and the impact of FLT3 inhibitors on mutational evolution associated with treatment resistance and benefit of gilteritinib across a wide spectrum of molecular and genetic subgroups in FLT3-mutated R/R AML. This trial was registered at www.clinicaltrials.gov as #NCT02421939.
Introduction
Genomic profiling studies have identified several recurrent mutations in patients with acute myeloid leukemia (AML).1,2 Samples analyzed from 1540 patients in prospective clinical trials of intensive chemotherapy identified >5000 driver mutations across 76 genes/genomic regions, with 86% of patients having ≥2 driver mutations.2 Fms-like tyrosine kinase 3 (FLT3) is frequently mutated in patients with AML, with activating mutations occurring in ∼30% of patients.3,4 Activating FLT3 internal tandem duplication (FLT3-ITD) mutations are associated with an increased risk of relapse and short survival.5 Additionally, a high FLT3-ITD allelic ratio has a negative impact on survival and achievement of remission with intensive chemotherapy.6,7
The emergence of targeted therapies has transformed the treatment paradigm for both newly diagnosed AML and relapsed or refractory (R/R) AML.8-12 Gilteritinib is an oral, highly specific type I FLT3 inhibitor with demonstrated activity against FLT3-ITD and FLT3 tyrosine kinase domain (FLT3-TKD) mutations.13,14 Findings from a phase 1/2 study showed that ≥80-mg/day doses of single-agent gilteritinib resulted in potent inhibition of FLT3 receptor autophosphorylation and an overall response rate of 52% in patients with FLT3-mutated (FLT3mut+) R/R AML.15 The phase 3 Study of ASP2215 Versus Salvage Chemotherapy in Patients With Relapsed or Refractory Acute Myeloid Leukemia (AML) With FMS-like Tyrosine Kinase (FLT3) Mutation (ADMIRAL) trial demonstrated the superiority of gilteritinib to salvage chemotherapy (SC) in patients with R/R FLT3mut+ AML9 and led to approval of gilteritinib for this population.16
Despite achieving remission with FLT3 inhibitor therapy, response duration is limited because of the development of treatment resistance. Recent evidence suggests that both on- and off-target mechanisms underlie resistance to FLT3 inhibitor therapy. Secondary on-target mutations in the FLT3 kinase activation loop at the D835 codon confer treatment resistance to type II FLT3 inhibitors, such as sorafenib and quizartinib.17-19 Secondary on-target mutations at the gatekeeper F691 residue confer resistance to both type I and type II FLT3 inhibitors.20,21 Treatment-emergent activating mutations in Ras/mitogen-activated protein kinase (MAPK) pathway genes are associated with resistance to gilteritinib and crenolanib.21,22
Next-generation sequencing (NGS) technology has allowed for in-depth evaluation of the AML molecular signature.23 An NGS-based analysis of baseline comutations and treatment-emergent mutations at relapse was performed in patients from the ADMIRAL trial. FLT3-ITD allelic burden and length were also assessed. The objectives of this analysis were to assess the mutational spectrum before and after gilteritinib therapy, to analyze the relationship of mutational spectrum to clinical outcomes, and to determine the impact of FLT3-ITD allelic ratio and length on treatment response and overall survival (OS).
Methods
ADMIRAL study design and patient population
A complete description of the ADMIRAL study design and patient population has been previously published by Perl and colleagues.9 Briefly, ADMIRAL was a global, phase 3, randomized, open-label study of gilteritinib (120 mg) vs SC in patients with R/R FLT3mut+ AML.9 This study received ethical approval at all participating institutions. Written informed consent was obtained from all patients before enrollment. Patients who had FLT3-ITD or FLT3-TKD (D835 or I836) mutations who were refractory to, or were in first untreated relapse after, initial induction therapy were eligible for enrollment.9 Enrolled patients were randomly assigned 2:1 to receive once-daily oral gilteritinib (120 mg/day) or preselected SC in 28-day cycles.9 Patients assigned to high-intensity SC received 1 to 2 cycles of treatment; those assigned to gilteritinib or low-intensity SC received consecutive cycles of treatment until a discontinuation criterion was met.9 Hematopoietic stem cell transplantation (HSCT) was allowed during the study, and patients randomized to gilteritinib could resume study treatment after donor engraftment. The primary endpoints were OS and the percentage of patients with complete remission with full or partial hematologic recovery (CR/CRh).9 For the current analysis, only responses obtained before transplantation were included so that contributions of the preparative regimen did not confound the analysis.
Assessment of FLT3 mutations and comutations using NGS
Blood or bone marrow samples were obtained from patients in the ADMIRAL study at study entry and at relapse during gilteritinib therapy. DNA was isolated from bone marrow aspirates or blood mononuclear cells after density centrifugation. Baseline comutations were assessed in 361 evaluable patients. DNA samples were analyzed by NGS using the ArcherDx Core Myeloid Panel (Boulder, CO) of 37 recurrently mutated genes in myeloid malignancies (further details provided in the ADMIRAL primary publication online supplement).9 Full exon sequencing was performed for FLT3 and sequencing of mutational hotspots was performed for all other genes. Comutations were categorized according to gene subgroup, as previously described.2 The variant allele frequency (VAF) cut point for mutation positivity was ≥2.7% according to manufacturer specifications. Data were analyzed using Archer Analysis software (v5.1).
Assessment of FLT3-ITD allelic ratio and FLT3-ITD length
The FLT3-ITD allelic ratio (defined as the ratio of FLT3-ITD to wild-type FLT3 DNA) was measured in 335 evaluable patients using the LeukoStrat CDx FLT3 Mutation Assay (Invivoscribe, Inc., San Diego, CA). The median FLT3-ITD ratio for samples assessed in this study was 0.77 (range, 0.05-100). Patients with values ≥0.77 were classified as having a high FLT3-ITD allelic ratio; those with values <0.77 were classified as having a low FLT3-ITD allelic ratio. Median FLT3-ITD length was 51 base pairs (bp); outcomes were assessed at FLT3-ITD lengths >51 bp and ≤51 bp.
Statistical analyses
Frequencies and percentages were displayed for categorical data. Percentages for each category were based on the number of patients with no missing data. The Kaplan-Meier method and the Greenwood formula were used to determine OS.9 The hazard ratio (HR) value was estimated using an unstratified Cox proportional hazards model. The statistical analysis plan did not include provisions for multiplicity correction in analyses of FLT3 allelic ratio or comutations. These results are reported as point estimates and 95% confidence intervals (CIs).9
Results
Baseline comutations
Of 371 enrolled patients, 361 were assessed for comutations at baseline. Demographic and baseline characteristics of patients analyzed for comutations were representative of the ADMIRAL intention-to-treat population.9 In both treatment arms, the proportions of patients preselected for high- and low-intensity chemotherapy were 60% and 40%, respectively. Patients were categorized in the following gene subgroups2,24,25 (Table 1): DNA methylation/hydroxymethylation (41.2%), transcription factors/regulators (26.3%), chromatin–spliceosome–other (17.4%), receptor tyrosine kinase (RTK)-Ras signaling (7.8%), TP53-aneuploidy (3.6%), NPM1 (47.9%), DNMT3A (31.9%), DNMT3A/NPM1 (23.8%), WT1 (18.0%), and IDH1/IDH2 (15.5%). Specific genes included within DNA methylation/hydroxymethylation, transcription factors/regulators, chromatin–spliceosome–other, RTK-Ras signaling, and TP53-aneuploidy subgroups are listed in the supplemental appendix (supplemental Table 1).
Comutations at baseline in patients with R/R FLT3mut+ AML*
| Gene subgroup, n (%) | Gilteritinib (n = 239) | Salvage chemotherapy (n = 122) | Total (N = 361) |
|---|---|---|---|
| DNA methylation/hydroxymethylation | 100 (41.8) | 49 (40.0) | 149 (41.2) |
| Transcription factors/regulators | 64 (26.8) | 31 (25.4) | 95 (26.3) |
| Chromatin–spliceosome–other | 47 (19.7) | 16 (13.1) | 63 (17.4) |
| RTK-Ras signaling | 20 (8.4) | 8 (6.6) | 28 (7.8) |
| TP53-aneuploidy | 7 (2.9) | 6 (4.9) | 13 (3.6) |
| NPM1 | 115 (48.1) | 58 (47.5) | 173 (47.9) |
| DNMT3A | 75 (31.4) | 40 (32.8) | 115 (31.9) |
| DNMT3A/NPM1 | 55 (23.0) | 31 (25.4) | 86 (23.8) |
| WT1 | 45 (18.8) | 20 (16.4) | 65 (18.0) |
| IDH1/IDH2 | 38 (15.9) | 18 (14.8) | 56 (15.5) |
mut+, mutated.
Some patients had mutations in more than one gene category.
We also assessed Ras/MAPK pathway gene mutations because of their previously reported resistance to gilteritinib.21 Mutated Ras/MAPK pathway genes occurred in 6.9% of patients (n = 25/361) and included NRAS (3.9%; n = 14/361), PTPN11 (1.7%; n = 6/361), KRAS (1.4%; n = 5/361), and CBL (0.8%; n = 3/361). No meaningful associations were observed between commonly occurring comutations and other baseline characteristics such as age, sex, Eastern Cooperative Oncology Group performance status, cytogenetic risk, or prior treatment with an FLT3 inhibitor (supplemental Tables 2 and 3).
Impact of baseline comutations on response outcomes
Rates of CR/CRh before HSCT were higher in the gilteritinib arm than in the SC arm across all gene subgroups except TP53-aneuploidy; however, the TP53-aneuploidy category was small (n = 13) (Figure 1A). Because ADMIRAL was a global study, investigators could choose low- or high-intensity chemotherapy regimens in accordance with local standards and practices. Therefore, pretreatment choice of low- vs high-intensity SC was a stratification factor to evaluate the trend of outcome. Patients who received low-intensity SC had considerably lower rates of CR/CRh than patients who received high-intensity SC. We also compared response rates between gilteritinib and SC only in patients randomized to high-intensity SC regimens; higher pretransplant CR/CRh rates were still observed in patients who received gilteritinib than in those who received high-intensity SC in the DNMT3A (28.0% vs 16.0%, respectively) and NPM1/DNMT3A (29.7% vs 14.3%, respectively) subgroups (Figure 1B).
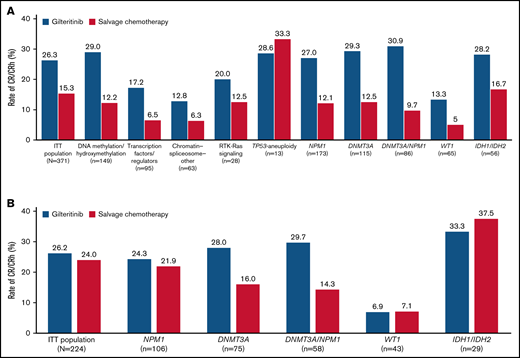
Response rates across gene subgroups. (A) Rates of CR/CRh. (B) Rates of CR/CRh in patients eligible for high-intensity chemotherapy. ITT, intention-to-treat.
Response rates across gene subgroups. (A) Rates of CR/CRh. (B) Rates of CR/CRh in patients eligible for high-intensity chemotherapy. ITT, intention-to-treat.
Impact of baseline comutations on survival outcomes
Longer median OS was observed in the gilteritinib arm than in the SC arm among NPM1-mutated, DNA methylation/hydroxymethylation, and transcription factor categories as well as in comutated DNMT3A, WT-1, and dual-mutated DNMT3A and NPM1 gene categories (Figure 2A). As reported in the primary ADMIRAL publication, the most pronounced survival benefit with gilteritinib was observed in patients who had both DNMT3A and NPM1 comutations.9 We also assessed OS in patients who were randomized to high-intensity SC regimens. Among patients with DNMT3A, NPM1, WT1, IDH1/IDH2, or both DNMT3A and NPM1 comutations, the survival advantage with gilteritinib was maintained in patients eligible for high-intensity chemotherapy (Figure 2B; supplemental Table 4), with the most pronounced survival benefit appearing to be in patients with both DNMT3A and NPM1 comutations (Figure 2C); however, 43% (n = 16/37) of patients in the gilteritinib arm who were eligible for high-intensity chemotherapy had also undergone HSCT during the study.
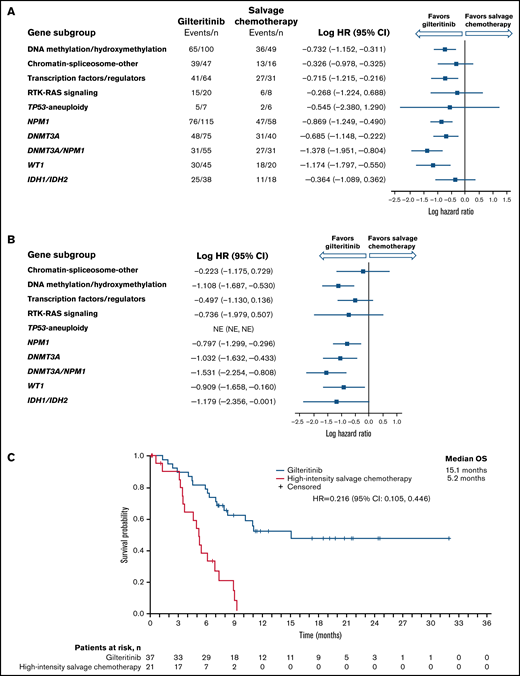
Overall survival by molecular risk and comutated gene categories. (A) Intention-to-treat population. (B) Patients eligible for high-intensity chemotherapy. (C) Dual comutated DNMT3A and NPM1: patients eligible for high-intensity chemotherapy regimens. NE, not estimable.
Overall survival by molecular risk and comutated gene categories. (A) Intention-to-treat population. (B) Patients eligible for high-intensity chemotherapy. (C) Dual comutated DNMT3A and NPM1: patients eligible for high-intensity chemotherapy regimens. NE, not estimable.
In patients treated with gilteritinib, median OS was similar in comutated and wild-type NPM1 (supplemental Figure 1A), DNMT3A (supplemental Figure 1B) and WT-1 (supplemental Figure 1C) subgroups. In patients treated with SC, median OS was somewhat shorter in comutated NPM1 and WT-1 subgroups than in wild-type NPM1 or WT-1 subgroups (supplemental Figure 1A,C) but was similar in comutated and wild-type DNMT3A subgroups (supplemental Figure 1B).
Impact of FLT3-ITD mutation length and multiple FLT3-ITD mutations on clinical outcomes
A total of 280 patients had centrally confirmed single FLT3-ITD mutations at baseline (gilteritinib, n = 189; SC, n = 91) and were assessed for FLT3-ITD mutation length. Regardless of FLT3-ITD length, a trend toward longer median OS was observed with gilteritinib compared with SC (Figure 3A). Among patients who had FLT3-ITD lengths >51 bp, median OS was 10.4 months in the gilteritinib arm and 6.0 months in the SC arm (HR = 0.480; 95% CI, 0.311-0.742) (Figure 3A). Among patients with FLT3-ITD lengths ≤51 bp, median OS was 8.9 months in the gilteritinib arm and 6.1 months in the SC arm (HR = 0.807; 95% CI, 0.520-1.250). Response to gilteritinib was also not affected by FLT3-ITD length. Rates of pretransplant composite complete remission (CRc) were higher in the gilteritinib arm than the SC arm, irrespective of FLT3-ITD length at baseline (supplemental Table 5).

Overall survival by FLT3-ITD length at baseline. (A) Impact of FLT3-ITD length relative to median value: ≤51 bp vs >51 bp. (B) Relative impact of FLT3-ITD length and multiple FLT3-ITD mutations in the gilteritinib arm. (C) Relative impact of FLT3-ITD length and multiple FLT3-ITD mutations in the salvage chemotherapy arm.
Overall survival by FLT3-ITD length at baseline. (A) Impact of FLT3-ITD length relative to median value: ≤51 bp vs >51 bp. (B) Relative impact of FLT3-ITD length and multiple FLT3-ITD mutations in the gilteritinib arm. (C) Relative impact of FLT3-ITD length and multiple FLT3-ITD mutations in the salvage chemotherapy arm.
Fifty-five patients (gilteritinib, n = 33; SC, n = 22) had multiple FLT3-ITD mutations at baseline, which precluded assignment of a single ITD length in this group. The comutation profile of these 55 patients was similar between treatment arms and similar to that of the overall ADMIRAL population (NPM1: 47.3% [n = 26]; DNMT3A: 29.1% [n = 16]; NPM1 and DNMT3A: 25.5% [n = 14]; WT1: 14.5% [n = 8]), and 43.6% (n = 24) had no comutated genes at baseline. Among patients with multiple FLT3-ITD mutations, median OS was 8.3 months in the gilteritinib arm and 3.5 months in the SC arm (HR = 0.624; 95% CI, 0.331-1.175). The presence of multiple FLT3-ITD mutations did not have an impact on response to gilteritinib; pretransplant CRc rates with gilteritinib and SC were 52% and 32%, respectively.
When comparing the relative impacts of FLT3-ITD length and multiple FLT3-ITD mutations, patients in the gilteritinib arm with FLT3-ITD lengths >51 bp had the longest median OS (Figure 3B); the presence of multiple FLT3-ITD mutations did not appear to have a negative impact on OS when compared with short or long ITD subgroups (Figure 3B). In the SC arm, median OS was similar in patients who had FLT3-ITD lengths ≤51 bp or >51 bp, although the curves diverged at the 50% survival interval, with a trend toward longer survival in the short ITD group than the long ITD group (Figure 3C). Survival in SC-treated patients seemed to be shorter in the presence of multiple FLT3-ITD mutations when compared with short or long ITD groups; however, the number of patients with multiple ITDs was small (n = 22; Figure 3C).
Impact of baseline FLT3-ITD allelic ratio on clinical outcomes
Of 339 enrolled patients with a FLT3-ITD mutation, 335 (99.1%) had centrally confirmed FLT3-ITD mutations and were assessed for FLT3-ITD allelic ratio. The prognostic significance of FLT3-ITD allelic ratio has not been established in patients with R/R AML and there is no allelic ratio threshold associated with prognosis in R/R AML. Therefore, we calculated the median FLT3-ITD allelic ratio in the ADMIRAL population (0.77) and classified patients as either high (≥0.77) or low (<0.77) FLT3-ITD allelic ratio. A total of 169 patients (50.4%) had a high FLT3-ITD allelic ratio and 166 patients (49.6%) had a low FLT3-ITD allelic ratio. Among patients with a high FLT3-ITD allelic ratio, rates of pretransplant CR/CRh were 21.1% in the gilteritinib arm and 10.0% in the SC arm. Among patients with a low FLT3-ITD allelic ratio, rates of CR/CRh were 32.7% in the gilteritinib arm and 18.9% in the SC arm. For patients who were preselected for high-intensity chemotherapy, lower rates of CR/CRh were observed in those with high FLT3-ITD allelic ratio (gilteritinib vs SC: 15.9% vs 17.1%, respectively) than in patients with a low FLT3-ITD allelic ratio (gilteritinib vs SC: 35.7% vs 30.3%, respectively).
The impact of FLT3-ITD allelic ratio on OS was reported in the primary publication of the ADMIRAL trial.9 Patients with a high FLT3-ITD allelic ratio who were treated with gilteritinib had significantly longer median OS (7.1 months) than those treated with SC (4.3 months; HR = 0.49; 95% CI, 0.34-0.71).9 In patients with a low FLT3-ITD allelic ratio, median OS following treatment with gilteritinib and SC was 10.6 months and 6.9 months, respectively (HR = 0.795; 95% CI, 0.526-1.200). Median OS in patients with high and low FLT3-ITD allelic ratio within the gilteritinib and SC arms are presented in supplemental Figure 2. Across both treatment groups, OS was lower in patients with a high FLT3-ITD allelic ratio than in those with a low FLT3-ITD allelic ratio (supplemental Figure 2A-B). In patients who were preselected for high-intensity chemotherapy, median OS in gilteritinib and SC arms were 7.9 months and 5.2 months, respectively (HR = 0.586; 95% CI, 0.359-0.955) in the high FLT3-ITD allelic ratio group, and 11.5 months and 8.0 months, respectively (HR = 0.804; 95% CI, 0.467-1.384) for the low FLT3-ITD allelic ratio group (supplemental Figure 3).
Mutation profiles of patients who relapsed on gilteritinib therapy
Of the 247 patients assigned to gilteritinib therapy in the ADMIRAL trial, 75 patients (30%) who achieved CRc (ie, CR with or without complete hematologic or platelet recovery) relapsed on gilteritinib therapy. The median time from the first dose of gilteritinib to relapse was 4.6 months (range, 1.3-20.3). Of the 75 patients who relapsed on gilteritinib therapy, 40 (53.3%) had blood or bone marrow samples available for analysis at baseline and at relapse. Of these 40 patients, 33 (82.5%) had a FLT3-ITD mutation, 4 (10.0%) had a FLT3-TKD mutation, and 3 (7.5%) had both FLT3-ITD and FLT3-TKD mutations at baseline.
Thirty-nine of the 40 evaluable patients who relapsed on gilteritinib therapy could be assessed by a central laboratory for FLT3 mutations at relapse (Figure 4). Among 32 patients with FLT3-ITD mutations and no other FLT3 mutations at baseline, 26 retained FLT3-ITD mutations at relapse and 6 had no FLT3 mutations at relapse. Among the 4 patients with FLT3-TKD mutations and no other FLT3 mutations at baseline, 2 lost their FLT3-TKD mutation at relapse, 1 retained the FLT3-TKD mutation at relapse, and 1 lost the FLT3-TKD mutation but acquired a FLT3-ITD mutation at relapse. Of the 3 patients who had both a FLT3-ITD and a FLT3-TKD mutation at baseline, 1 retained both mutations at relapse, 1 lost the FLT3-ITD mutation at relapse, and 1 had lost both FLT3-ITD and FLT3-TKD mutations at relapse.
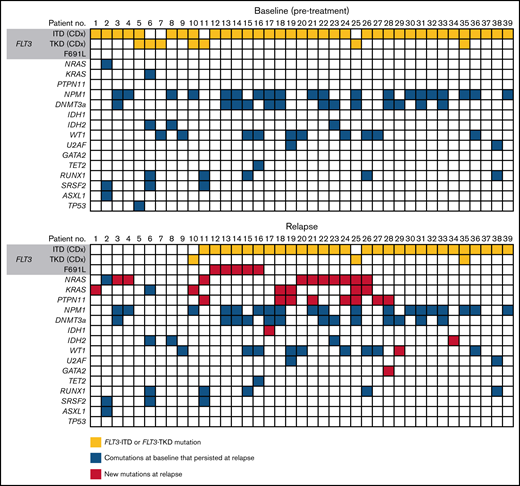
Mutations detected at baseline and at relapse in patients who relapsed on gilteritinib.
Mutations detected at baseline and at relapse in patients who relapsed on gilteritinib.
Overall, 27 of the 40 relapsed patients (67.5%) had new gene mutations at relapse detected by our targeted panel (Figure 4; supplemental Table 6). New mutations in Ras/MAPK pathway genes occurred in 18 patients (45.0%; median VAF = 8% [range, 0%-40%]; Figure 5A); the most frequently mutated Ras/MAPK pathway genes were NRAS, PTPN11, and KRAS (Figure 5B; supplemental Figure 4). Of these 18 patients, 38.9% (n = 7) had developed 1 new Ras/MAPK pathway gene mutation, and 61.1% (n = 11) had >1 new Ras/MAPK pathway gene mutation (supplemental Figure 4A). New Ras/MAPK mutations at relapse most frequently occurred in NRAS (61.1%; n = 11; median VAF = 9% [range, 0%-40%]), followed by PTPN11 (44.4%; n = 8; median VAF = 6% [range, 0%-30%]) and KRAS (38.9%; n = 7; median VAF = 4% [range, 0%-20%]) (supplemental Figure 4B).

Mutation profile of patients who relapsed on gilteritinib therapy. (A) New mutations at relapse. (B) New Ras/MAPK gene mutations at relapse. (C) New FLT3 mutations at relapse. Analyses were restricted to patients who had blood or bone marrow samples available at both baseline and at relapse. †Some patients had mutations in more than 1 Ras/MAPK pathway gene. ‡One patient acquired a FLT3 F691L gatekeeper mutation as well as a JMD point mutation at relapse.
Mutation profile of patients who relapsed on gilteritinib therapy. (A) New mutations at relapse. (B) New Ras/MAPK gene mutations at relapse. (C) New FLT3 mutations at relapse. Analyses were restricted to patients who had blood or bone marrow samples available at both baseline and at relapse. †Some patients had mutations in more than 1 Ras/MAPK pathway gene. ‡One patient acquired a FLT3 F691L gatekeeper mutation as well as a JMD point mutation at relapse.
Gilteritinib-treated patients who acquired new Ras/MAPK pathway mutations at relapse had a median duration of CRc before HSCT of 3.3 months (range, 0.9-13.8). Among the 18 gilteritinib-treated patients who acquired new Ras/MAPK gene mutations at relapse, 9 (50.0%) achieved CR/CRh before HSCT; 5 of these patients acquired NRAS mutations, 3 acquired KRAS mutations, and 3 acquired PTPN11 mutations.
Of the 40 patients who relapsed on gilteritinib therapy, 6 (15.0%) acquired new FLT3 mutations. Five of the patients with treatment-emergent FLT3 mutations (83.3%) acquired a FLT3 F691L gatekeeper mutation and 2 (33.3%) acquired FLT3 juxtamembrane (JMD) E598D mutations. One patient acquired both a FLT3 F691L mutation (VAF=53.0%) and a FLT3 JMD E598D mutation (VAF = 12.0%), and 1 patient acquired both a FLT3 F691L mutation and a WT1 mutation. No new FLT3-TKD mutations were acquired at relapse. New WT1 mutations were observed at relapse in three of the 40 (7.5%) patients. The acquisition of FLT3 F691L gatekeeper mutations and Ras/MAPK pathway gene mutations was mutually exclusive.
Response outcomes in patients with mutated Ras/MAPK pathway genes at baseline
The prevalence of Ras/MAPK pathway gene mutations in patients who relapsed on gilteritinib treatment impelled us to assess if these mutations could be detected in patients before treatment and whether presence of a Ras/MAPK pathway gene mutation would affect response to gilteritinib treatment. Of 361 patients with baseline samples that were analyzed for comutations, 25 had Ras/MAPK pathway gene mutations at baseline (median VAF = 14.0%; range, 0%-50.0%); 18 of these patients received gilteritinib and 7 received SC. Of these 18 gilteritinib-treated patients, 83.3% (n = 15) had only 1 Ras/MAPK pathway gene mutation at baseline (supplemental Figure 5A). Among gilteritinib-treated patients who acquired Ras/MAPK pathway gene mutations at relapse (n = 18), 61.1% (n = 11) had more than 1 RAS/MAPK pathway gene mutation (supplemental Figure 5B). Mutations in Ras/MAPK genes at baseline occurred most frequently in NRAS (55.6%; n = 10; median VAF = 10.0% [range, 0%-50.0%]) and KRAS (27.8%; n = 5; median VAF = 13.0% [range, 0%-20.0%]). Two patients treated with gilteritinib had Ras/MAPK pathway gene mutations at baseline that persisted at relapse; in both patients, the VAF of the Ras/MAPK mutation had expanded at relapse. One patient had a KRAS G13D mutation at baseline (VAF = 13%) that persisted at relapse (VAF = 40%). The other patient had a NRAS G12D mutation at baseline (VAF = 5%) that persisted at relapse (VAF = 9%); this patient also acquired a NRAS G13D mutation at relapse. No KRAS G12C or BRAF V600E/K mutations, which are the only mutations currently targeted by approved therapeutic agents, were detected.
The rate of CRc before HSCT in gilteritinib-treated patients with Ras/MAPK pathway gene mutations at baseline was 33.3% (n = 6/18; Table 2); the median duration of CRc was not estimable (95% CI, 0.5-not evaluable). Among patients with Ras/MAPK pathway gene mutations at baseline, rates of CR/CRh were 22.2% (n = 4/18) in the gilteritinib arm and 14.3% (n = 1/7) in the SC arm. Baseline Ras/MAPK gene mutations in gilteritinib-arm patients who achieved CRc (n = 6), were detected in NRAS (n = 3), CBL (n = 2), and KRAS (n = 1) (supplemental Table 7). The patient in the SC arm who achieved CR had an NRAS mutation at baseline.
Response outcomes in patients with Ras/MAPK gene mutations at baseline
| Response parameter, n (%) | Gilteritinib (n = 18) | Salvage chemotherapy (n = 7) | Total (N = 25) | |
|---|---|---|---|---|
| FLT3-ITD (n = 13) | FLT3-TKD (n = 5) | FLT3-ITD (n = 7) | ||
| CR | 1 (7.7) | 1 (20.0) | 1 (14.3) | 3 (12.0) |
| CRp | 2 (15.4) | 0 | 0 | 2 (8.0) |
| CRi | 1 (7.7) | 1 (20.0) | 0 | 2 (8.0) |
| CRh | 2 (15.4) | 0 | 0 | 2 (8.0) |
| PR | 0 | 0 | 0 | 0 |
| NR | 7 (53.8) | 2 (40.0) | 4 (57.1) | 13 (52.0) |
| NE | 2 (15.4) | 1 (20.0) | 2 (28.6) | 5 (20.0) |
| CR/CRh | 3 (23.1) | 1 (20.0) | 1 (14.3) | 5 (20.0) |
| CRc* | 4 (30.8) | 2 (40.0) | 1 (14.3) | 7 (28.0) |
Bold font indicates aggregate responses.
CRi, complete remission with incomplete hematologic recovery; CRp, complete remission with incomplete platelet recovery; NE, not evaluable; NR, no response; ORR, overall response rate; PR, partial remission.
Defined as the sum of patients who achieved CR, CRi, and CRp.
Discussion
The adoption of FLT3-targeted therapies for patients with AML has the potential to alter the mutation profile over time and may affect long-term outcomes and relapse risk. We investigated the mutational profile of patients with R/R FLT3mut+ AML who received gilteritinib or SC in the phase 3 ADMIRAL trial. In this R/R FLT3mut+ AML population, higher remission rates were observed with gilteritinib than with SC across all gene subgroups. The benefit of gilteritinib was maintained for many subgroups even when comparisons were limited to patients eligible for high-intensity chemotherapy regimens. Patients had longer median OS with gilteritinib therapy than with SC across all comutated subgroups.
Concurrent DNMT3A, NPM1, and FLT3 mutations in newly diagnosed AML is associated with a poor prognosis.2,26,27 In contrast, we previously observed that concurrent DNMT3A and NPM1 comutations in patients with FLT3mut+ R/R AML correlated with high response rates and better survival after treatment with gilteritinib.9 In the current study, we still observed better survival in gilteritinib-arm DNMT3A/NPM1 c-mutated patients eligible for high-intensity chemotherapy. The reason why patients with FLT3mut+ R/R AML with dual DNMT3A/NPM1 comutations had the greatest survival benefit with gilteritinib is unclear.
Although improved outcomes with chemotherapy have been observed in patients with AML and NPM1 mutations at diagnosis,28,29 NPM1 mutations had a somewhat negative impact on outcomes in the FLT3mut+ R/R AML population in this study. We caution that any observed association between genotype and response to gilteritinib should be considered preliminary until confirmed by an independent dataset.
Unlike newly diagnosed AML, where a FLT3-ITD allelic ratio cut point of ≥0.5 is associated with a poorer prognosis, a corresponding prognostic cut point has not been determined for R/R AML.30,31 We therefore stratified patients by the median FLT3-ITD allelic ratio observed in the study, 0.77. Patients with a high FLT3-ITD allelic ratio who received gilteritinib therapy had considerably longer median OS than those who received SC. Similar results were seen in patients with low FLT3-ITD allelic ratio, although the difference between gilteritinib and SC was smaller. Comparisons of OS between high and low FLT3-ITD allelic subgroups showed longer OS in patients with a low FLT3-ITD allelic ratio regardless of treatment arm, suggesting that the FLT3-ITD allelic ratio threshold of 0.77 used in this study may be a surrogate for disease burden. The difference in OS was more pronounced in the SC arm compared with the gilteritinib arm, demonstrating the benefit of gilteritinib therapy regardless of FLT3-ITD allelic ratio. In patients treated with gilteritinib, a high FLT3-ITD allelic ratio was not associated with improved response rates, which is not surprising as the presence of a high FLT3-ITD allelic ratio generally correlates with multiple factors associated with a higher disease burden (eg, higher number of bone marrow blasts and white blood cells) and poor prognosis.7 Notably, FLT3-ITD mutation lengths ≥51 bp did not appear to have a negative impact on survival or response outcomes in patients treated with gilteritinib. The presence of multiple FLT3-ITD mutations did not appear to adversely affect survival in patients treated with gilteritinib. These results highlight the benefit of gilteritinib in FLT3-mutated AML regardless of FLT3-ITD allelic ratio, length, or number.
The development of treatment resistance stemming from either on- or off-target mechanisms as a consequence of prolonged exposure to FLT3 inhibitors reflects compensatory mechanisms by which leukemic cells survive and proliferate when adapting to FLT3 inhibition.19,32-34 Treatment resistance mechanisms that partially restore FLT3 signaling or reactivate the Ras/MAPK pathway enable the survival of leukemic clones.33 Relatively few patients in our study had wild-type FLT3 at relapse, which may reflect biologic differences between newly diagnosed and R/R AML, more diverse resistance mechanisms occurring with the combination of FLT3 inhibitors and high-intensity chemotherapy, or differences between first-generation FLT3 inhibitors that have less potency against FLT3 and second-generation FLT3 inhibitors, like gilteritinib.35
In patients who relapsed on gilteritinib therapy in the ADMIRAL trial, the most common mutational events associated with treatment resistance were Ras/MAPK pathway gene mutations and FLT3 F691L gatekeeper mutations.21 Patients had fewer Ras/MAPK pathway gene mutations at baseline than at relapse. It is unclear why patients with a single Ras/MAPK pathway gene mutation at baseline responded to gilteritinib. The types of acquired Ras/MAPK pathway gene mutations reported in this study are not amenable to currently available BRAF V600E or KRAS G12C mutant inhibitors.36,37 As such, new combinations will be required for patients with R/R AML who acquire Ras/MAPK pathway gene mutations.
FLT3 F691L gatekeeper mutations observed at relapse following gilteritinib therapy in the ADMIRAL trial were uncommon but occurred exclusive of Ras/MAPK pathway gene mutations; the incidence of these mutations was comparable to that reported in patients with R/R FLT3mut+ AML who relapsed after receiving gilteritinib therapy in the Study of Amivantamab, a Human Bispecific EGFR and cMet Antibody, in Participants With Advanced Non-Small Cell Lung Cancer phase 1/2 study.38 Evidence from preclinical studies demonstrates that gilteritinib has activity against FLT3 F691L mutations in vitro but at higher concentrations than those reported to be effective against FLT3-ITD and FLT3-TKD mutations.13 It is therefore possible that the 120-mg/day dose was not adequate to impede the emergence of these mutations.
Nongenetic mechanisms of gilteritinib treatment resistance may also emerge, such as fibroblast growth factor 2–mediated activation of fibroblast growth factor receptor 1 and downstream Ras/MAPK pathway effectors.33 We note that approximately one-third (13/40) of samples taken at relapse did not have a mutation detected. However, samples were not available to assess nongenetic or epigenetic resistance mechanisms. We did not analyze samples for gene fusions such as BCR-ABL1, which may occur at disease progression on gilteritinib.21
Overall, findings from this analysis further confirm the importance of the FLT3 signaling pathway in driving AML evolution and show that the activity of gilteritinib is primarily directed toward FLT3, thus distinguishing it as a highly selective targeted therapy. Notably, these results provide important insights into the mutational factors that affect response to FLT3-targeted therapy and the evolution of the mutational profile over time in patients with R/R FLT3mut+ AML receiving gilteritinib therapy.
Acknowledgments
This study was sponsored by Astellas Pharma, Inc. Medical writing support for this manuscript was provided by Kalpana Vijayan, Cheryl Casterline, MA, and Elizabeth Hermans of Peloton Advantage, LLC, an OPEN Health Company (Parsippany, NJ) and was supported by the study sponsor.
Authorship
Contribution: A.E.P., M.J.L., J.E.H., and M.R. contributed to the study design, interpretation of study data, critically reviewed the manuscript, and provided final approval; C.C.S. contributed to the analysis and interpretation of study data, critically reviewed the manuscript, and provided final approval; and E.B. contributed to the study design, critically reviewed the manuscript, and provided final approval.
Conflict-of-interest disclosure: C.C.S. reports research funding from AbbVie, Revolution Medicines; clinical trial funding from Celgene, FujiFilm; advisory board consulting fees from Astellas, Daiichi Sankyo, and Genentech; and stock ownership in Ligacept, LLC. M.J.L. reports grants from Astellas Pharma, Inc. and FujiFilm; honoraria from Amgen, AbbVie, Astellas Pharma, Inc., Daiichi-Sankyo, Bristol-Myers Squibb, Pfizer, Menarini, and Takeda. A.E.P. reports grants, personal fees, and nonfinancial support from Astellas, during the conduct of the study; grants, personal fees, and nonfinancial support from Daiichi Sankyo, grants and personal fees from AbbVie and Actinium Pharmaceuticals; personal fees from Agios, Loxo, LLS/Beat AML, and Forma; nonfinancial support from Arog; personal fees and nonfinancial support from New Link Genetics, Novartis, Takeda, Jazz; and grants from Bayer and Biomed Valley Discoveries, outside the submitted work. J.E.H. and M.R. are employees of Astellas. E.B. was an employee of Astellas and received travel reimbursement as part of his employment.
The current affiliation for E.B. is Oncology Department, Takeda Pharmaceuticals International, Inc., Deerfield, IL.
Correspondence: Catherine C. Smith, Division of Hematology/Oncology, Department of Medicine, Box 1270, University of California-San Francisco, San Francisco, CA 94143-1270; e-mail: csmith@medicine.ucsf.edu.

