

Key Points
Cerebral adrenoleukodystrophy manifests as progressive inflammatory demyelination leading to neurological function loss and early death.
Early allo-HSCT stabilizes cerebral adrenoleukodystrophy progression; TRM remains high, even with improved regimens and supportive care.

Abstract
Allogeneic hematopoietic stem cell transplantation (allo-HSCT) in early cerebral adrenoleukodystrophy can stabilize neurologic function and improve survival but has associated risks including transplant-related mortality (TRM), graft failure, and graft-versus-host disease (GVHD). An observational study of 59 patients with median age at allo-HSCT of 8 years addressed impact of donor source, donor match, conditioning regimen, and cerebral disease stage on first allo-HSCT outcomes. Efficacy analyses included 53 patients stratified by disease category: advanced disease (AD; n = 16) with Loes score >9 or neurological function score (NFS) >1 and 2 early disease (ED) cohorts (ED1 [Loes ≤4 and NFS ≤1; n = 24] and ED2 [Loes >4-9 and NFS ≤1; n = 13]). Survival free of major functional disabilities and without second allo-HSCT at 4 years was significantly higher in the ED (66%) vs AD (41%) cohort (P = .015) and comparable between ED1 and ED2 cohorts (P = .991). The stabilization of neurologic function posttransplant was greater in the ED vs AD cohort, with a median change from baseline at 24 months after allo-HSCT in NFS and Loes score, respectively, of 0 and 0.5 in ED1 (n = 13), 0.5 and 0 in ED2 (n = 6), and 2.5 and 3.0 (n = 4) in AD cohort. TRM was lower in the ED (7%) compared with the AD (22%) cohort; however, the difference was not significant (P = .094). Transplant-related safety outcomes were also affected by transplant-related characteristics: graft failure incidence was significantly higher with unrelated umbilical cord grafts vs matched related donors (P = .039), and acute GVHD and graft failure incidences varied by conditioning regimen. This study was registered at www://clinicaltrials.gov as #NCT02204904.
Introduction
Adrenoleukodystrophy (ALD) is a rare X-linked metabolic disorder resulting from ABCD1 gene mutations with an estimated incidence of 1/20 000 to 1/30 000 males.1,2 Mutations lead to deficiency of the peroxisomal membrane ALD protein important in transporting very long chain fatty acids to the peroxisome for degradation, causing their accumulation in tissues and plasma.3,4 The most severe, cerebral form (CALD) develops in∼35% of males ≤10 years of age with ALD.3 If not treated in a timely manner, inflammatory cerebral demyelination in CALD leads to loss of neurological and cognitive function and death, typically in early childhood.5 Neurologic progression of CALD may manifest as major functional disabilities (MFDs), including loss of communication, movement, and mobility; blindness; tube feeding dependence; and incontinence.6,7
Allogeneic hematopoietic stem cell transplantation (allo-HSCT) has become the standard of care with the potential to stabilize neurological function if performed early in the disease process.5,7-9 The pretransplant radiologic assessment of white matter changes quantitated by Loes score10-12 correlates with posttransplant outcomes, with improved results in patients without baseline neurologic deficits and Loes scores <10.7,9
Transplant-related variables, including donor type, hematopoietic stem cell (HSC) source and conditioning regimen may also influence outcomes. Although allo-HSCT is ideally performed using HSCs from HLA-matched related donors (MRDs), such donors are unavailable in the majority of cases.7,9 In the absence of MRDs, grafts from unrelated sources, including adult unrelated donors, unrelated umbilical cord blood (UCB),13 or haploidentical donors14 have been successfully used for CALD. The conditioning regimen choice can influence transplant-related morbidity, and although busulfan (Bu) remains the favored myeloablative agent in most centers, more recently fludarabine (Flu) has replaced cyclophosphamide (Cy) in attempts to reduce toxicity.15 However, reduced-toxicity conditioning regimens may be associated with a higher cumulative incidence of graft failure.16 Moreover, other transplant-related complications, such as infections, and acute and chronic graft-versus-host disease (GVHD) can reduce survival and affect quality of life of children during and after allo-HSCT.7,9,13,17
To explore how CALD stage and transplant variables affect safety and efficacy outcomes of allo-HSCT in children with CALD treated with current protocols, we performed an international multicenter observational study.
Methods
Study design
This was an international, prospective and retrospective data collection (January 2013-December 2019) of allo-HSCT in males with CALD (NCT02204904). Fifteen centers with extensive experience in allo-HSCT for CALD participated.
The study protocol was reviewed and approved by the relevant institutional review boards/ethics committees. All participants/caregivers provided written informed consent.
Patient population
Boys ≤17 years of age diagnosed with CALD based on abnormal very long chain fatty acid profiles and cerebral demyelination per initial/local site reading of brain magnetic resonance imaging (MRI) scans were eligible if scheduled for allo-HSCT at a participating study site. Retrospective enrollment included those who had already received an allo-HSCT ≥January 1, 2013, and were able to complete a 24-month visit or for whom posttransplant data were available (some died before study start).
CALD stage was characterized by baseline Neurologic Function Score (NFS) for clinical symptoms12 and baseline Loes score (range, 0-34)10 for quantitation of white matter involvement on MRI. There were 2 early disease (ED) cohorts, ED1 (NFS ≤1 and Loes score ≤4) and ED2 (NFS ≤1 and Loes score >4-9), and an advanced disease (AD) cohort (NFS >1 or Loes score >9).
Data including time from ALD diagnosis to allo-HSCT, time from CALD diagnosis to allo-HSCT, donor HSC source, donor type, donor-recipient HLA matching, and conditioning regimen are from the first allo-HSCT period. Donor HSC source and type was grouped into MRD or unrelated donor (from bone marrow [BM], peripheral blood [PB], or UCB). Donor match was stratified as matched or haploidentical/mismatched using conventional matching practices for relevant HLAs within each HSC source. For UCB grafts, match criteria were 4-6/6 HLA-A,-B antigen low-resolution typing and HLA-DRB1 alleles high-resolution typing.18
Efficacy endpoints
Efficacy endpoints after first allo-HSCT included overall survival (OS), and survival without second allo-HSCT or MFDs (referred to as MFD-free survival), determined throughout the study, including at 24 and 48 months.
Additional endpoints included NFS, Loes scores, and gadolinium enhancement (GdE) status assessed at baseline and posttreatment. Loes scores and GdE status (GdE+ or GdE−) of cerebral lesions were determined from MRI scans (performed locally for eligibility and centrally at baseline and for longitudinal assessment).
Efficacy analyses were stratified by ED1, ED2, and AD cohorts. Exploratory analyses were done for a subset of patients from the overall cohort who met eligibility criteria for studies ALD-102 (NCT01896102) and ALD-104 (NCT03852498) (lentiviral vector [LVV]-based ex vivo HSC gene therapy for CALD subjects with baseline Loes score ≥0.5-≤9, NFS ≤1, and GdE+ status), called the gene therapy-matched cohort.
The efficacy population excluded patients for whom MRI assessments by an experienced neuroradiologist central reader established that Loes scores were 0 at baseline and there either was no follow-up Loes scores or they remained 0 posttransplant (supplemental Table A). Patients lacking a central radiologist’s reading of baseline Loes score and/or NFS assessment enabling unambiguous assignment to a disease stage cohort were excluded from efficacy analysis stratified by disease state.
Safety endpoints
Primary safety determinations assessed transplant-related outcomes and included incidence of transplant-related mortality (TRM, defined as death from any transplantation-related cause other than disease progression).
The incidence of graft failure/rejection (referred subsequently as graft failure) was classified as primary (based on lack of achieving neutrophil engraftment; defined as inability to achieve 3 consecutive absolute neutrophil counts ≥0.5 × 10⁹cells/L by 42 days after allo-HSCT), or secondary (based on loss of neutrophil engraftment or investigator assigned-graft rejection by 24 months posttransplant). Graft failure was not defined by a prespecified threshold for the percent donor chimerism. The decision-making approach regarding second allo-HSCT varied across centers, with patient’s CALD status and overall health as important consideration factors.
The incidence and severity of acute GVHD (aGVHD) were reported according to the Acute GVHD Grading Scale (I-IV)19 and for chronic GVHD (cGVHD) by investigator assessment of limited and extensive cGVHD.20
Platelet engraftment was defined as achieving 3 consecutive platelet counts ≥20 × 109 cells/L without platelet transfusions in the preceding 7 days.
Posttransplant serious adverse events were collected throughout the study after first allo-HSCT. Safety assessments included infection frequency and severity, intensive care unit stays and duration, and inpatient hospitalizations and duration.
Safety assessments were stratified by donor cell source, type and match, and conditioning regimen (Bu/Cy and Bu/Flu).
Analyses
Patient and transplant characteristics were expressed as number and percentage for categorical variables and median with ranges for continuous variables.
Time of origin in time-to-event analyses was the first allo-HSCT and patients alive without an event were censored at the last follow-up or at the time of study termination. The Kaplan-Meier method was used to estimate survival rates and associated 2-sided 95% confidence intervals (CIs).21 Hazard ratios with 95% CIs were provided from the univariate Cox model and P values comparing subgroups were calculated from the log-rank test.
Cumulative incidence function (CIF) estimates22 from a cause-specific hazard model were determined for TRM (competing event of death from other causes), GVHD (including all acute grade ≥2 and cGVHD); competing events of graft failure and death, and graft failure (competing event of death). Exploratory analyses stratified outcomes by N-acetylcysteine (NAC) use. The cause-specific hazard model was used to calculate hazard ratio with 95% CI. The subgroups were compared using P values calculated from Gray’s test. P values were not part of a prespecified analysis, and no correction was done for multiple testing.
Results
Characteristics of patients and transplants
Fifty-nine patients were enrolled at 15 centers, including 5 centers in the United States (n = 36); 2 centers each in the United Kingdom (n = 5), Germany (n = 7), and the Netherlands (n = 5); and 1 center each in Argentina (n = 2), Italy (n = 2), France (n = 1), and Spain (n = 1). Patient and transplant characteristics are shown in Table 1. Twenty-six patients were enrolled before allo-HSCT (prospective), 26 were enrolled posttransplant but before the 24-month visit (retrospective or partially retrospective), and 7 patients that died posttransplant before the study commenced were enrolled retrospectively. Study populations are summarized in supplemental Figure A. The efficacy population included 55 patients (4 were excluded because baseline Loes scores were 0 and either had no follow-up, or all follow-up Loes scores were 0) and efficacy analyses stratified by disease state included 53 patients (2 additional patients were excluded, given missing baseline NFS or central readings of baseline Loes score). Individual patient disease and transplant characteristics are listed in supplemental Table A.
Patient baseline disease and transplant characteristics
| ED1 n = 26 | ED2 n = 13 | ED1 + ED2 n = 39 | AD n = 16 | All patients N = 59 | |
|---|---|---|---|---|---|
| Median (min-max) | |||||
| Age at CALD dx, y | 7 (0-14) | 7 (5-11) | 7 (0-14) | 8 (6-12) | 7 (0-14) |
| Age at first allo-HSCT, y | 7 (2-14) | 8 (5-11) | 8 (2-14) | 9 (6-13) | 8 (2-14) |
| Time from ALD dx to CALD dx, mo | 30.8 (0-125) | 0.2 (0-111.2) | 9.8 (0-125) | 0.03 (0-48.2) | 0.8 (0-125) |
| Time from ALD dx to transplant, mo | 45.0 (2.8-152.2) | 4.4 (0.8-113.2) | 25.3 (0.8-152.2) | 3.5 (1.1-99.5) | 9.4 (0.8-152.2) |
| Time from CALD dx to transplant, mo | 3.6 (1.3-76.3) | 3.0 (0.6-78) | 3.6 (0.6-78) | 3.4 (1.1-51.4) | 3.5 (0.6-78) |
| Length of follow-up, mo | 25.3 (0.9-49.2) | 31.2 (0.9-48.1) | 25.8 (0.9-48.1) | 8.9 (2.1-48.6) | 23.0 (0.9-49.5) |
| n (%) | |||||
| Baseline NFS 0 1 >1-≤4 >4 Missing | 26 (100) 0 0 0 0 | 12 (92.3) 1 (7.7) 0 0 0 | 38 (97.4) 1 (2.6) 0 0 0 | 5 (31.3) 5 (31.3) 4 (25.0) 1 (6.3) 1 (6.3) | 43 (72,9) 7 (11.9) 4 (6.8) 1 (1.7) 4 (6.8) |
| Baseline Loes score 0 0.5-4 >4-9 >9 Missing | 4 (15.4) 22 (84.6) 0 0 0 | 0 0 13 (100) 0 0 | 4 (10.3) 22 (56.4) 13 (33.3) 0 0 | 0 0 1 (6.3) 13 (81.3) 2 (12.5) | 6 (10.2) 22 (37.3) 15 (25.4) 13 (22.0) 7 (11.9) |
| Baseline GdE status + – Missing | 16 (61.5) 8 (30.8) 2 (7.7) | 11 (84.6) 2 (15.4) 0 | 27 (69.2) 10 (25.6) 2 (5.1) | 12 (75.0) 2 (12.5) 2 (12.5) | 39 (66.1) 13 (22.0) 7 (11.9) |
| Conditioning regimen Bu/Cy Bu/Flu Missing | 10 (38.5) 15 (57.7) 1 (3.8) | 6 (46.2) 7 (53.8) 0 | 16 (41.0) 22 (56.4) 1 (2.6) | 6 (37.5) 9 (56.3) 1 (6.3) | 25 (42.4) 32 (54.2) 2 (3.4) |
| Donor source MRD (BM+PB+UCB) UR (BM+PB) UR (UCB) Haploidentical | 7 (26.9) 9 (4.6) 10 (38.5) 0 (0) | 4 (30.8) 5 (38.5) 4 (30.8) 0 (0) | 11 (28.2) 14 (35.9) 14 (35.9) 0 (0) | 1 (6.3) 4 (25.0) 6 (37.5) 5 (31.3) | 12 (20.3) 19 (32.2) 23 (39.0) 0 (0) |
| Donor match Matched Haplo+mismatched | 20 (76.9) 6 (23.1) | 9 (69.2) 4 (30.8) | 29 (74.4) 10 (25.6) | 6 (37.5) 10 (62.5) | 36 (61.0) 23 (39.0) |
| HLA match type Matched 10/10 8/8 6/6 Mismatched 9/10 5/6 4/6 Haploidentical | 8 (30.8) 6 (23.1) 6 (23.1) 1 (3.8) 3 (11.5) 2 (7.7) 0 | 4 (30.8) 4 (30.8) 1 (7.7) 1 (7.7) 2 (15.4) 1 (7.7) 0 | 12 (30.8) 10 (25.6) 7 (17.9) 2 (5.1) 5 (12.8) 3 (7.7) 0 | 3 (18.8) 1 (6.3) 2 (12.5) 1 (6.3) 1 (6.3) 3 (18.8) 5 (31.3) | 16 (27.1) 11 (18.6) 9 (15.3) 3 (5.1) 7 (11.9) 8 (13.6) 5 (8.5) |
dx, diagnosis; UR, unrelated donor.
The median (range) duration of follow-up after first allo-HSCT was 23.0 months (0.9-49.5). The median (range) age at CALD diagnosis was 7 years (0-14). The median ALD-to-CALD diagnosis time was <1 month in the ED2 (0-111.2) and AD cohorts (0-48), and 30 months (0-125) in the ED1 cohort. The time from CALD diagnosis to allo-HSCT was a median 3.5 months (range, 0.6-78) and did not differ across cohorts.
Baseline NFS was 0 or 1 in 50/59 patients (85%). Fifty-two patients (88%) had available baseline GdE status and 39/52 (75%) were GdE+. The distribution of centrally read baseline Loes scores is shown in Table 1.
The most common conditioning regimen was Bu/Flu (54%), followed by Bu/Cy (42%), without significant differences between ED and AD cohorts. Two patients had missing regimen information. No systemic exposure data for Bu were available, but Bu was administered with myeloablative intent. Granulocyte-colony stimulating factor was administered per institutional guidelines, and was received during the first allo-HSCT period by 25/59 patients (42%), including 18 who had UCB donors.
In the ED cohort, MRD grafts were used in 11/39 cases (28%) and unrelated donors in 28/39 cases (72%; 14 from BM+PB and 14 from UCB). Conversely, only 1 patient with AD (1/16, 6%) received an MRD graft. Five patients with AD (5/16, 31%) had transplants from haploidentical donors. Matched donors were used for 74% and 38% of patients with ED and AD, respectively.
OS and TRM and toxicity
Forty-four of 55 patients (80%) included in OS analyses were alive at last follow-up; 4-year OS (95% CI) Kaplan-Meier estimate was 72.1% (54.4-83.8) (Figure 1; Table 2). OS was significantly higher in the ED (81.9%, 57.8-93.0) vs AD (53%, 23.3-75.9) cohort (P = .008).
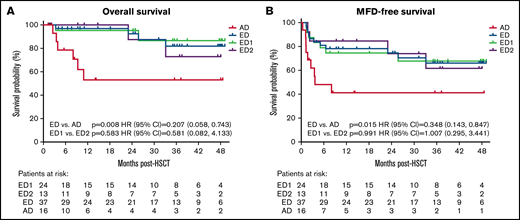
Kaplan-Meier analyses of overall survival (A) MFD-free survival and (B) by disease severity cohorts. Time of origin was the first allo-HSCT and patients alive without an event were censored at the last follow-up or at the time of study termination. MFD-free survival included survival without second allo-HSCT or major functional disabilities (MFDs).
Kaplan-Meier analyses of overall survival (A) MFD-free survival and (B) by disease severity cohorts. Time of origin was the first allo-HSCT and patients alive without an event were censored at the last follow-up or at the time of study termination. MFD-free survival included survival without second allo-HSCT or major functional disabilities (MFDs).
Effects of disease stage, donor source, donor match, and conditioning regimen on survival and transplant-related outcomes
| Survival rate (95% CI) Month 48 | CIF Estimate % (95% CI) Month 24* | ||||||||
|---|---|---|---|---|---|---|---|---|---|
| OS | MFD-free | Grade II-IV aGVHD | Grade III-IV aGVHD | Limited cGVHD | Extensive cGVHD | Overall cGVHD | TRM | Graft failure/rejection | |
| All | 20.5 (11.2-31.7) | 13.7 (6.3-23.9) | 13.3 (5.7-24.2) | 7.6 (2.4-17.0) | 16.7 (8.1-27.9) | 14.8 (6.3-26.6) | 17.0 (8.7-27.7) | ||
| Disease stage | |||||||||
| ED1 | 86.6 (53.9-96.7) | 67.8 (43.0-83.6) | 15.4 (4.7-31.9) | 11.5 (2.8-27.2) | 20.6 (7.2-38.8) | 8.2 (1.3-23.6) | 24.6 (9.6-43.2) | 4.3 (0.3-18.7) | 27.1 (11.7-45.2) |
| ED2 | 72.9 (27.6-92.5) | 61.7 (25.6-84.3) | 15.4 (2.2-40.1) | 7.7 (0.4-30.5) | NE (NE-NE) | 9.4 (0.4-35.9) | 9.4 (0.4-35.9) | 12.5 (0.5-44.5) | 15.4 (2.2-39.8) |
| ED | 81.9 (57.8-93.0) | 66.1 (46.3-80.0) | 15.4 (6.1-28.5) | 10.3 (3.2-22.2) | 13.6 (4.8-27.0) | 8.5 (2.1-20.8) | 19.3 (8.3-33.7) | 7.0 (1.1-20.5) | 23.2 (11.3-37.4) |
| AD | 53.0 (23.3-75.9) | 41.3 (17.3-63.9) | 25.6 (7.4-49.0) | 13.0 (1.9-34.8) | 12.4 (0.4-45.7) | 7.4 (0.4-29.6) | 7.4 (0.4-29.6) | 22.1 (4.9-47.1) | 6.3 (0.4-25.5) |
| ED vs AD | |||||||||
| P value | .008 | .015 | .423 | .815 | .539 | .949 | .304 | .094 | .153 |
| HR (95% CI) | 0.207 (0.058-0.743) | 0.348 (0.143-0.847) | 0.673 (0.190-2.388) | 0.935 (0.171-5.113) | 1.729 (0.200-14.910) | 0.890 (0.091-8.734) | 2.634 (0.323-21.502) | 0.214 (0.035-1.317) | 3.847 (0.487-30.372) |
| ED1 vs ED2 | |||||||||
| P value | .583 | .991 | .963 | .703 | .091 | .962 | .212 | .604 | .484 |
| HR (95% CI) | 0.581 (0.082-4.133) | 1.007 (0.295-3.441) | 1.096 (0.201-5.991) | 1.639 (0.170-15.775) | >1000 (0.000-> 1000) | 1.121 (0.102-12.374) | 4.472 (0.537-37.258) | 0.489 (0.031-7.819) | 1.743 (0.362-8.399) |
| Donor source† | |||||||||
| MRD | 67.3 (27.7-88.5) | 67.3 (27.7-88.5) | 16.7 (2.3-42.5) | 16.7 (2.3-42.5) | 10.1 (0.4-37.9) | 10.1 (0.4-37.9) | 20.2 (2.6-49.6) | 19.2 (2.5-47.6) | NE (NE-NE) |
| UR BM+PB | 76.0 (40.4-92.0) | 68.1 (37.5-86.0) | 15.8 (3.7-35.6) | 10.5 (1.6-29.1) | 16.8 (3.8-37.9) | 11.4 (1.7-31.5) | 22.2 (6.3-43.9) | 5.6 (0.3-23.1) | 15.8 (3.7-35.5) |
| UR UCB | 78.3 (46.5-92.5) | 49.5 (26.5-68.9) | 26.1 (10.2-45.3) | 17.4 (5.2-35.6) | 13.4 (3.1-31.4) | 4.3 (0.3-19.0) | 13.0 (3.0-30.5) | 24.1 (7.0-46.7) | 30.4 (13.2-49.8) |
| UR BM+PB+UCB | 78.4 (57.4-89.8) | 59.1 (41.2-73.2) | 21.4 (10.5-35.0) | 14.3 (5.7-26.7) | 15.3 (6.0-28.6) | 7.5 (1.9-18.5) | 17.1 (7.3-30.2) | 14.5 (5.2-28.4) | 23.8 (12.2-37.6) |
| UR BM+PB+UCB vs MRD | |||||||||
| P value | .660 | .348 | .827 | .713 | .732 | .827 | .857 | .769 | .068 |
| HR (95% CI) | 0.733 (0.183-2.940) | 1.796 (0.519-6.214) | 1.434 (0.310-6.642) | 0.910 (0.184-4.510) | 2.005 (0.240-16.780) | 1.103 (0.114-10.628) | 1.208 (0.249-5.850) | 0.787 (0.152-4.070) | >1000 (0.0-NE) |
| UR BM+PB vs MRD | |||||||||
| P value | .784 | .743 | .880 | .558 | .694 | .880 | .852 | .380 | .155 |
| HR (95% CI) | 1.252 (0.251-6.259) | 1.271 (0.302-5.358) | 0.938 (0.157-5.619) | 0.609 (0.086-4.321) | 1.866 (0.193-18.038) | 1.518 (0.138-16.751) | 1.463 (0.266-8.051) | 0.364 (0.033-4.063) | >1000 (0.0-NE) |
| UR UCB vs MRD | |||||||||
| P value | .713 | .162 | .637 | .910 | 842 | 0.572 | .624 | .784 | .039 |
| HR (95% CI) | 0.741 (0.149-3.682) | 2.441 (0.670-8.887) | 1.863 (0.375-9.251) | 1.153 (0.211-6.302) | 1.959 (0.202-18.986) | 0.761 (0.047-12.281) | 1.004 (0.166-6.068) | 1.266 (0.231-6.930) | >1000 (0.0-NE) |
| UR UCB vs UR BM+PB | |||||||||
| P value | .862 | .159 | .450 | .562 | .698 | .433 | .450 | .156 | .255 |
| HR (95% CI) | 1.153 (0.232-5.734) | 2.130 (0.726-6.247) | 1.941 (0.485-7.767) | 1.851 (0.339-10.108) | 0.954 (0.192-4.736) | 0.494 (0.045-5.464) | 0.703 (0.157-3.145) | 4.297 (0.480-38.503) | 2.128 (0.550-8.231) |
| Match status | |||||||||
| Matched | 80.9 (58.9-91.9) | 75.7 (54.8-87.9) | 14.0 (5.0-27.5) | 11.2 (3.5-24.0) | 11.9 (3.7-25.3) | 6.1 (1.0-18.0) | 18.0 (7.1-32.9) | 12.8 (3.9-27.3) | 11.3 (3.5-24.2) |
| Haplo+mismatched | 51.3 (21.0-75.2) | 30.0 (11.4-51.3) | 30.4 (13.0-50.0) | 17.4 (5.2-35.6) | 17.0 (3.6-39.0) | 10.3 (1.5-29.2) | 15.0 (3.3-34.9) | 19.5 (4.4-42.6) | 26.1 (10.3-45.2) |
| Haplo+mismatched vs Matched | |||||||||
| P value | .063 | .0001 | .157 | .5747 | .882 | .624 | .653 | .596 | .108 |
| HR (95% CI) | 2.949 (0.893-9.744) | 5.075 (2.035-12.66) | 2.769 (0.877-8.744) | 1.772 (0.443-7.088) | 1.531 (0.337-6.959) | 2.485 (0.342-18.039) | 0.969 (0.239-3.931) | 1.598 (0.355-7.192) | 2.720 (0.767-9.651) |
| Conditioning regimen | |||||||||
| Bu/Flu regimen | 81.6 (57.8-92.8) | 60.1 (40.3-75.1) | 6.4 (1.1-18.8) | 3.3 (0.2-14.6) | 9.9 (2.4-23.9) | 3.4 (0.2-15.3) | 13.4 (4.1-28.3) | 9.2 (1.4-26.0) | 25.1 (11.6-41.2) |
| Bu/Cy regimen | 64.7 (36.6-82.8) | 57.3 (31.2-76.6) | 36.0 (17.7-54.7) | 24.0 (9.5-42.1) | 19.2 (5.5-39.1) | 13.4 (3.1-31.2) | 21.9 (7.5-41.1) | 17.5 (5.3-35.7) | 8.0 (1.3-22.9) |
| Bu/Flu vs Bu/Cy | |||||||||
| P value | .365 | .649 | .006 | .020 | .476 | .173 | .431 | .342 | .089 |
| HR (95% CI) | 0.562 (0.158-1.993) | 1.231 (0.502-3.015) | 0.168 (0.036-0.778) | 0.138 (0.017-1.146) | 0.702 (0.156-3.151) | 0.257 (0.027-2.490) | 0.698 (0.186-2.617) | 0.459 (0.084-2.511) | 3.492 (0.741-16.452) |
Deaths, MFDs, and second allo-HSC infusions are considered events for MFD-free survival outcome. MFDs included loss of communication, cortical blindness, tube feeding dependence, total incontinence, wheelchair dependence, and complete loss of voluntary movement. Patients who did not experience any event are censored at the time of the last MFD assessment when they are MFD-free. Survival rates estimated using Kaplan-Meier analysis. HR (95% CI) for survival rates calculated by Cox proportional hazards model. P values for survival analyses from log-rank test; underlining and italics denote P values < 0.05 and 0.05-0.1, respectively. Bold numbers indicate a P value that is statistically significant.
HR (95% CI) for cumulative incidence functions (CIF) estimates from a cause-specific hazard model. P values are calculated using competing risks analysis calculated by Gray’s test.
NE, not estimable; UR, unrelated.
Same as at month 48.
Haploidentical category (donor source) = 5 patients had allo-HSCT using haploidentical donors, but all had <24 months of follow-up after allo-HSCT; therefore, data as of month 24 or month 48 were not available.
In the gene therapy-matched cohort (n = 27; patient and treatment characteristics described in supplemental Table B), the estimated 4-year OS was 77.8% (45.5-92.3) (supplemental Figure B; supplemental Table C) and was similar in those with matched sibling donors (n = 10, 74.1% [28.9-93.0]) or other donors (n = 17, 83.3% [27.3-97.5]), respectively (hazard ratio 1.65 [0.15-18.35]).
There was no difference in OS in the ED or AD cohorts stratified by NAC use. However, the small numbers of patients (in AD, 12 with NAC and 4 without) limited the assessment.
Eleven patients in the efficacy population (n = 55) died during the first allo-HSCT period because of disease progression (n = 2), cardiac arrest (n = 1), and unknown causes (n = 2). The remaining deaths were characterized as TRM and attributed to aGVHD (n = 3), cGVHD (n = 1), conditioning toxicity (n = 1), and immunosuppression secondary to drugs for posttransplant management (n = 1; cause of death listed as fatal respiratory failure caused by cytomegalovirus viremia and Epstein-Barr viremia). Two TRM-attributed deaths occurred in patients with MRD transplants (from conditioning toxicity [n = 1] and cGVHD [n = 1]). One additional patient from the overall treated population (N = 59) died (TRM from aGVHD).
The CIF (95% CI) of TRM at 24 months was 14.8% (6.3-26.6), without significant differences across transplant characteristics (Table 2). There was a trend for increased TRM in the AD (22%) vs ED (7%) cohort (P = .09). TRM and other transplant-related outcomes in the gene therapy-matched cohort were comparable to the ED cohort (supplemental Table C).
The majority of patients had at least 1 serious adverse event (43/59, 73%); those occurring in ≥2 patients are described in Table 3. One patient experienced veno-occlusive disease attributed to the Bu/Cy conditioning regimen. Data for hospitalizations and intensive care unit stays are shown in Table 4. The initial hospitalization data for allo-HSCT were available for 59 patients, with a median (min-max) duration of 51 (25-240) days.
Incidence and timing of serious adverse events* occurring in 2 or more patients
| D1 to <NE (N = 59) n (%) | NE to M12 (N = 53) n (%) | >M12 to M24 (N = 34) n (%) | >M24 to M48 (N = 29) n (%) | D1 to M24 (N = 59) n (%) | D1 to M48 (N = 59) n (%) | |
|---|---|---|---|---|---|---|
| Nervous system disorders | ||||||
| Neurological decompensation | 2 (3.4) | 5 (9.4) | 0 | 0 | 6 (10.2) | 6 (10.2) |
| Aphasia | 0 | 1 (1.9) | 0 | 1 (3.4) | 1 (1.7) | 2 (3.4) |
| Seizure | 0 | 1 (1.9) | 1 (2.9) | 0 | 2 (3.4) | 2 (3.4) |
| Infections and infestations | ||||||
| Device-related infection | 0 | 4 (7.5) | 0 | 0 | 4 (6.8) | 4 (6.8) |
| BK virus infection | 0 | 3 (5.7) | 0 | 0 | 3 (5.1) | 3 (5.1) |
| Bacteremia | 1 (1.7) | 2 (3.8 | 0 | 0 | 3 (5.1) | 3 (5.1) |
| Staphylococcal infection | 0 | 3 (5.7) | 0 | 0 | 3 (5.1) | 3 (5.1) |
| Clostridium difficile infection | 0 | 2 (3.8) | 0 | 0 | 2 (3.4) | 2 (3.4) |
| Epstein-Barr viremia | 0 | 2 (3.8) | 0 | 0 | 2 (3.4) | 2 (3.4) |
| Human herpesvirus 6 infection | 1 (1.7) | 1 (1.9) | 0 | 0 | 2 (3.4) | 2 (3.4) |
| Lung infection | 1 (1.7) | 1 (1.9) | 0 | 0 | 2 (3.4) | 2 (3.4) |
| Sepsis | 0 | 2 (3.8) | 0 | 0 | 2 (3.4) | 2 (3.4) |
| Septic shock | 0 | 1 (1.9) | 0 | 1 (3.4) | 1 (1.7) | 2 (3.4) |
| General disorders and administration site conditions | ||||||
| Pyrexia | 0 | 3 (5.7) | 0 | 0 | 3 (5.1) | 3 (5.1) |
| Disease progression | 0 | 2 (3.8) | 0 | 0 | 2 (3.4) | 2 (3.4) |
| Ear and labyrinth disorders | ||||||
| Hypoacusis | 0 | 2 (3.8) | 0 | 0 | 2 (3.4) | 2 (3.4) |
| Gastrointestinal disorders | ||||||
| Diarrhea | 0 | 2 (3.8) | 0 | 0 | 2 (3.4) | 2 (3.4) |
| Immune system disorders | ||||||
| Anaphylactic reaction | 1 (1.7) | 0 | 0 | 1 (3.4) | 1 (1.7) | 2 (3.4) |
| Metabolism and nutrition disorders | ||||||
| Feeding intolerance | 0 | 0 | 2 (5.9) | 0 | 2 (3.4) | 2 (3.4) |
| Renal and urinary disorders | ||||||
| Acute kidney injury | 0 | 1 (1.9) | 1 (2.9) | 0 | 2 (3.4) | 2 (3.4) |
| Respiratory, thoracic, and mediastinal disorders | ||||||
| Hemothorax | 0 | 1 (1.9) | 1 (2.9) | 0 | 2 (3.4) | 2 (3.4) |
| Respiratory failure | 0 | 2 (3.8) | 0 | 0 | 2 (3.4) | 2 (3.4) |
| Vascular disorders | ||||||
| Hypertension | 1 (1.7) | 1 (1.9) | 0 | 0 | 2 (3.4) | 2 (3.4) |
D, day 1; M, month; NE, neutrophil engraftment.
Does not include severe adverse events of hematologic events, death, or engraftment failure.
Hospitalizations and ICU stays
| First hospitalization (up to D/C)*,† N = 59 | Post-D/C to M48 (last contact) N = 58 | ||
|---|---|---|---|
| Number of inpatient hospitalizations, n (%) | |||
| 0 | 0 | 28 (48.3) | |
| 1 | 57 (96.6) | 11 (19.0) | |
| 2 | 2 (3.4) | 12 (20.7) | |
| 3 | 0 | 5 (8.6) | |
| 4 | 0 | 1 (1.7) | |
| 5 | 0 | 1 (1.7) | |
| Duration of inpatient hospitalizations (days) | |||
| n | 59 | 30 | |
| Median | 51 | 14.5 | |
| Min, max | 25, 240 | 3, 308 | |
| Number of ICU stays, n (%) | |||
| 0 | 58 (98.3) | 53 (91.4) | |
| 1 | 0 | 4 (6.9) | |
| 2 | 0 | 1 (1.7) | |
| 3 | 1 (1.7) | 0 | |
| Duration of ICU stays (days) | |||
| n | 1 | 5 | |
| Median | 52.0 | 17.0 | |
| Min, max | 52, 52 | 2, 118 | |
D/C, discharge after initial hospitalization; ICU, intensive care unit.
Starts with admission for conditioning and donor cell infusion for first transplant and ends with the first discharge after neutrophil engraftment.
Analysis includes hospitalization times for patients who did not have neutrophil engraftment after first allo-HSCT and remained in the hospital until neutrophil engraftment was obtained after second or third allo-HSCT procedures.
Donor engraftment
Neutrophil engraftment was achieved in 53/59 (89.8%) patients at a median of 17 (12-36) days. Ten patients had either primary (6/59, 10.2%) or secondary 4/53 (7.5%) graft failure, and all had received unrelated grafts. All evaluable patients (n = 47) achieved platelet engraftment at a median of 26 (13-67) days. Nine patients with primary or secondary graft failure underwent a second allo-HSCT and 1 patient had a third allo-HSCT. At last follow-up, 6/9 patients were engrafted and alive; among these, 5 were MFD-free.
Among 6 patients with primary graft failure (absolute neutrophil count-based), donor sources were mismatched UCB in 4 (67%) and matched BM in 2 (33%). Four patients, who received grafts from matched UCB (n = 1), mismatched UCB (n = 2), or mismatched PB (n = 1), had secondary graft failure. Although donor chimerism threshold was not included in the definition of graft failure, it could have been considered by investigators when assessing secondary graft failure. Donor chimerism (with cell type used for donor chimerism analysis shown in parentheses) for 4 patients with secondary graft failure at time of second allo-HSCT was 0% (BM), 24% (peripheral blood mononuclear cells), 54% (BM), and 61% (BM).
The CIF estimate (95% CI) of graft failure for all patients at 24 months was 17.0% (8.7-27.7) and was significantly lower in patients that received MRD (0/12) vs unrelated UCB transplants (7/23) (CIF: not estimable vs 30.4%, respectively; P = .039) (Table 2). Although not significant, a trend (P = .09) was noted related to the conditioning regimen, where fewer patients receiving Bu/Cy (2/25; 8%) had graft failure vs those receiving Bu/Flu (8/32; 25%).
Survival free of graft failure or MFDs (MFD-free survival)
The 4-year MFD-free survival for 55 patients was 58.1% (95% CI, 42.6-70.8) (Figure 1B; Table 2) and was significantly higher in the ED (66.1%; 95% CI, 46.3-80.0) vs AD group (41.3%; 95% CI 17.3-63.9) (P = .015). Primary events were death and graft failure for the ED group, and death and MFDs for the AD group. The baseline NFS for patients developing MFDs was 0 to 5 (2 with 0, 1 with 1, and 3 with ≥2) and baseline Loes 6 to 18.5 (1 with 6, 4 with ≥10, and 1 missing). (supplemental Table A). All 5 with available GdE data at baseline were GdE+. One of the 6 with MFDs had primary graft failure (as determined by treating physician; also noted to have 0% donor chimerism in blood). The remaining 4 patients had >90% donor chimerism (2 in myeloid cells, 1 in blood, and 1 in peripheral blood mononuclear cells), whereas 1 patient had blood donor chimerism of 97% at 12 months after treatment and 0% shortly thereafter. This patient was alive at last follow-up (48 months posttreatment). Two additional patients with MFDs were alive at study termination. All MFDs occurred between days 12 and 111 and are described in detail in Appendix 1.
Among 7 patients with AD who did not die or develop MFDs, the baseline NFS ranged from 0 to 3 (2 with 0, t3 with 1, and 2 with ≥2), Loes from 11 to 16 (4 with 11, 2 ≥ 13, and 1 missing) and 4/6 with GdE status at baseline were GdE+ (supplemental Table A). Among these 7 patients with available follow-up Loes scores and NFS, the NFS change from baseline to the last visit ranged from −2 to 5 (n = 6; 5 with ≤1), whereas the change in Loes score ranged from −1 to 4 (n = 6; 5 with ≤3). Narratives of the NFS components over time for the 5 patients with AD with NFS at last visit ≤2 are provided in Appendix 2.
In the gene therapy-matched cohort (n = 27), the estimated 4-year MFD-free survival was 63.2% (38.2-80.4) because of second transplant and death (none of these patients developed MFDs) (supplemental Figure B; supplemental Tables A and C). There was no significant difference between the recipients of matched sibling grafts (74.1% [28.9-93.0]; n = 10) vs other donor types (58.8% [27.5-80.4]; n = 17).
Neurological outcome
The median change from baseline in Loes score and NFS over time are shown in Figure 2A-B stratified by disease stage and in supplemental Figure C for the gene therapy-matched cohort. For both parameters, there were limited changes from baseline in the ED1 cohort and greater variability in the ED2 and AD cohorts. Individual patient data over time are shown in Figure 2C-D with outcomes of MFD and death indicated.
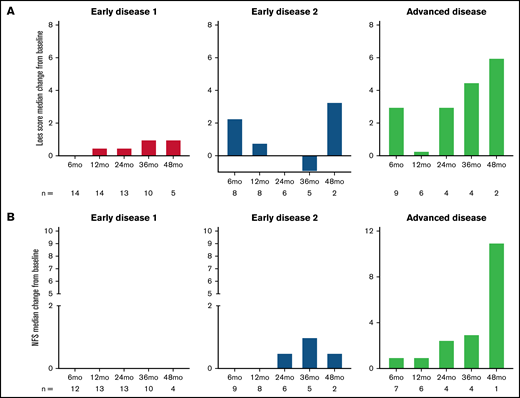
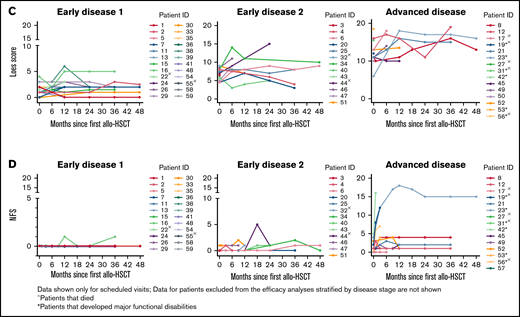
Loes score and Neurological Function Score (NFS) over time. Median change from baseline by disease stage is shown for Loes score (A) and NFS (B). Number of evaluable patients at each time point are shown below the x-axis (data availability for each patient at each visit was influenced by a number of factors, including the survival status, retransplantation status, length of follow-up, whether the visit took place, and whether the assessment was performed). (C-D) Individual patient Loes scores and NFS by disease stage.
Loes score and Neurological Function Score (NFS) over time. Median change from baseline by disease stage is shown for Loes score (A) and NFS (B). Number of evaluable patients at each time point are shown below the x-axis (data availability for each patient at each visit was influenced by a number of factors, including the survival status, retransplantation status, length of follow-up, whether the visit took place, and whether the assessment was performed). (C-D) Individual patient Loes scores and NFS by disease stage.
Figure 3 shows the kinetics of gadolinium enhancement on the brain MRI pre-HSCT and at different time points after transplant. Among 39 patients who were GdE+ at baseline, 30 had follow-up data after allo-HSCT. Resolution of GdE+ at last visit was observed in 29/30 (97%) patients (Figure 3). Overall, there was no correlation between GdE status or GdE reemergence and clinical status or cerebral progression posttransplant. One patient in the ED1 group who was GdE+ at the 1-month assessment had a second allo-HSCT from graft failure. Among 33 patients with at least 6 months of follow-up, GdE+ transiently reemerged in 1 patient GdE− at baseline and 3 GdE+ at baseline (1 patient each in ED1 and ED2 and 2 in AD). None of these patients had primary or secondary engraftment failure. One patient in the AD cohort with transient reemergence at 12 months and resolution at 24 months had baseline Loes pattern that was described as frontal (Loes score = 6 and NFS = 4) and developed 4 MFDs posttreatment (supplemental Material; patient 23). Both the NFS and Loes score increased to 18 at 12 months. For the remaining 3 patients with transient GdE+ reemergence, changes from baseline to final readings for Loes score ranged from −1 to 4.5, and NFS ≤1 for ED1 and ED2 patients and 4 for the patient with AD.
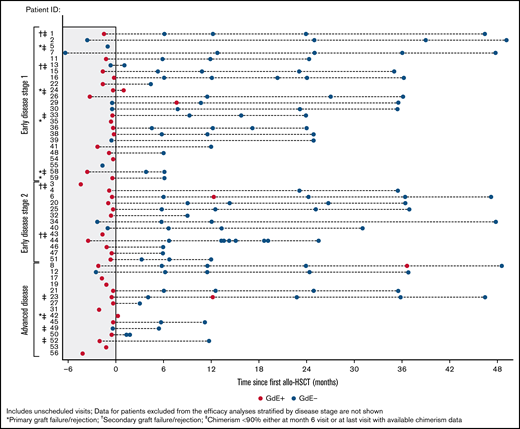
Gadolinium enhancement (GdE) status over time. Results for individual patients are stratified by disease severity. Patients with graft failure/rejection or chimerism <90% are indicated.
Gadolinium enhancement (GdE) status over time. Results for individual patients are stratified by disease severity. Patients with graft failure/rejection or chimerism <90% are indicated.
GVHD
The overall CIF estimate (95% CI) of grade II-IV and grade III-IV aGVHD at 24 months was 20.5% (11.2-31.7) and 13.7% (6.3-23.9), respectively. The CIF estimates of limited and extensive cGVHD at 24 months was 13.3% (5.7-24.2) and 7.6% (2.4-17.0), respectively, and cumulative incidence of overall cGVHD was 16.7% (8.1-27.9). Differences in cumulative incidence across donor type and match were not statistically significant (Table 2). For grade II-IV and III-IV, the aGVHD cumulative incidence was significantly higher in patients who received Bu/Cy compared with Bu/Flu conditioning regimens (P = .006 and 0.02, respectively) (Table 2). There were no apparent differences in donor graft source that might confound this finding.
Among patients receiving Bu/Flu or Bu/Cy conditioning regimens, serotherapy use was similar (25/32 [78%] and 17/25 [68%], respectively). Grade II-IV aGVHD occurred in 13/59 (22%) patients, 8 of whom were among 25 patients who received granulocyte-colony stimulating factor.
Discussion
This large, international, primarily prospective study assessed outcomes after the first allo-HSCT in patients with CALD stratified by disease stage and transplant-related variables. The results provide an important supplement to other published reports on the safety and outcomes profile of allo-HSCT treatment of CALD.7,9,13,17,23 These data will also provide an important context for the clinical studies of LVV-based HSC gene therapy for CALD, for which interim phase 2/3 study data have been reported6 and a completed phase 2/3 study manuscript is in preparation.
The study confirms that outcomes following allo-HSCT are dependent on disease stage based on baseline neuroimaging and neurological function. Baseline Loes scores <9 (with parietal-occipital demyelination pattern in most of the patients) have been shown to be associated with better posttransplant survival,17 although Loes scores ≥4.5 may be associated with worse neuropsychological outcomes after allo-HSCT compared with those with Loes scores <4.5.24 Patients in the 2 ED cohorts in our study compared with the AD cohort experienced improved OS and MFD-free survival as well as a greater stabilization of neurologic function based on NFS. By demonstrating that early intervention in CALD leads to more favorable disease-related outcomes, this study emphasizes the importance of newborn screening for ALD, which will prove critically important in establishing an early diagnosis and providing an opportunity for consistent monitoring to identify patients developing cerebral disease.25,26 Although inclusion of ALD into newborn screening panels has been gaining momentum in the United States in recent years, at this time this life-saving diagnostic method has been adopted by fewer than one-half of the US states and no European countries.27-30 Additionally, while increasing efforts to support the earlier diagnosis of ALD, there should also be focus on standardizing approaches for scoring demyelinating lesions to ensure that appropriate patients are treated with allo-HSCT. Among 7 deaths from TRM after first transplant (N = 59), 2 occurred with MRD transplants (n = 12). In our study, aGVHD was the leading cause of TRM (4 cases). Previous work suggested that severe aGVHD is associated with rapid clinical deterioration in patients with CALD.17 The risk of development of grade II-IV or grade III-IV aGVHD in our study was significantly greater (three- to eightfold higher) with a Bu/Cy vs Bu/Flu conditioning regimen. Conversely, a single-center retrospective study of allo-HSCT in 99 pediatric patients with inherited metabolic disorders, including 43 with CALD, demonstrated that Bu/Cy and Bu/Flu were associated with a similar incidence of grade III-IV aGVHD (9% and 6%, respectively).16 In the same study, Bu/Flu was used in most transplants with unrelated umbilical cord grafts and led to a higher rate of graft failure compared with Bu/Cy (29% vs 14%, P = .08),16 which is similar to our study where we noted a trend (∼threefold difference in risk) for increased graft failure in patients receiving Bu/Flu vs Bu/Cy. Based on other studies, Bu/Cy is considered more myeloablative, and more toxic, than Bu/Flu.15,31 A limitation of our study was the lack of data regarding therapeutic Bu dose monitoring, although the doses administered were assumed to be myeloablative. Because targeting a myeloablative Bu area under the curve is critical to achieve full donor engraftment,32 it is possible that Bu underexposure might have contributed to these results. We also observed increased graft failure risk with the use of unrelated umbilical cords compared with the use of a graft from an MRD.
MFD-free survival was significantly higher for matched transplants vs haploidentical/mismatched transplants. Patients receiving haploidentical/mismatched transplants were more likely to undergo a second allo-HSCT or to develop MFDs. Overall, haploidentical/mismatched transplants were used in the majority of patients with AD (63%), possibly because of the time required to find matched donors.
Allo-HSCT is offered to patients with AD at limited number of centers. In the absence of treatment, progression in patients with AD is typically rapid and devastating, with onset of multiple MFDs, and death or vegetative state within 2 to 4 years of onset of symptoms.25 None of the 16 patients with AD treated in our study had MFDs at baseline. For 6 patients with AD who developed MFDs, they occurred <4 months posttreatment. Our study shows that neurologic disease stabilization can occur in a significant proportion of patients with AD: 7/16 (43%) patients were alive and without MFDs at last follow-up, and of these 7, 5 patients had an NFS ≤1 at last assessment. These data suggest that a subset of patients with CALD and advanced disease may benefit from allo-HSCT if a suitable donor is available. In the future, additional treatment options should be explored for these patients. Nevertheless, identifying which patients with AD will develop significant progression and/or achieve an MFD is still quite difficult to ascertain.
Although this study provides important data regarding factors affecting allo-HSCT safety and outcomes, there are several limitations to the analyses. Small numbers, with limited follow-up in some cases, prevented robust comparisons for several factors, although trends were noted. Additional differences in cell source and/or level of donor matching between the cohorts may contribute to observed effects, but the small sample size of this study precluded multivariate analysis. In addition, key endpoints, especially for the patients with ED, are neuropsychological outcomes.33 However, in this study we did not have sufficient information to include these important assessments.
In summary, patients with early cerebral disease benefit the most from allo-HSCT based on the presented data relating to achieving stabilization of neurological disease and improving overall and MFD-free survival. Early disease stages may also be associated with lower TRM. Therefore, newborn screening and MRI monitoring of those at risk will provide a crucial opportunity to identify early cerebral disease and to intervene expediently. Nevertheless, significant risks continue to be observed with allo-HSCT for CALD, which are influenced by donor source, conditioning regimen, and disease status.
Data sharing
All authors had access to primary clinical trial data that were analyzed by bluebird bio. Appropriately deidentified patient-level datasets and supporting documents may be shared following attainment of applicable marketing approvals and consistent with criteria established by bluebird bio and/or industry best practices to maintain the privacy of study participants. Requests will be evaluated on a case-by-case basis. For more information, please contact datasharing@bluebirdbio.com.
Acknowledgments
The authors thank the patients, their families, and caregivers for participating in the study. They also acknowledge staff members at all the clinical sites and thank: Danielle Pinner, Jan Chu, and Marios Kaliakatsos at Great Ormond Street Hospital for Children National Health Service Foundation Trust, London, UK; Amy Waldman, MSCE at Children’s Hospital of Philadelphia, Philadelphia, PA; Jean-Hugues Dalle at Robert Debré Hospital, Paris, France; Marc Engelen at Amsterdam University Medical Centers, Amsterdam, Netherlands; Peter van Hasselt at University Medical Center Utrecht, Utrecht, Netherlands; Pablo Longo at Hospital Universitario Austral, Buenos Aires, Argentina; Luz Uría at Hospital Universitari Vall d’Hebron, Barcelona, Spain; and Corinne Gerhardt from Princes Maxima Centrum, Utrecht, Netherlands. Rene Pierpont at University of Minnesota provided support in data interpretation.
This study was supported by bluebird bio, Inc. Medical writing and editing support for authors was provided by Iva Kronja of bluebird bio, Inc., and Patrice Ferriola of KZE PharmAssociates, who was funded by bluebird bio, Inc.
Authorship
Contribution: R.C., J.-J.B., A.T., E.M., A.C.D., and P.J.O. contributed to the conception, design, and planning of the analysis; D.J.L. interpreted magnetic resonance imaging data; A.T. contributed to data analysis; and all authors contributed to data acquisition and to critically reviewing or revising the manuscript.
Conflict-of-interest disclosure: R.C. has received consulting fees/honoraria from bluebird bio, Inc., and Orchard Therapeutics. J.-J.B. has received consulting fees from Avrobio, Advanced Clinical, Bluerock, Omeros, Takeda, and Race Oncology. S.A.J. has received consulting fees/research funding, has had equity interest, and Advisory Board membership for Orchard Therapeutics. J.-S.K. has received consulting fees/honoraria from bluebird bio, Inc., Jazz Pharmaceuticals, and Sobi, and a travel grant from Neovii. C.S., C.A.L., and D.J.L. have received consulting fees/honoraria from bluebird bio, Inc. H.M.A. has received honoraria from Takeda (and received research funding and has had Advisory Boards membership), BioMarin Pharmaceutical, Sanofi Genzyme, and PTC Therapeutics (also has received research funding). M.A. has received honoraria from bluebird bio, Inc., and Miltenyi. C.D. has been a speaker for Speaker’s Bureau for Novartis, Sobi, and Jazz Pharmaceuticals (has also received travel fees) and has received consulting fees from MSD and Novartis. E.S., A.T., and A.C.D are employees of bluebird bio, Inc, and own equity in bluebird bio, Inc. D.E.M. was an employee of bluebird bio, Inc., and owns equity in bluebird bio, Inc. P.J.O. has received clinical trial support from bluebird bio, Inc, Magenta, Immusoft, and Sanofi, and has consulting agreements with Neurogene, Avrobio, and Rocket Therapeutics. C.D., N.K., V.K.P., and N.B. declare no competing financial interests.
The current affiliation for E.M. is Passage Bio, Philadelphia, PA.
Correspondence: Paul J. Orchard, Division of Pediatric Bone Marrow Transplantation, University of Minnesota, MMC 366, 420 Delaware Street SE; Minneapolis, MN 55455; e-mail: orcha001@umn.edu.

