

Key Points
WES coupled with RNA-sequencing of a large PBL cohort reveals genetic drivers of oncogenesis in RTK-RAS, NF-kB, and JAK/STAT signaling.
The mutational landscape and SCNV data emphasize the distinctness of EBV+/EBV– PBL from both DLBCL and multiple myeloma.

Abstract
Plasmablastic lymphoma (PBL) represents a clinically heterogeneous subtype of aggressive B-cell non-Hodgkin lymphoma. Targeted-sequencing studies and a single-center whole-exome sequencing (WES) study in HIV-positive patients recently revealed several genes associated with PBL pathogenesis; however, the global mutational landscape and transcriptional profile of PBL remain elusive. To inform on disease-associated mutational drivers, mutational patterns, and perturbed pathways in HIV-positive and HIV-negative PBL, we performed WES and transcriptome sequencing (RNA-sequencing) of 33 PBL tumors. Integrative analysis of somatic mutations and gene expression profiles was performed to acquire insights into the divergent genotype–phenotype correlation in Epstein-Barr virus–positive (EBV+) and EBV– PBL. We describe a significant accumulation of mutations in the JAK signal transducer and transcription activator (OSMR, STAT3, PIM1, and SOCS1), as well as receptor tyrosine-kinase RAS (ERBB3, NRAS, PDGFRB, and NTRK) pathways. We provide further evidence of frequent perturbances of NF-κB signaling (NFKB2 and BTK). Induced pathways, identified by RNA-sequencing, closely resemble the mutational profile regarding alterations accentuated in interleukin-6/JAK/STAT signaling, NF-κB activity, and MYC signaling. Moreover, class I major histocompatibility complex–mediated antigen processing and cell cycle regulation were significantly affected by EBV status. An almost exclusive upregulation of phosphatidylinositol 3-kinase/AKT/mTOR signaling in EBV+ PBL and a significantly induced expression of NTRK3 in concert with recurrent oncogenic mutations in EBV– PBL hint at a specific therapeutically targetable mechanism in PBL subgroups. Our characterization of a mutational and transcriptomic landscape in PBL, distinct from that of diffuse large B-cell lymphoma and multiple myeloma, substantiates the pathobiological independence of PBL in the spectrum of B-cell malignancies and thereby refines the taxonomy for aggressive lymphomas.
Introduction
Plasmablastic lymphoma (PBL) is a rare and clinically aggressive large B-cell lymphoma of post-germinal center origin.1 Both immunoblastic and/or plasmablastic morphology alongside immunohistochemical features of terminal B-cell differentiation (CD79a+, MUM-1+, CD38/CD138+; CD20–, PAX5–) illustrate its biological and clinical behavior intermediate between diffuse large B-cell lymphoma (DLBCL) and multiple myeloma (MM).2-4 According to chromogenic in situ hybridization, Epstein-Barr virus (EBV)-encoded RNA is detectable in ∼70% of cases.
PBL exhibits a pronounced incidence in HIV-positive patients, although observations regarding the presence of an underlying HIV infection in ∼50% to 60% of cases partially contradict initial reports claiming a near pathognomonic association.3 The disease can indeed also occur in patients with immunodeficiency of other cause (eg, secondary to organ transplant recipients or age-related immunosenescence) but is also occasionally encountered in immunocompetent individuals.5-7 The incidence of PBL accounts for ∼2% of all lymphomas arising in patients with AIDS.7
Due to the rarity of PBL and the ongoing lack of an evidence-based standard treatment approach, resulting from a deficiency in prospectively gathered clinical data, translational research remains challenging.7,8 Compared with other aggressive B-cell lymphomas, PBL outcomes are dismal. Despite recent prognostic advances with intensified treatment approaches and alternative therapeutic options, including CD38-directed monoclonal antibody, proteasome inhibitors, and immunomodulatory treatment strategies, these are highly limited in their applicability in elderly and frail patients, warranting the need for alternative, if possible, specifically targeted therapeutic approaches.2,9,10
The most frequently detected chromosomal aberrations are low-level amplifications and/or translocations involving MYC, frequently juxtaposing MYC to the immunoglobulin heavy chain locus, present in approximately one-half of cases.11-13 Comparative genomic hybridization studies revealed a copy number variation profile, intermediate between DLBCL and MM, while favoring an association with the former.14
PBL was shown to exhibit a transcriptional profile distinct from DLBCL regarding B-cell receptor signaling and targets of the transcription factors MYC and MYB.15 Moreover, preliminary studies suggested a significant impact of EBV status on gene expression profiles affecting T-cell activation signatures and mechanisms of immune escape.16,17
Recently, in a targeted sequencing study, Garcia-Reyero et al reported on an elevated frequency of PRDM1/BLIMP1 and STAT3 mutations together with other genetic aberrations, including mutations in BRAF and NOTCH signaling.18,19 According to another targeted sequencing study that focused on a panel of oncogenes implicated in large B-cell lymphomas, the overall mutational burden in PBL was markedly low. Only 60% of patients were thus shown to harbor oncogenic mutations.19 Together with its morphologic and immunophenotypical peculiarities, this finding suggests the presence of alternative drivers of lymphomagenesis in PBL that are distinct from those associated with other aggressive B-cell lymphomas. Of note, several recent studies on the mutational landscape of PBL hinted at pervasive mutations in JAK-STAT3 and RAS-MAPK as well as noncanonical NF-κB signaling. However, these studies, including 15 cases studied by using whole-exome sequencing (WES), were exclusively investigating HIV-positive patients or PBL as a posttransplantation lymphoproliferative disease.20-22 Most recently, in an amplicon panel–based and array-based study, Ramis-Zaldivar et al23 provided a first report, investigating divergences between HIV-positive and HIV-negative cases alongside the impact of an underlying EBV infection. They observed that EBV-negative PBL cases harbored a higher mutational and copy number load and more frequent TP53, CARD11, and MYC mutations, whereas EBV-positive PBL tended to have more mutations affecting the JAK-STAT pathway.
Although previous studies have hinted at a limited number of potential genetic drivers in PBL lymphomagenesis, a comprehensive characterization of the genomic and transcriptomic landscape in a representative cohort of patients is lacking thus far. The current study combined WES and RNA sequencing (RNA-seq) of 33 PBL samples. Through the integrated analysis of mutational and gene expression data, we outline oncogenic drivers, copy number alterations, and pathway perturbations. We thus refine the molecular taxonomy of terminally differentiated B-cell malignancies and substantiate the independent role of PBL, distinct from DLBCL and MM.
Materials and methods
Case selection and clinicopathologic characteristics
In a retrospective approach, we reviewed our institutional database to identify patients with PBL whose primary diagnostic biopsy specimen had been referred to the reference center for Haematopathology University Hospital Schleswig Holstein Campus Lübeck and Hämatopathologie Lübeck for centralized histopathologic panel evaluation between January 1998 and December 2019. Further clinicopathologic characteristics are presented in the supplemental Materials and Methods.
This retrospective study was approved by the ethics committee of the University of Lübeck (reference no. 18-311) and conducted in accordance with the Declaration of Helsinki. Patients at the Reference Center for Hematopathology have provided written informed consent regarding routine diagnostic and academic assessment, including genomic studies of their biopsy specimen in addition to transfer of their clinical data.
Extraction of nucleic acids, WES, and RNA-seq
Genomic tumor DNA and tumor RNA were each extracted from 3 formalin-fixed, paraffin-embedded (FFPE) tissue sections of 5 µm thickness using a Maxwell RSC DNA FFPE kit and Maxwell RSC RNA FFPE kit (both Promega). WES was performed by using a hybrid capture approach with the SureSelect Human All Exon V6 library preparation kit (Agilent Technologies) followed by massively parallel sequencing of enriched exonic sequences on a NovaSeq platform (Illumina). All samples with successful library preparation (33 of 41) were taken forward to sequencing.
PBL samples were sequenced to an average depth of 201× (±50×; median, 203×). Sequencing was performed at Novogene (UK) Co., Ltd.
Raw fastq files have been deposited in the European genome-phenome archive (EGA) under the accession number EGAD00001006795. The transcriptional profile of PBL was investigated by RNA-seq, when exome sequencing had previously been conducted successfully. A Ribo-Zero Magnetic Kit (Human, Mouse, Rat) (Illumina) was used for ribosomal RNA depletion, and library preparation was performed by using the NEBNext UltraT Directional RNA Library Prep Kit (New England BioLabs). Sequencing in cases with successful library preparation (20 of 33) was performed at Novogene (UK) Co., Ltd., and all genomic studies were guided by the principles of the European Medicines Agency International Council for Harmonisation of Technical Requirements for Registration of Pharmaceuticals for Human Use guideline E18 on genomic sampling and management of genomic data.
Variant calling
As described in Gebauer et al,24 raw fastq reads trimmed (adapter and quality values) using fastp25 (version 0.20.0; minimum length, 50 bp; maximum unqualified bases, 30%; trim tail set to 1) and trimmed reads were mapped to GRCh37/hg19 by using bwa mem (version 0.7.15).26 Resulting SAM files were cleaned and sorted and converted into BAM format using Picard Tools (version 2.18.4). Next, mate-pair information was fixed, duplicates were removed, and base quality recalibration was performed by using Picard Tools27 and dbSNP version 138. Single nucleotide variants (SNVs) and short insertions as well as deletions (indels) were identified following the best practices for somatic mutation calling provided by GATK.28 Briefly, the GATK Mutect229 (version 4.1.5.0) algorithm was applied to all BAM files with gnomAD variants as germline resource and the b37 exome panel data as a panel of normal, capturing the expected repertoire of germline variants to be expected in a Central European study population. Afterward, FFPE read orientation artifacts were identified and removed according to GATK guidelines. Filtered variants were annotated by using ANNOVAR30 (24 October 2019 version). Coverage for reference and alternative alleles for each variant was extracted by using vcf-query (VCFtools version 0.1.1331 ). The top 20 frequently mutated genes (FLAGS32 ) were removed from further analysis. Somatic variants were filtered as follows: minimum coverage of 40, minimum variant allele frequency of 10%, and only variants with a frequency <0.001 in 1000 genomes, gnomAD, or ExAC were considered for subsequent downstream analysis. To identify genes that are more often mutated than expected, MutSigCV (version 1.41)33 was applied, and potential driver genes were identified using P < .05. Selected mutations in PRDM1, SOCS1, STAT3, and TP53 in samples from which sufficient tissue was available for confirmatory investigations were subjected to either Sanger sequencing or amplicon-based next-generation sequencing (supplemental Figure 1; supplemental Table 2).
Details on data analysis regarding copy number aberrations, network diffusion analysis, gene expression profiling, and fusion gene detection, as well as subsequent statistical methods, are provided in the supplemental Materials and Methods.
Results
Clinical characteristics of the study group
We collected 41 cases of PBL at diagnosis with sufficient FFPE tissue samples for molecular studies (age range, 29-86 years); 33 cases were included in the final analysis, following 8 dropouts due to insufficient yield at library preparation for WES. An underlying HIV infection was detectable in 14 (42.4%) of 33 patients, and PBL tumor cells were shown to express EBV-encoded RNA in 20 (60.6%) of 33 cases. HIV-positive patients were significantly younger (mean age, 44 vs 70 years; P = .0001) and had a significantly lower international prognostic index (IPI; P = .006) and a trend toward lower-stage disease at diagnosis (P = .076). Whenever evaluable, human herpesvirus-8 was absent (immunohistochemistry, n = 6 [18.2%]), and serologic test results were available in 9 (27.3%) cases. The majority of patients in our study were male (23 of 33 [69.7%]) and presented with advanced-stage disease (19 of 33 stage III/IV [57.6%]) and an adverse prognostic constellation (18 of 33 IPI >2). Most patients received an intensive CHOP-like (cyclophosphamide, doxorubicin, vincristine, and prednisolone) therapeutic front-line regimen (21 of 33 [63.6%]), resulting in an overall response rate of 72.7% (24 of 33). Median progression-free and overall survival was 9 and 22 months, respectively. Two elderly, frail patients refused any type of anticancer treatment and rapidly died due to PBL progression.
Baseline characteristics of PBL cases included in the current study are briefly summarized in Table 1. Treatment outcome in our cohort was dismal overall, although slightly more favorable in the HIV-positive subgroup (supplemental Figure 2) as could be expected from previous studies (median overall survival, 19 vs 45 months) as significantly more HIV-negative patients received an intensive CHOP-like first-line regimen (P = .001).7,34 Most samples (except case 01) included in the current study were previously investigated for the impact of MYC gene rearrangements and amplifications on clinical outcome.34 Beyond these observations, we detected no significant association between an underlying HIV or EBV infection and any of the other reported clinicopathologic features.
Baseline clinicopathologic characteristics in patients with PBL
| Characteristic | PBL group (N = 33) |
|---|---|
| Age, median (range), y | 61.5 (29-86) |
| Sex | |
| Female | 10 (33.3%) |
| Male | 23 (69.7%) |
| HIV status | |
| HIV-positive | 14 (42.4%) |
| HIV-negative | 19 (57.6%) |
| EBV status | |
| EBV-positive | 20 (60.6%) |
| EBV-negative | 13 (39.4%) |
| HIV- and EBV-positive | 13 (39.4%) |
| R-IPI | |
| 0 | 4 (12.1%) |
| 1-2 | 11 (33.3%) |
| >2 | 18 (54.5%) |
| Stage (Ann Arbor) | |
| I | 6 (18.2%) |
| II | 8 (24.2%) |
| III | 8 (24.2%) |
| IV | 11 (33.3%) |
| B symptoms | |
| Yes | 15 (45.5%) |
| No | 18 (54.5%) |
| Chromosomal aberrations | |
| MYC overall | 26 (78.8%) |
| MYC amplification | 12 (36.4%) |
| MYC split (+/− amplification) | 14 (42.4%) |
| CD30 by immunohistochemistry | |
| Positive | 7 (21.2%) |
| Negative | 26 (78.8%) |
| Extranodal sites | |
| 0 | 4 (12.1%) |
| 1-2 | 27 (81.8%) |
| >2 | 2 (6.1%) |
| ECOG performance status | |
| 0-2 | 25 (75.8%) |
| >2 | 8 (24.2%) |
| Lactate dehydrogenase | |
| Normal | 10 (30.3%) |
| Elevated | 23 (69.7%) |
| CNS involvement at diagnosis | |
| Yes | 0 (0.0%) |
| No | 33 (100.0%) |
| Front-line therapy regimen | |
| CHOP-like | 21 (63.6%) |
| R-based | 5 (15.2%) |
| Others* | 8 (24.2%) |
| Refusal of treatment | 2 (6.1%) |
| Front-line therapy response rates (n = 32) | |
| CR | 10 (30.3%) |
| VGPR | 4 (12.1%) |
| PR | 5 (15.2%) |
| SD | 5 (15.2%) |
| PD | 7 (21.2%) |
CHOP, cyclophosphamide, doxorubicin, vincristine, prednisolone; CNS, central nervous system; CR, complete response; ECOG, Eastern Cooperative Oncology Group; GCB, germinal-center B-cell like; PD, progressive disease; PR, partial remission; R, rituximab; R-IPI, revised-international prognostic index; SD, stable disease; VGPR, very good partial remission.
Indicates other regimen (eg, bendamustine) or palliative cytoreductive treatment.
Mutational landscape of PBL identified by WES
To characterize the mutational landscape in an extensive cohort of PBL cases, WES was successfully performed in 33 patient-derived tumor biopsy specimens. Matched germline DNA was not available for comparative analysis. We therefore applied the analytical framework outlined earlier to analyze WES data in the absence of paired germline DNA. After the primary identification of SNVs and indels in individual samples and subsequent filtering to correct for FFPE-derived artifacts and spurious mutations, we applied the MutSigCV algorithm and thereby initially identified 110 potentially significant candidate driver genes (P < .05) (supplemental Table 3).33
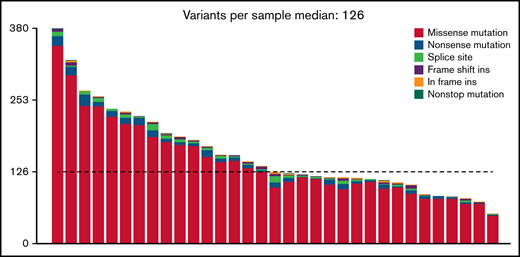
At an overall low to intermediate tumor mutational burden (median, 3.273; range, 1.377-9.870 mutations/Mbase), we describe 8450 presumably harmful somatic mutations (cutoffs are discussed in the Materials and methods) involving 4505 genes after variant filtering. Of these, SNVs and indels represented 66% of the mutations (5219 SNVs for 4505 genes). Among them, missense mutations were the most frequent alterations (91%), followed by nonsense (4%) and splice-site (2%) mutations; indels posed 2% of somatic mutations (Figure 1). An oncoplot showing significantly mutated genes with alterations in ≥3 cases is provided in Figure 2A. Confirmatory Sanger sequencing or amplicon-based next-generation sequencing identified variants, previously detected by WES on all investigated occasions (supplemental Figure 1; supplemental Table 2).
![Genomic and mutational landscape in plasmablastic lymphoma. (A) An oncoplot of genes mutated in at least 3 PBL samples after PBL MutSigCV analysis (P < .05) with allele frequencies added (left bar) and samples affected (right bar). Different types of mutations are color coded. In addition, covariates are shown below the plot for each sample. EBV-encoded RNA [EBER] EBV/HIV: neg, negative; pos, positive. MYC fluorescence in situ hybridization (FISH): ab, aberrated; NA, not available; wt, wild type. Progress: PD, progression disease; R, remission; SD, stable disease. (B) Location of SCNVs along the genome (red bars denote gains; blue bars denote losses; gene names refer to affected oncogenes and genes related to oncogenetic pathways). (C) Selected genes (oncogenes and oncogenetic pathway genes) affected by SCNVs.](https://ash.silverchair-cdn.com/ash/content_public/journal/bloodadvances/6/2/10.1182_bloodadvances.2021005486/4/m_advancesadv2021005486f2.png?Expires=1767764067&Signature=eNz4OJ4G8gLWDp8X6S4d9nyyh3B4hGeirvho1j9rF5OxDg3oMxxr19E3HyGV3r6HhVAT3NQIeGvFMczAFQxNKlsjTugxzxxgMHXHsQb2kKJ1CIDewTVvJybCPXcL3pORddEjb-LSV8m3bMrlBCzfRdwOkhv-ZsNLdY-EbwmOxCmQjEdjmn8HfPTvShTxn6lRXnkToE4xbaP-d~DLBcNbT-enzC7LYY6h7FlD4PVAwqVtBYUmfnS6SFEK8IoDw0ScP7endyaFdNKoPx5tjapXL5Y6bhIt--fH-o33tcgQYyfREL2NmCO1xnTK8X2BPuziCTf6mGyT1Pmo7sJW2yuwJg__&Key-Pair-Id=APKAIE5G5CRDK6RD3PGA)
Genomic and mutational landscape in plasmablastic lymphoma. (A) An oncoplot of genes mutated in at least 3 PBL samples after PBL MutSigCV analysis (P < .05) with allele frequencies added (left bar) and samples affected (right bar). Different types of mutations are color coded. In addition, covariates are shown below the plot for each sample. EBV-encoded RNA [EBER] EBV/HIV: neg, negative; pos, positive. MYC fluorescence in situ hybridization (FISH): ab, aberrated; NA, not available; wt, wild type. Progress: PD, progression disease; R, remission; SD, stable disease. (B) Location of SCNVs along the genome (red bars denote gains; blue bars denote losses; gene names refer to affected oncogenes and genes related to oncogenetic pathways). (C) Selected genes (oncogenes and oncogenetic pathway genes) affected by SCNVs.
Genomic and mutational landscape in plasmablastic lymphoma. (A) An oncoplot of genes mutated in at least 3 PBL samples after PBL MutSigCV analysis (P < .05) with allele frequencies added (left bar) and samples affected (right bar). Different types of mutations are color coded. In addition, covariates are shown below the plot for each sample. EBV-encoded RNA [EBER] EBV/HIV: neg, negative; pos, positive. MYC fluorescence in situ hybridization (FISH): ab, aberrated; NA, not available; wt, wild type. Progress: PD, progression disease; R, remission; SD, stable disease. (B) Location of SCNVs along the genome (red bars denote gains; blue bars denote losses; gene names refer to affected oncogenes and genes related to oncogenetic pathways). (C) Selected genes (oncogenes and oncogenetic pathway genes) affected by SCNVs.
We observed no evidence of microsatellite instability (MSI)-associated hypermutations. This finding appears similar to results obtained in DLBCL (0.3%) but unlike and significantly lower than other aggressive lymphomas (eg, primary mediastinal B-cell lymphoma).35
All PBL cases harbored mutations in genes implicated in oncogenesis according to our bioinformatics annotations. Upon integrated analysis of molecular and clinical data, we investigated the 17 most frequent genomic alterations identified in the current study (mutations with a frequency ≥15% in the study cohort) for their impact on overall survival and progression-free survival. We identified a significant impact (P < .05) of CSMD3 mutational status (supplemental Figure 3) on both overall survival and progression-free survival; upon correction for multiple testing according to the Bonferroni method, an additional effect regarding ZNF462 mutation status failed to reach statistical significance, and neither gene was significantly mutated according to the subsequent MutSigCV analysis. Finally, within a Cox proportional hazards model, CSMD3 mutation status failed to display prognostic independence from established IPI factors, which prompts the need for additional, preferably prospective clinical correlations of mutational data in PBL, in the search for molecular prognosticators.
Recurrent copy number alterations in PBL
We investigated our PBL cohort for somatic copy number variants (SCNVs) using the CONTROL-freec (v11.4)36 algorithm in tumor-only mode followed by GISTIC2.0 (version 2.0.23)37 analysis, while excluding chromosomes X and Y as well as common CNVs according to the Broad Institute’s panel of normal (supplemental Materials). Subsequently, these observations were cross-referenced with the loci of known oncogenes, tumor suppressors, and elements of potential oncogenic pathways.38 We found recurrent copy number gains in oncogenes (eg, MEF2B and CSF1R) previously implicated in lymphomagenesis and previously reported to be incidentally amplified in a variety of human cancers, as well as copy number losses in tumor suppressors such as NPM1 (Figure 2B-C); common CNVs, as defined by the aforementioned referenced panel of normal, were identified in the expected frequencies.39-41 Additional information on minimal common regions alongside all affected genes within a given SCNV is provided in supplemental Table 4.
Significantly mutated candidate driver genes and mutational signatures
The list of significant candidate driver genes included several genes previously implicated in PBL pathogenesis, such as STAT3 and PRDM1 alongside mutational drivers in other B-cell lymphoproliferative disorders such as DLBCL and MM (NRAS, BRAF, and TP53) (Figure 2). We observed no subtype-specific predominance regarding MYC, EBV, and/or HIV status of statistical significance in our limited cohort. However, STAT3 mutations were found to be significantly enriched in HIV-positive PBL (Fisher’s exact test, P = .0463), whereas they were rare in HIV-negative patients, hinting at partially distinct molecular paths of pathogenesis. Similar trends bordering on statistical significance of enrichment were observed in LNP1 for HIV-positive patients as well as TP53, PRDM1, and IRS4 in HIV-negative patients. Significantly mutated, putative driver genes in PBL identified according to our pipeline exhibited a high degree of estimated pathogenicity with a median combined annotation dependent depletion (CADD) score of 25.45.
To further characterize the mutational profiles driving PBL pathogenesis, we performed mutational signature analysis as recently described in DLBCL and other aggressive B-cell lymphomas.35,42 Here, we identified the presence of 2 signatures, SBS2 (indicating impaired activity of the AID/APOBEC family of cytidine deaminases) and SBS6 (associated with defective DNA mismatch repair), with an overall predominance of the latter (supplemental Table 5). This phenomenon was significantly accentuated in EBV-negative PBL cases (supplemental Figure 4). Unlike our previous work on PBL and MYC in a more comprehensive, clinically annotated cohort, no correlation was observed between MYC status and overall survival (P = .62) or progression-free survival (P = .91), both when analyzing amplifications and translocations together or separately.34 The number of mutations was similar between MYC wild-type and MYC altered samples (again, translocations and amplifications; Wilcoxon test, P = .44). MYC rearrangements were not correlated with EBV status (χ2 test, P = .1493). Regarding genes and MYC aberrations, OGFOD2, CASC4, and CTDSPL2 were found to be mutated more often in MYC wild-type samples (4 of 7 vs 2 of 25; fdr = 0.0122, fdr = 0.0258, fdr = 0.0258). Furthermore, the expected association between gene expression of MYC and cytogenetic MYC status failed to reach statistical significance within our limited sample set (Student t test, P = .095); splitting MYC status into amplification and translocation also revealed no statistically significant differences (Student t test, P > .05).
Deregulation of JAK/STAT, RTK-RAS, NF-κB, and phosphatidylinositol 3-kinase/AKT/mTOR signaling in PBL by distribution of mutations and network diffusion analysis
The predicted functional impact of all reported mutations is shown in supplemental Table 6 (CADD score) as well as protein domain annotations for SNVs and indels. Selected MutSigCV genes showed an average CADD score of 22.2 (standard deviation, 8.1; median, 23.4; minimum, 1.21; maximum, 37.0). We further investigated the putative functional relevance of mutations proven to be significant upon MutSigCV analysis. In this context, we matched our results from MutSigCV analysis with the pfam database to describe the impact on the protein function in more detail. Supplemental Table 6 summarizes the impact of SCNVs on post-transcriptomic changes. Here, we identified 4754 (64.8%) missense mutations, 231 (3.1%) nonsense mutations, 5 (0.1%) nonstop mutations, 121 splice site mutation, and 108 frame shift mutation harboring the potential to affect protein folding and the sequence of amino acids. Focusing on the most frequently mutated genes in our PBL cohort, by way of example, we were hereby able to confirm the relevance of STAT3, HIST1H1E, PRDM1, TP53, NRAS, and PIM1 mutations on protein functions.
The STAT3 protein plays a key role in cell growth and apoptosis.43 Our results indicate relevant disruption of the STAT3 binding domain (pfam 02864) and the SH2 domain in STAT3 (cd10374).44 The proto-oncogene NRAS encodes a protein with intrinsic guanosine triphosphatase activity, which is involved in the regulation of cell growth and division. Thus, NRAS mutations promote carcinogenesis.45 Here, we identified frequent NRAS missense mutations affecting the H-N-K Ras–like domain (cd04138). Mutations in this domain are known to lead to the dysregulation of cell growth.46 We also found frequent TP53 missense mutations affecting the p53 DNA-binding domain (cd08367). The relevance of this mutation on carcinogenesis has been reported plurally.47
Cumulatively, we detected genetic lesions, putatively resulting in gain of function in JAK/STAT signaling, in 64% of PBL cases. Expanding on previously reported STAT3 mutations in PBL, we further identified recurrent mutations and/or SCNVs affecting OSMR, PIM1, and ITGA4. Although JAK/STAT signaling was the predominant target of somatic mutation in PBL, the overall distribution regarding the mutational signature within the pathway was heterogeneous (33 mutations in 24 genes in 21 patients) (supplemental Figures 5 and 6). Several genes, including OSMR, were previously implicated in alternative signaling pathways, including the enhancement of Ras/Raf/MAPK signaling, rendering the gene a rather promiscuous target of pathway allocation. Most of these genetic alterations have been previously reported to constitute gain-of-function mutations resulting in constitutive JAK/STAT pathway activation in various types of T cells as well as primary or central nervous system/or central nervous system B-cell lymphoma and MM.35,48-50
Merging mutational and SCNV data, we observed alterations that putatively resulted in gain of function in RTK-RAS signaling in 76% of patients (supplemental Figures 5, 6, and 8). Activating mutations affecting ERBB3 and NRAS were most frequent in our series and have been previously described in a number of other tumor types, including MM, whereas an amplification of PDGFRB was found to be the overall dominating genetic lesion in this pathway.51,52 A widespread mutational pattern was observed, affecting a substantial fraction of the pathway (27 of 85 genes [32%]), including ALK, BRAF, CBLC, and ERBB2, similar to other B-cell malignancies as well as other solid tumors.53,54 Intriguingly, we also identified 2 cases harboring a presumably harmful NTRK3 mutation (CADD score 29.8). This finding is of relevance in light of the recent tissue-agnostic approval by the US Food and Drug Administration of the pan-TRK inhibitors larotrectinib and entrectinib alongside the recent identification of NTRK point mutations in hematologic malignancies, known to cause similar biological effects as NTRK fusions.55
In accordance with previous studies, we found mutations and SCNVs affecting candidate driver genes of lymphomagenesis directly affecting NF-κB signaling in 58% of cases (supplemental Figure 7A).20 Although this was among the predominant pathways, identified through our network diffusion approach, mutations affecting the pathway were broadly distributed, with only 2 genes showing mutations in >1 patient (NFKB2, n = 4; ATM, n = 2), both previously implicated in the pathogenesis of lymphoplasmacytic lymphoma, intriguingly another type of terminally differentiated B-cell lymphoma.56 Upon extension of the analysis onto the NF-κB Pathway Interactome Map, thus explicitly broadening the scope beyond the most compelling representatives of a given pathway, several cases were found to exhibit mutations and SCNVs in CDX1, TWF2, and ABCB9 as well as the previously described genetic lesions in PRDM1 (supplemental Figure 7B).18,19,57 Intriguingly and in keeping with recent observations by Ramis-Zaldivar et al,23 we observed an accumulation of mutations in genes implicated in epigenetic and chromatin modifiers (11 of 33 cases).
After SNV and indel evaluation with MutSigCV, both a gene set enrichment as well as a network diffusion approach (Figures 3A-B) on genes with P < .01 were used to assess the impact of significant genetic events on neighboring genes. This evaluation highlighted the perturbing role of several recurrent alterations in interleukin-6 (IL-6)/JAK/STAT (OSMR, STAT3, PIM1, and SOCS1) as well as NF-κB (NFKB2 and BTK) and to a lesser extent phosphatidylinositol 3-kinase/AKT/mTOR (PI3K/AKT/mTOR) (ACACA and HSP90B1) signaling pathways (supplemental Figure 5) as the mutations detected within the latter pathway do not concede with the most compelling drivers of PI3K signaling. The former 2 of these pathways were previously described as being significantly disrupted in PBL.18,19 Furthermore, through a network diffusion approach, we found cellular metabolism to be significantly preserved, whereas NF-κB, MYC target genes, cell cycle regulators, and immunologic processes (including allograft rejection and IL6/JAK/STAT3 signaling) were significantly mutated (Figure 3B).
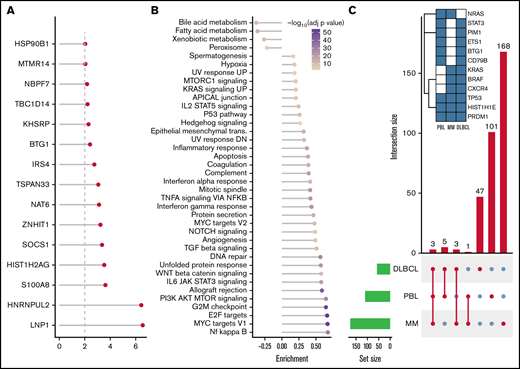
Mutational analysis for significantly mutated genes, network propagation and mutational overlap with related entities. Significance levels for all PBL MutSigCV genes (P < .01) (A) and HALLMARK gene sets and Nfkb pathway enrichment (B) for network diffusion analysis of significant MutSigCV genes (MutSigCV, P < .01). (C) UpSet plot showing the overlap of MutSigCV genes using PBL, DLBCL (1144 cases retrieved from 5 cohorts encompassing various subtypes of DLBCL via cBioPortal),42,58–61 and MM (205 cases from Lohr et al62 retrieved via cBioPortal) data; inlet shows the overlap between the 3 tumor entities.
Mutational analysis for significantly mutated genes, network propagation and mutational overlap with related entities. Significance levels for all PBL MutSigCV genes (P < .01) (A) and HALLMARK gene sets and Nfkb pathway enrichment (B) for network diffusion analysis of significant MutSigCV genes (MutSigCV, P < .01). (C) UpSet plot showing the overlap of MutSigCV genes using PBL, DLBCL (1144 cases retrieved from 5 cohorts encompassing various subtypes of DLBCL via cBioPortal),42,58–61 and MM (205 cases from Lohr et al62 retrieved via cBioPortal) data; inlet shows the overlap between the 3 tumor entities.
Comparative analysis of PBL mutational landscape and related entities
To refine the genomic taxonomy of B-cell lymphomas and to investigate the mutational commonalities and differences between PBL and other related pathological entities chosen, due to similar features of (terminal) B-cell differentiation (DLBCL and MM), comparative analysis of candidate mutational drivers in PBL as described earlier and The Cancer Genome Atlas cohorts of DLBCL (n = 1,15142,58-60 ) and MM (n = 21162 ) was performed. Interestingly, we identified three overlapping candidate drivers common to all entities (HIST1H1E, PRDM1, and TP53) as well as 5 genes exclusively mutated in both PBL and DLBCL (PIM1, BTG1, CD79B, ETS1, and STAT3), whereas only NRAS was found to be an exclusively shared driver between PBL and MM. The vast majority of novel candidate genes reported in our study were, however, found to be PBL exclusive (Figure 3C).
Fusion genes
Using STAR-fusion (version 1.9.0)63 running in de novo reconstruction mode and hg19 as reference genome, we were able to identify fusion genes from RNA-seq data (Figure 4). Ten samples were shown to carry 22 fusions (supplemental Table 7). In total, 16 unique fusion events were detected. We did not detect any novel, recurrent fusion events beyond the expectedly high frequency of MYC aberrations. To verify the fusions identified using STAR-fusion, we ran fusioncatcher and FusionInspector to validate our findings. fusionscatcher verified 11 of 22 fusions; 3 of 4 MYC fusions were verified by fusioncatcher. FusionInspector verified 18 of 22 fusions and 3 of 4 MYC fusions. All of the latter were subsequently validated by fluorescence in situ hybridization. In total, 19 of 22 fusions were verified.
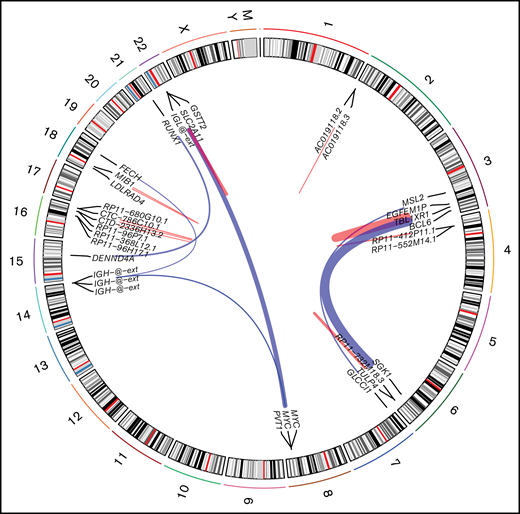
Fusion identified in PBL samples with respect to their genomic location. Red links indicate intrachromosomal fusions, and blue links indicate interchromosomal fusions.
Fusion identified in PBL samples with respect to their genomic location. Red links indicate intrachromosomal fusions, and blue links indicate interchromosomal fusions.
RNA-seq
Using STAR aligner (version 2.7.2b)64 and MIXnorm,65 we performed a gene set enrichment analysis employing GSVA and HALLMARK gene sets (supplemental Figure 8). The RNA-seq expression profiles of all 20 patients, whose data sets met our predefined standards for quality and quantity (>10 Gb/sample at Q30% > 90%) for subsequent analysis, were subjected to hierarchical clustering of both gene sets and cases. We hereby uncovered 2 dominant clusters of gene sets alongside 4 patient clusters. Induced pathways were found to reflect the genomic profile with regard to the heterogeneous distribution of alterations accentuated in IL-6/JAK/STAT signaling, inflammatory response genes, NF-κB activity, and MYC signaling. Integrated analysis of WES and RNA-seq regarding mutational data in an exemplary subset of genes (STAT3, TP53, DHX33, NRAS, and HIST1H4E) yielded a concordance rate of 43.8%, which was, however, attributable to low coverage/expression within the RNA-seq data. Furthermore, the aspect of allele-specific expression needs to be considered. Successful expression analysis of genes, affected by SCNAs according to our WES data, was hampered by the low number of cases with availability of both types of data.
Comparative gene expression profiling between EBV-positive and EBV-negative PBL
RNA-seq profiles were further investigated for genes showing significant differential expression between EBV-positive PBL and EBV-negative PBL identified through the linear model fit with P value correction (padj < 0.01 and log2 fold-change >1). Comparative analysis yielded 1099 genes with significant differential expression between the 2 groups (Figure 5A); a tabular delineation of gene expression profiles in our cohort is provided in supplemental Table 8. Of these genes, 623 were upregulated in EBV-positive PBL. Unsupervised hierarchical clustering of differentially expressed genes (log2 fold-change >2) is represented on the heatmap shown in Figure 6. Subsequently, functional annotation of this gene expression profile was performed by gene set enrichment analysis, using the Gene Ontology “Biological Process.” Hereby, we uncovered a predominant induction of metabolic (eg, mitochondrial) processes in EBV-positive PBL (Figure 5B; supplemental Figure 10). Intriguingly, class I major histocompatibility complex–mediated antigen processing and presentation were also significantly affected by the presence of an underlying EBV infection, as was cell cycle regulation. These findings thus partially confirm previous results, whereas only IL15 expression was induced in EBV-positive PBL, unlike the other genes within the IEGS33.16,67 Differential expression was also prominent in several known EBV targets, including CD83, RAD51, PGAM1, CDK2, and DNMT3B, a known molecular link between B-cell state and the EBV latency program.68
![Distinctive expression pattern between EBV+ and EBV– PBL. (A) Volcano plot shows log2 fold-change (FC) and q-values of expression analysis (limma: EBV positive [EBV+] vs EBV negative [EBV–]; positive log2 FC refer to upregulated genes in EBV+, negative values to upregulated genes in EBV–). Genes related to NF-κB, PI3K AKT TOR, IL6 JAK STAT3, RTK_RAS, and NOTCH pathways are shown. Genes from Dunmire et al66 are also included. (B) Gene set enrichment analysis against Gene Ontology gene sets on differentially expressed genes (log2 fold-change > 1, padj < 0.01). Results were manually curated (full list is shown in supplemental Figure 9); enrichment scores (length of bar) and log scaled q-values (color-coded dots) are displayed.](https://ash.silverchair-cdn.com/ash/content_public/journal/bloodadvances/6/2/10.1182_bloodadvances.2021005486/4/m_advancesadv2021005486f5.png?Expires=1767764067&Signature=tVSA1GinZvAeHtm0HON2SP8cEvzZMWtASJLIbKVdtVm8EwlxCFRJzTCjzeipYtbiZaMM2R2oYgFfxGHB530-wUb9SFow4dgtTV5BmmVDnntUqB9WuU9Ygp0~w0sSpBMkOVu57dfPtoSVxsHBsiEclxc4MyqbQGsaEcBnZuHNYcpbT-2hmTzRnfhFj9Ic8gg~kkXxJ7RYcI-El5WY9dgq8Oa2kz6Ns~i-tTf1ZLTqm5OfPMdyrP8-dZQJBwl~hLFtO~qX7zPvYkQDBsYJqte~dA3qhozwu8RBJx8mDfCObA1OPcF3M2~FuCNLDjPGpFlkNGHW7FrG00ltSTZ-5JcPGg__&Key-Pair-Id=APKAIE5G5CRDK6RD3PGA)
Distinctive expression pattern between EBV+ and EBV– PBL. (A) Volcano plot shows log2 fold-change (FC) and q-values of expression analysis (limma: EBV positive [EBV+] vs EBV negative [EBV–]; positive log2 FC refer to upregulated genes in EBV+, negative values to upregulated genes in EBV–). Genes related to NF-κB, PI3K AKT TOR, IL6 JAK STAT3, RTK_RAS, and NOTCH pathways are shown. Genes from Dunmire et al66 are also included. (B) Gene set enrichment analysis against Gene Ontology gene sets on differentially expressed genes (log2 fold-change > 1, padj < 0.01). Results were manually curated (full list is shown in supplemental Figure 9); enrichment scores (length of bar) and log scaled q-values (color-coded dots) are displayed.
Distinctive expression pattern between EBV+ and EBV– PBL. (A) Volcano plot shows log2 fold-change (FC) and q-values of expression analysis (limma: EBV positive [EBV+] vs EBV negative [EBV–]; positive log2 FC refer to upregulated genes in EBV+, negative values to upregulated genes in EBV–). Genes related to NF-κB, PI3K AKT TOR, IL6 JAK STAT3, RTK_RAS, and NOTCH pathways are shown. Genes from Dunmire et al66 are also included. (B) Gene set enrichment analysis against Gene Ontology gene sets on differentially expressed genes (log2 fold-change > 1, padj < 0.01). Results were manually curated (full list is shown in supplemental Figure 9); enrichment scores (length of bar) and log scaled q-values (color-coded dots) are displayed.
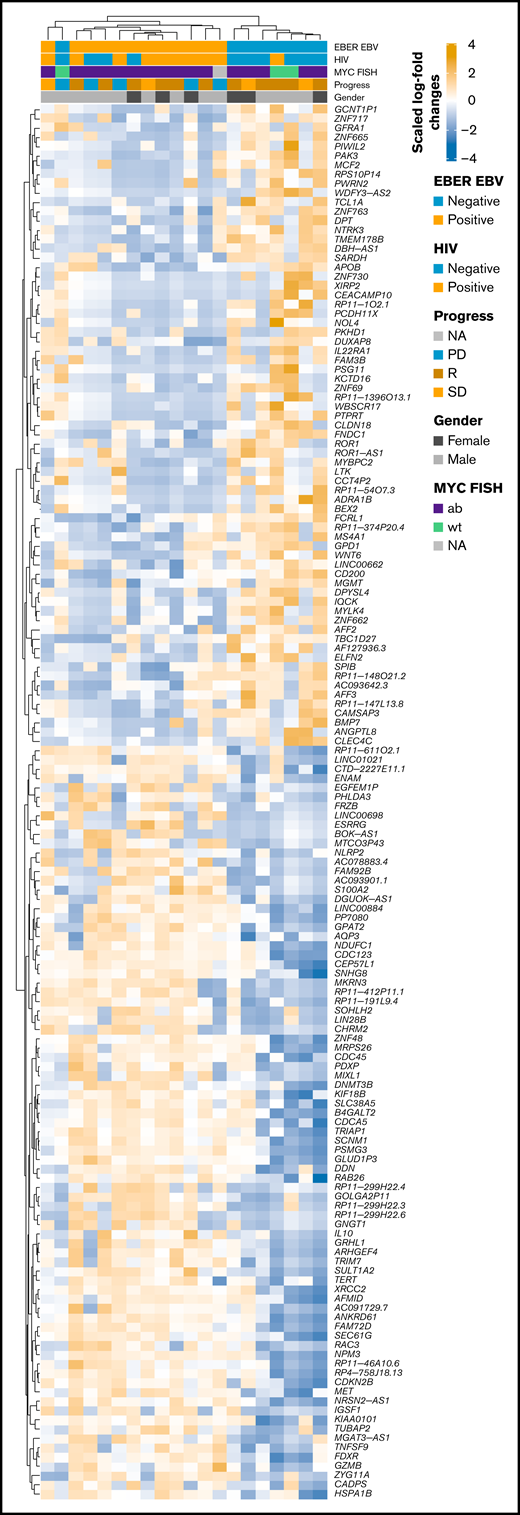
Heatmap of scaled log2 fold-change of significantly expressed genes (P < .01, log2 fold-change > 2) EBV-positive vs EBV-negative samples. Clustering was performed by using Spearman correlations, and covariates are shown within the figure. ab, aberrated; FISH, fluorescence in situ hybridization; NA, not available; PD, progression disease; R, remission; SD, stable disease; wt, wild type.
Heatmap of scaled log2 fold-change of significantly expressed genes (P < .01, log2 fold-change > 2) EBV-positive vs EBV-negative samples. Clustering was performed by using Spearman correlations, and covariates are shown within the figure. ab, aberrated; FISH, fluorescence in situ hybridization; NA, not available; PD, progression disease; R, remission; SD, stable disease; wt, wild type.
Upon restriction of our comparative gene expression analysis on genes with established functions as tumor suppressors or oncogenes, we identified several significantly upregulated genes in EBV-positive PBL (including MET, BCL2, and NRAS). EBV-negative PBL was significantly enriched for downregulated tumor suppressors (including FLT3, MEN1, MSH2, and NPM1) (Figure 5A). Intriguingly, we identified significant EBV-dependent deregulations within all major oncogenic pathways previously found to be affected by oncogenic mutations. Although most pathways displayed a homogeneous distribution of deregulated genes between both subgroups, key elements of PI3K/AKT/mTOR (including CDK1, CDK2, and HSP90B1) were almost exclusively upregulated in EBV-positive PBL (Figure 5A; supplemental Figure 9; supplemental Table 9). This is in keeping with the known induction of PI3K signaling in EBV-infected cells as a potent collaborator of MYC.69,70 Specifically, in PBL, Mine et al71 described an IL-6 dependency of PBL-1, an EBV-driven PBL cell line, for proliferation and survival. Furthermore, mTOR inhibitors effectively induced cell death in this model, suggesting its potential therapeutic role in a subset of patients with PBL.
Further analysis on a case-by-case level, screening signaling pathways (predominantly affected by genetic lesions in PBL) revealed a highly induced expression of NTRK3 in EBV-negative PBL. We hereby establish a significant, EBV-dependent transcriptional divergence in contrast to the widely similar mutational landscape shared by both PBL subtypes.
A comprehensive tabular summary of the entire processed data generated in the current study, using the pipeline outlined here, is provided as supplemental Table 9. Lollipop plots are provided for selected genes with special emphasis on known cancer-related genes and MutSigCV top genes within our cohort in supplemental Figure 11.
Discussion
In this comprehensive genomic and transcriptomic study of PBL, we report on WES and RNA- seq data obtained in a cohort of PBL tumors. To the best of our knowledge, we present the largest cohort and most comprehensive data set for this entity, as previous reports on PBL were limited by lower case numbers, targeted sequencing approaches, and lack of transcriptional data, whereas we systematically defined recurrent mutations, CNAs, and gene fusions alongside predominant mutation and transcriptional signatures. The current study made 2 novel and essential observations.
First, a significant enrichment for mutations affecting both NF-κB as well as IL-6/JAK/STAT signaling pathways was identified, as could be expected from previous studies reporting on targeted sequencing approaches.18,19 However, adding to previous and complementing most recent observations (the former primarily derived from HIV-positive patients), we unveil several novel and recurrent, activating genetic alterations involving the classic RTK-RAS pathway in the vast majority of cases (23 of 33 [69.7%]) as a predominant driver of PBL lymphomagenesis, regardless of age and/or HIV status.23 These observations are, however, in line with recent observations in a targeted sequencing study on 11 patients with PBL-type posttransplant lymphoproliferative disorders.22 Intriguingly, compared with previous studies in highly selected HIV-positive PBL cohorts, we find that STAT3 mutations, considered to be essential drivers in PBL lymphomagenesis, as well as LNP1 mutations, occur less frequently in HIV-negative cases, whereas TP53, PRDM1, and IRS4 mutations and RTK-RAS perturbations seem to be more essential in this subgroup.20,21 Upon comparison with the most recent amplicon-panel derived study by Ramis-Zaldivar et al,23 we observed vast similarities with the current study, embedding it firmly within the landscape of published data on the molecular pathogenesis of PBL. Similarities included trends toward more mutations in STAT3 in EBV/HIV-positive cases and enrichment in TP53 mutations in EBV/HIV-negative cases, along with enrichment in mutations affecting epigenetic and chromatin modifiers. However, by contrast, these observations failed to reach statistical significance in terms of affected pathways, which may be attributable to the more concise methodologic approach of Ramis-Zaldivar et al as well as the small sample sizes and strong heterogeneity with regard to the composition of both study groups. By using MutSigCV, we describe a set of 110 candidate driver genes (P < .05; 15 genes, P < .01) (Figure 3) with substantial evidence of somatic and functionally impairing mutation status in the vast majority of studied tumors.33 Additional q-value analysis would have profusely limited this set of candidate driver genes in our relatively small study cohort, precluding known drivers of oncogenesis in aggressive lymphomas (eg, TP53, PRDM1, and others) from subsequent analysis. Using a widely established cutoff regarding the q-value (eg, < 0.1) would have resulted in a reduction in size of the candidate driver gene sets (n = 2 genes [LNP1 and HNRNPUL2]) brought on by the limitations in cohort size. Mutations in HNRNPUL2 have not been implicated in lymphoma pathogenesis but in glioblastoma and colorectal carcinoma.72,73 Although there was a high grade of confidence in our filtering pipeline, this suspicious finding requires functional validation in further studies. To retain pathobiologically meaningful data, q-value filtering was therefore omitted in our exploratory study as our data set disallows further screening for significantly mutated genes beyond the provided data (q-values are reported in supplemental Table 3). Subsequent studies on larger cohorts are required to further refine the definitive gene set of significant drivers in PBL and its subtypes. Our observations regarding NTRK3 in EBV-negative PBL, in concert with the previously identified oncogenic NTRK3 mutations, hint at a specific, therapeutically targetable mechanism in a clinically relevant subset of PBL cases.
Of potential therapeutic relevance, we found 2 mutations affecting BTK at diagnosis, potentially disrupting B-cell receptor signaling, resistant to specific inhibition (eg, ibrutinib). Moreover, the identification of oncogenic mutations in NTRK3 alongside its pronounced expression in EBV-positive PBL holds potential therapeutic promise for a subset of patients with PBL given the tissue- agnostic approval by the US Food and Drug Administration of the pan-TRK inhibitors larotrectinib and entrectinib.55 There remains, however, a lack of functional validations of potential novel therapeutic agents in preclinical models of PBL beyond preliminary studies of bortezomib, which has already found its way into clinical PBL practice.74 This poses a promising subject for successive studies. Upon comparison of mutational patterns and frequencies in PBL and related B-cell malignancies (DLBCL and MM), we provide evidence of pathogenetic independence of PBL from DLBCL and MM based on its genomic landscape, thereby supplementing previous studies on differential gene expression signatures.15,16 Our observations regarding MSI-associated hypermutations are clinically relevant as MSI has been associated with increased sensitivity to programmed cell death protein 1 blockade across a variety of malignancies, and checkpoint inhibitor therapies are currently being explored as salvage treatment options in a subset of relapsed/refractory aggressive B-cell lymphomas.75-77 Of note, copy number variation analysis derived from WES data revealed aberration affecting several genes, previously implicated in lymphomagenesis, such as CSF1R and MEF2B.39,40 In our case series, however, we were unable to reproduce the findings by Liu et al,21 who described recurrent copy number gains of CD44. This observation may well be attributed to the pathogenetically more heterogeneous study group in the current article.
Second, our RNA-seq data mirrored the genomic profile with regard to the heterogeneous distribution of altered pathways, and we further identified several transcriptional clusters, enriched for IL-6/JAK/STAT signaling, inflammatory response genes, NF-κB activity, and MYC signaling. Of special interest, however, comparative analysis of gene expression between EBV-positive PBL and EBV-negative PBL identified a marked impact on class I major histocompatibility complex–mediated antigen processing and presentation, as was cell cycle regulation, by the presence of an underlying EBV infection. Moreover, key elements of PI3K/AKT/mTOR signaling (including CDK1, CDK2, and HSP90B1) were almost exclusively upregulated in EBV-positive PBL, potentially advising more specific and phenotypically tailored treatment approaches to be explored in PBL, taking into account the tumor’s respective EBV status. The proposed IL-6/JAK/STAT dependency reflected by our WES and RNA-seq data appears particularly to be in keeping with a viral IL-6–driven xenograft model of PBL in which viral IL-6 collaborated with MYC in the formation of spontaneous plasmablastic tumors in a mouse model.78 Intriguingly, RNA-seq revealed downregulation of tumor suppressors (including FLT3, MEN1, MSH2, and NPM1) to be a recurrent feature significantly accentuated in EBV-negative PBL. In contrast to the widely similar mutational landscapes shared by both PBL subtypes, our observations uncovered a fundamental impact of EBV status on PBL gene expression. Our characterization of a distinct mutational and transcriptomic landscape in PBL, distinct from both DLBCL and MM, with pronounced mutational impairment of IL-6/JAK/STAT, RTK-RAS, and NF-κB signaling alongside transcriptional deregulation of the PI3K/AKT/mTOR pathway predominantly encountered in EBV-positive PBL, substantiate the pathobiological independence of PBL in the spectrum of terminally differentiated B-cell malignancies and thereby refine the taxonomy for aggressive lymphomas.
Acknowledgments
The authors thank Tanja Oeltermann and Biggi Steinfeldt for their skilled technical assistance. A.K. and H.B. acknowledge computational support from the OMICS compute cluster at the University of Lübeck.
H.B. acknowledges funding by the Deutsche Forschungsgemeinschaft (German Research Foundation) under Germany’s Excellence Strategy (EXC 22167-390884018).
Authorship
Contribution: N.G. and A.C.F. were responsible for study concept; N.G., A.K., H.M.W., N.H., V.B., H.M., H.-W.B., and S.S. performed data collection; A.K., N.G., H.M.W., H.-W.B., V.B., H.B., and N.v.B. contributed to data analysis and creation of figures and tables; N.G. drafted the initial version of the manuscript; and all authors contributed to critical revision and approval of the final version.
Conflict-of-interest disclosure: The authors declare no competing financial interests.
Correspondence: Niklas Gebauer, Department of Hematology and Oncology, UKSH Campus Lübeck, Ratzenburger Allee 160, 23538 Lübeck, Germany; e-mail: Niklas.Gebauer@uksh.de.

