

Key Points
High gene expression levels of MCT1 are associated with reduced PFS and OS in MM with lenalidomide-based maintenance therapy.
Overexpression of MCT1 impairs efficacy of lenalidomide in human myeloma cells in vitro and in vivo.
Abstract
Biomarkers that predict response to lenalidomide maintenance therapy in patients with multiple myeloma (MM) have remained elusive. We have shown that immunomodulatory drugs (IMiDs) exert anti-MM activity via destabilization of MCT1 and CD147. In this study, cell samples of 654 patients with MM who received lenalidomide (n = 455), thalidomide (n = 98), or bortezomib (n = 101) maintenance were assessed by gene expression profiling and RNA sequencing, followed by correlation of MCT1 and CD147 expression with data for progression-free survival (PFS) and overall survival (OS). Patients with high expression levels of MCT1 showed significantly reduced PFS (31.9 months vs 48.2 months in MCT1high vs MCT1low; P = .03) and OS (75.9 months vs not reached [NR] in MCT1high vs MCT1low; P = .001) in cases with lenalidomide maintenance, whereas MCT1 expression had no significant impact on PFS or OS in cases with bortezomib maintenance. We validated the predictive role of MCT1 for IMiD-based maintenance in an independent cohort of patients who received thalidomide (OS, 83.6 months vs NR in MCT1high vs MCT1low; P = .03). Functional validation showed that MCT1 overexpression in human MM cell lines significantly reduced the efficacy of lenalidomide, whereas no change was observed with bortezomib treatment, either in vitro or in a MM xenograft model. Our findings have established MCT1 expression as a predictive marker for response to lenalidomide-based maintenance in patients with MM.
Introduction
Multiple myeloma (MM) is a heterogenous clonal plasma cell malignancy that accounts for ∼10% of all hematologic malignancies.1 The introduction of novel substances, such as the immunomodulatory drugs (IMiDs) lenalidomide and thalidomide, proteasome inhibitors, and monoclonal antibodies, has greatly improved treatment response and survival within the past 2 decades.1 Transplantation-eligible, fit patients undergo 1 or 2 cycles of high-dose melphalan and autologous stem cell transplantation subsequent to several cycles of induction therapy.2 Lenalidomide maintenance therapy has improved progression-free survival (PFS) in this setting; however, a beneficial effect of lenalidomide maintenance therapy on overall survival (OS) has been inconsistent in several studies.3–8 Despite the high need for predictive markers of response to lenalidomide maintenance therapy, they have remained elusive.
We have shown that IMiDs exert anti-myeloma activity via destabilization of different, mostly metabolically active transmembrane complexes by means of interfering with the quality control function of CRBN, in addition to the established degradation of neosubstrates, such as IKZF1 and IKZF3.9–12 Among these, CD147 and MCT1 form a heterodimeric transmembrane complex that functions as a transporter of monocarboxylates, such as lactate, a function of vital importance for the survival of cancer cells, particularly within the hypoxic environment of the bone marrow.13,14 MCT1 and CD147 are upregulated in MM and have been shown to be essential for proliferation and survival of MM cells.15–17 Persistence of MCT1 and CD147 expression upon lenalidomide treatment is associated with IMiD resistance in samples from patients with primary MM samples, and overexpression of the complex attenuates IMiD efficacy in MM xenograft models.9 Against this background, we investigated gene expression levels of MCT1 and CD147 in 654 patients with MM treated with lenalidomide, thalidomide, or bortezomib maintenance and found that high MCT1 expression significantly correlated with short PFS and OS in patients who receive IMiD maintenance therapy. These findings were functionally validated in human multiple myeloma cell lines (HMCLs) and in MM xenograft models.
Methods
CD138-purified myeloma cell samples of 1486 patients with plasma cell disorders at different stages of MM were investigated by gene expression profiling (GEP), using U133 2.0 plus DNA microarrays for expression of MCT1 (202235_at) and CD147 (208677_s_at).18,19 The presence and absence of gene expression were determined by using the presence-absence calls with negative probesets (PANP) algorithm.20 “Low” and “high” levels of expression were determined by using maximally selected rank statistics. Gene expression from the study patients was validated by RNA sequencing (RNA-seq), which was performed as previously described.18,19,21 Of those patients, 654 received high-dose melphalan and autologous stem cell transplantation and maintenance with bortezomib (n = 101), thalidomide (n = 98), or lenalidomide (n = 455) as the first-line treatment within 2 phase 3 clinical trials of the German-speaking Myeloma Multicenter Group (GMMG) (GMMG-HD4 and GMMG-MM5; EudraCT 2004-000944-26 and 2010-019173-16). The correlation of CD147 and MCT1 with PFS and OS was determined. Survival curves and median time to progression were computed with nonparametric survival estimates for censored data using the Kaplan-Meier method. Differences between the curves were tested using the G-ρ log-rank test. Landmark analysis was performed by defining an alternative starting point (landmark) at 12 months. The study was in accordance with the ethical standards of the participating institutions and national research committee and with the 1964 Helsinki Declaration and its later amendments or comparable ethical standards. Written informed consent was obtained from each patient before participation in the studies.
The HMCLs MM1S (ATCC: CRL-2974) and U266 (DSMZ: ACC-9) cells were cultured in RPMI-1640 (Gibco) with 10% heat-inactivated fetal bovine serum and 1% penicillin-streptomycin. Cells with lentiviral overexpression of CD147 or MCT1 were generated as previously described.9 The cells were treated with lenalidomide (Sigma) or bortezomib (Sigma) at the concentrations indicated in the respective figure legends, and proliferation was assessed by using trypan blue exclusion.
For xenograft experiments 0.6 × 10⁷ MM cells were mixed with Matrigel Basement Membrane Matrix (BD Bioscience) at a 1:1 ratio and injected subcutaneously into the opposite flanks of female NOD SCID mice at 8 to 10 weeks of age (Janvier). After tumor engraftment, the mice were randomly assigned to receive lenalidomide (30 mg/kg) in 0.5% carboxymethylcellulose and 0.25% Tween 80 in deionized water, by daily oral gavage; IV bortezomib (0.5 mg/kg every 72 h); or vehicle control and imaged by 18F-fluorodeoxyglucose positron emission tomography/magnetic resonance imaging on day 7 of treatment. Tumor growth was monitored by caliper measurements. The mice were housed in specific pathogen–free conditions, and the animal experiments were conducted with permission from the District Government of Upper Bavaria. Immunohistochemistry, cell extract preparation, and western blot analysis were performed as previously described.9,10,22
Results and discussion
Expression of MCT1 determines PFS and OS in patients receiving IMiD-based maintenance therapy
First, we performed GEP of MM samples of 1486 patient to determine MCT1 expression in plasma cell disorders at different stages of the disease. Expression was validated by RNA-seq (supplemental Figure 1A). MCT1 expression was not only elevated when compared with normal plasma cells, but increased steadily with the progression state of plasma cell disorders, with the highest levels observed in patients with relapsed MM and in MM cell lines (Figure 1A).
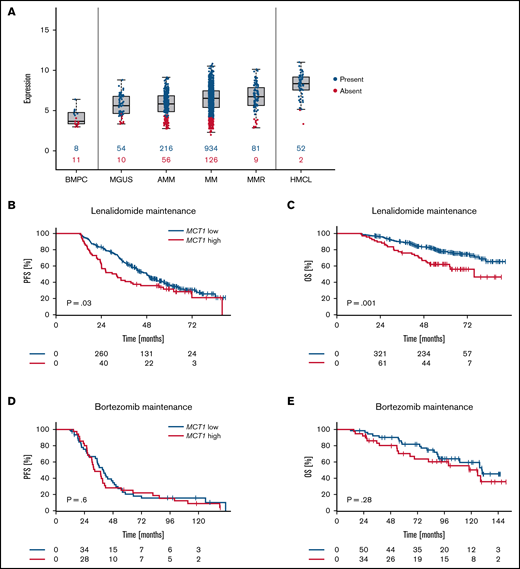
Expression of MCT1 determines PFS and OS in patients receiving IMiD-based maintenance therapy. (A) MCT1 gene expression in plasma cell disorders (n = 1486) and normal bone marrow plasma cells (BMPC, n = 19). MGUS, monoclonal gammopathy of unknown significance; AMM, asymptomatic MM; MM, previously untreated, therapy-requiring MM; MMR, relapsed/refractory MM; and HMCL, human myeloma cell line. Numbers in blue (red) indicate the number of patients expressing (not expressing) MCT1. (B-E) Landmark analysis of patients with MM who underwent maintenance treatment after autologous stem cell transplantation. Expression of MCT1 was assessed by gene expression profiling in CD138-purified myeloma cell samples and correlated with PFS and OS data. P-values are log-rank. (B) PFS of 455 patients who underwent lenalidomide maintenance therapy in the GMMG-MM5-trial (31.9 months vs 48.2 months; MCT1high vs MCT1low). (C) OS of 455 patients who underwent lenalidomide maintenance therapy in the GMMG-MM5-trial (75.9 months vs not reached months; MCT1high vs MCT1low). (D) PFS of 62 patients who underwent bortezomib maintenance therapy in the GMMG-MM4-trial (39.8 months vs 32.6 months; MCT1high vs MCT1low). (E) OS of 101 patients who underwent bortezomib maintenance therapy in the GMMG-MM4-trial, 125.8 months vs 129.8 months; MCT1high vs MCT1low).
Expression of MCT1 determines PFS and OS in patients receiving IMiD-based maintenance therapy. (A) MCT1 gene expression in plasma cell disorders (n = 1486) and normal bone marrow plasma cells (BMPC, n = 19). MGUS, monoclonal gammopathy of unknown significance; AMM, asymptomatic MM; MM, previously untreated, therapy-requiring MM; MMR, relapsed/refractory MM; and HMCL, human myeloma cell line. Numbers in blue (red) indicate the number of patients expressing (not expressing) MCT1. (B-E) Landmark analysis of patients with MM who underwent maintenance treatment after autologous stem cell transplantation. Expression of MCT1 was assessed by gene expression profiling in CD138-purified myeloma cell samples and correlated with PFS and OS data. P-values are log-rank. (B) PFS of 455 patients who underwent lenalidomide maintenance therapy in the GMMG-MM5-trial (31.9 months vs 48.2 months; MCT1high vs MCT1low). (C) OS of 455 patients who underwent lenalidomide maintenance therapy in the GMMG-MM5-trial (75.9 months vs not reached months; MCT1high vs MCT1low). (D) PFS of 62 patients who underwent bortezomib maintenance therapy in the GMMG-MM4-trial (39.8 months vs 32.6 months; MCT1high vs MCT1low). (E) OS of 101 patients who underwent bortezomib maintenance therapy in the GMMG-MM4-trial, 125.8 months vs 129.8 months; MCT1high vs MCT1low).
GEP and RNA-seq correlation with PFS and OS data of 455 patients who received maintenance treatment with the IMiD lenalidomide showed significantly reduced PFS (31.9 months vs 48.2 months in MCT1high vs MCT1low; P = .03) and OS (75.9 months vs not reached [NR] in MCT1high vs MCT1low; P = .001) in patients with high expression levels of MCT1 (Figure 1B-C). Patients treated in an independent cohort by maintenance with the IMiD thalidomide, likewise showed significantly shorter OS (83.6 months vs NR in MCT1high vs MCT1low; P = .03) with high MCT1 expression levels, and displayed a trend toward reduced PFS (34.8 months vs 43.7 months in MCT1high vs MCT1low; P = .23) that was not statistically significant (supplemental Figure 2A-B). These findings validate MCT1 as a biomarker for IMiD maintenance in an independent cohort. The somewhat lower predictive effect of MCT1 expression on thalidomide maintenance therapy, as compared with lenalidomide, corresponds well to a lower activity of this drug in terms of destabilizing MCT1.9 By contrast, MCT1 expression had no effect on PFS (39.8 months vs 32.6 months in MCT1high vs MCT1low; P = .6) and OS (125.8 months vs 129.8 months in MCT1high vs MCT1low; P = .28; Figure 1D-E) in patients receiving bortezomib-based maintenance, thus underscoring a specific prognostic value of MCT1 expression on lenalidomide maintenance. MCT1 expression was not associated with high-risk chromosomal aberrations, Revised-International Staging System score, or GEP-based high-risk scores. Expression of CD147 was not predictive of the outcome of lenalidomide maintenance (supplemental Figure 3A-B). This finding is in line with a low variation of CD147 expression at the mRNA level (supplemental Figures 1B and 3C) and previous observations demonstrating a posttranslational dependency of CD147 protein expression on MCT1 expression.13,15,23 It is therefore conceivable, that a dependency of lenalidomide maintenance on CD147 would become evident only on the protein level. These protein data, however, are not available for the investigated cohort of patients with MM.
Overexpression of MCT1 attenuates lenalidomide cytotoxicity in vitro and in vivo
Next, we validated the findings in cell culture models of HMCLs. Two cell lines, MM1S and U266 were infected with lentivirus to induce forced protein expression of both MCT1 or CD147 and subjected to lenalidomide or bortezomib treatment. Indeed, overexpression of MCT1 in MM cells significantly reduced sensitivity to lenalidomide treatment (Figure 2A-B), thereby functionally validating the predictive significance of MCT1. In contrast to the patient-derived data outlined thus far, high CD147 protein expression also attenuated lenalidomide efficacy in this model, again underscoring the notion that CD147 requires analysis on the protein level rather than on the mRNA level. By contrast, the efficacy of the proteasome inhibitor bortezomib was not affected by overexpression of MCT1 or CD147 (supplemental Figure 4A-B).
![Overexpression of MCT1 attenuates lenalidomide cytotoxicity in vitro and in vivo. (A-B) Cell proliferation analysis of MM1S (A) and U266 (B) cells, which were infected with lentivirus via control constructs (empty vector [EV]) or constructs to induce MCT1 or CD147 expression, treated with dimethyl sulfoxide (DMSO) or 10 µM lenalidomide for 72 h. (C) Quantification of tumor growth during lenalidomide or vehicle control treatment using caliper measurements (Ctrl, Len: n = 4 tumors). Xenograft tumors from U266 cells expressing MCT1 or the EV control. (D) Positron emission tomography (PET) images, using 18F-fluorodeoxyglucose, of representative immunocompromised NOD-SCID mice bearing xenograft tumors expressing MCT1 or the EV control. Images were taken after 7 days of respective treatment. Arrows indicate tumors. The color scale indicates the percentage of injected dose per gram (% ID/g). Bars represent 10 mm. (E) Total lesion glycolysis of tumors determined by PET-MRI on day 7 after respective treatments. (F) Representative immunohistochemical analysis of tumors derived from the mice shown in panel D, with histomorphology visualized with hematoxylin-eosin staining and expression of cleaved caspase 3 (CC-3), MCT1, and CD79a. Analysis was performed on 10 high-power fields for each stain. Bars represent 100 µm. (G) Quantification of CC-3 staining shown in panel F. Data are expressed as means ± standard deviation. n.s., not significant; *P < .05, **P < .01, by 1-sample t test or Student t test.](https://ash.silverchair-cdn.com/ash/content_public/journal/bloodadvances/6/2/10.1182_bloodadvances.2021005532/3/m_advancesadv2021005532f2.png?Expires=1767746762&Signature=RnkWRYIJuJwtOFKX8AEm9Zrn39lzwmdBY7Eog~W~DLx7aVCn8O~f8P398bKAN1JGYRRwnArHv4VwBVbcof5hRrv-fE80-o9kMnqeDUbHsGmC3smsvgc8O8z4akVAd3xjPDlIuJazEdsbotW0rAOGugK6eEr7tZNwYkkJGu6gksxCaLLzkldjyUofHGmY1kJ4mBo3-FP0M99mkvPpzmPP9n3AXQnk6fUaaRVpOUY~u6HwyPcxwe8F1EuG5-jPy5wUjiTObARZ3c4MDjY180rCiKlC1yrfxt4LUKGG09vmCwRGWnREqoKzBiswTN9i3ygmz9XC6O8yKnHqeFXOFlmcgA__&Key-Pair-Id=APKAIE5G5CRDK6RD3PGA)
Overexpression of MCT1 attenuates lenalidomide cytotoxicity in vitro and in vivo. (A-B) Cell proliferation analysis of MM1S (A) and U266 (B) cells, which were infected with lentivirus via control constructs (empty vector [EV]) or constructs to induce MCT1 or CD147 expression, treated with dimethyl sulfoxide (DMSO) or 10 µM lenalidomide for 72 h. (C) Quantification of tumor growth during lenalidomide or vehicle control treatment using caliper measurements (Ctrl, Len: n = 4 tumors). Xenograft tumors from U266 cells expressing MCT1 or the EV control. (D) Positron emission tomography (PET) images, using 18F-fluorodeoxyglucose, of representative immunocompromised NOD-SCID mice bearing xenograft tumors expressing MCT1 or the EV control. Images were taken after 7 days of respective treatment. Arrows indicate tumors. The color scale indicates the percentage of injected dose per gram (% ID/g). Bars represent 10 mm. (E) Total lesion glycolysis of tumors determined by PET-MRI on day 7 after respective treatments. (F) Representative immunohistochemical analysis of tumors derived from the mice shown in panel D, with histomorphology visualized with hematoxylin-eosin staining and expression of cleaved caspase 3 (CC-3), MCT1, and CD79a. Analysis was performed on 10 high-power fields for each stain. Bars represent 100 µm. (G) Quantification of CC-3 staining shown in panel F. Data are expressed as means ± standard deviation. n.s., not significant; *P < .05, **P < .01, by 1-sample t test or Student t test.
Overexpression of MCT1 attenuates lenalidomide cytotoxicity in vitro and in vivo. (A-B) Cell proliferation analysis of MM1S (A) and U266 (B) cells, which were infected with lentivirus via control constructs (empty vector [EV]) or constructs to induce MCT1 or CD147 expression, treated with dimethyl sulfoxide (DMSO) or 10 µM lenalidomide for 72 h. (C) Quantification of tumor growth during lenalidomide or vehicle control treatment using caliper measurements (Ctrl, Len: n = 4 tumors). Xenograft tumors from U266 cells expressing MCT1 or the EV control. (D) Positron emission tomography (PET) images, using 18F-fluorodeoxyglucose, of representative immunocompromised NOD-SCID mice bearing xenograft tumors expressing MCT1 or the EV control. Images were taken after 7 days of respective treatment. Arrows indicate tumors. The color scale indicates the percentage of injected dose per gram (% ID/g). Bars represent 10 mm. (E) Total lesion glycolysis of tumors determined by PET-MRI on day 7 after respective treatments. (F) Representative immunohistochemical analysis of tumors derived from the mice shown in panel D, with histomorphology visualized with hematoxylin-eosin staining and expression of cleaved caspase 3 (CC-3), MCT1, and CD79a. Analysis was performed on 10 high-power fields for each stain. Bars represent 100 µm. (G) Quantification of CC-3 staining shown in panel F. Data are expressed as means ± standard deviation. n.s., not significant; *P < .05, **P < .01, by 1-sample t test or Student t test.
To confirm these findings in vivo, we established a xenograft model using U266 cells with control (empty vector) or MCT1 overexpression. After tumor engraftment mice were randomly assigned to receive lenalidomide, bortezomib, or control treatment. In line with our in vitro data, induced overexpression of MCT1 protected the tumors from the anti-myeloma activity of lenalidomide (Figure 2C-E; supplemental Figure 4D-F). Again, the cytotoxic effects of bortezomib treatment were not impaired by overexpression of MCT1 (Figure 2D-E; supplemental Figure 4C-F). Both lenalidomide and bortezomib treatment resulted in the induction of apoptosis. While the induction of apoptosis upon lenalidomide treatment was impaired in tumors with overexpression of MCT1, levels of cleaved caspase 3 remained unchanged by bortezomib treatment (Figure 2F-G).
We have identified MCT1 as a predictive marker for the efficacy of lenalidomide maintenance therapy in MM. To the best of our knowledge, MCT1 marks the first functionally validated biomarker for this therapeutic setting in MM. Based on our findings, patients with high expression levels of MCT1 have a reduced response to lenalidomide-based maintenance therapy and could benefit from other maintenance regimens, including proteasome inhibitors and CD38-targeting antibodies.
Acknowledgments
The authors thank Markus Mittelhäuser and Hannes Rolbieski for acquisition of positron emission tomographic/magnetic resonance images; Markus Utzt for cell sorting; Susanne Kossatz for suggestions regarding imaging analyses; Torsten Haferlach and Claudia Haferlach for providing cells of patients with primary MM; Maria Dörner, Ewelina Nickel, Birgit Schneiders, and Tomi Bähr-Ivacevic for excellent technical assistance; the Genomics Core Facility at European Molecular Biology Laboratory (EMBL), Heidelberg, Germany; the Transcriptomics Platform, INSERM, Montpellier, France; and all participating GMMG investigators and centers.
This work was supported by grants from the European Research Commission (project BCM-UPS, grant 682473) (F.B.), Deutsche Forschungsgemeinschaft grants SFB1335 (F.B. and U.K.) BA 2851/6-1 (F.B.), SFB824 (U.K.), and SFB/TRR79 (D.H. and A.S.), and the German Federal Ministry of Education (BMBF) within the framework of the e:Med research and funding concept “CLIOMMICS” under grant 01ZX1309 (F.B.), “CAMPSIMM” under grant 01ES1103.
Authorship
Contribution: F.B. and D.H. initiated the study; J. Stroh, A.S., M.H., D.H., and F.B. conceived and designed the research; J. Stroh, A.S., and M.H. performed most of the experiments and data analyses with crucial help from M.E.-R.; M.R. performed the immunohistochemical analyses; J. Slawska helped with the xenograft experiments; H.S., U.B., H.G., K.W., and C.S. provided patient data; J. Stroh, A.S., M.H., R.E., M.S., U.K., D.H., and F.B. analyzed the results; F.B. coordinated the work; J. Stroh, A.S., M.H., D.H., and F.B. wrote the manuscript; and all authors discussed the results and commented on the manuscript.
Conflict-of-interest disclosure: F.B. and U.K. received honoraria and research funding from BMS/Celgene. H.G. received grants and/or provision of investigational medicinal products from Amgen, BMS, Celgene, Chugai, Dietmar-Hopp-Foundation, Janssen, Johns Hopkins University, and Sanofi; and received research support from Amgen, BMS, Celgene, Chugai, Janssen, Incyte, Molecular Partners, Merck Sharp and Dohme (MSD), Sanofi, Mundipharma GmbH, Takeda, and Novartis; served on advisory boards of Adaptive Biotechnology, Amgen, BMS, Celgene, Janssen, Sanofi, Takeda; and received honoraria from Amgen, BMS, Celgene, Chugai, GlaxoSmithKline (GSK), Janssen, Novartis, and Sanofi. K.W. received grants from Amgen, Celgene, Sanofi, and Janssen and honoraria from Amgen, BMS, Celgene, Adaptive Biotech, Janssen, GSK, Karyopharm, Roche, Sanofi, Takeda, and Oncopeptides. H.S. received honoraria from Janssen Cilag, Takeda, Amgen, BMS/Celgene, Sanofi, Oncopeptides, Abbvie, GSK, Chugai, Pfizer, Sebia; and support for travel, accommodations, expenses from Janssen, Amgen, BMS/Celgene, Sanofi, GSK. C.S. received honoraria from Amgen, BMS, Celgene, GSK, Janssen, Novartis, MSD, Roche, Takeda; and research grants from Takeda, Janssen, and Novartis.
Correspondence: Florian Bassermann (primary contact), Department of Medicine III, Hematology and Oncology, Klinikum rechts der Isar, Technical University of Munich, Ismaninger Strasse 22, 81675 Munich, Germany; e-mail: florian.bassermann@tum.de; and Dirk Hose, VUB, Department of Hematology and Immunology, Myeloma Center Brussels, Laarbeeklaan 103, 1090 Jette, Belgium; e-mail: dirk.hose@vub.be.

