

Key Points
The clonal architecture of MM at relapse was identified using QM-FISH at the single-cell level.
The prognostic values of different clonal evolution patterns were explored in large-scale clinical analysis.

Abstract
Single-cell analysis is of significant importance in delineating the exact phylogeny of the subclonal population and in discovering subtle diversification. So far, studies of intratumor heterogeneity and clonal evolution in multiple myeloma (MM) were largely focused on the bulk tumor population level. We performed quantitative multigene fluorescence in situ hybridization (QM-FISH) in 129 longitudinal samples of 57 MM patients. All the patients had newly diagnosed and relapsed paired samples. An expanded cohort of 188 MM patients underwent conventional FISH (cFISH) to validate the cytogenetic evolution in bulk tumor level. Forty-three of 57 patients (75.4%) harbored 3 or 4 cytogenetic clones at diagnosis. We delineated the phylogeny of the subclonal tumor population and derived the evolutionary architecture in each patient. Patients with clonal stabilization had a significantly improved overall survival (OS) than those with other evolutionary patterns (median OS, 71.2 months vs 39.7 months vs 35.2 months vs 25.5 months, for stable, differential, branching, and linear patterns, respectively; P = .001). A high degree of consistency and complementarity across QM-FISH and cFISH was observed in the evaluation of cytogenetic evolution patterns in MM. Survival after relapse was greater influenced by the presence of high-risk aberrations at relapse (hazard ratio = 2.07) rather than present at diagnosis (hazard ratio = 1.55). This study shows that QM-FISH is a valuable tool to elucidate the clonal architecture at the single-cell level. Clonal evolution pattern is of prognostic significance, highlighting the need for repeated cytogenetic evaluation in relapsed MM.
Introduction
The contribution of intratumoral heterogeneity and clonal evolution to therapy resistance and disease progression is increasingly corroborated in cancers.1 Multiple myeloma (MM) provides an excellent model to understand the evolutionary processes underlying disease relapse. The recent advancement in cytogenetic and parallel sequencing studies has partly inferred the genomic complexity in MM.2-6 Emerging computational tools such as PhylogicNDT were developed to infer the order of clonal driver events and construct the phylogeny tree.7 However, most of these studies were largely focused on the bulk tumor population level. Given the limitations of bulk analysis, the strategies of determining a genetic alteration as a clone or subclone are mainly based on the proportion of tumor cells bearing each variant in a bulk sample, and therefore lack the resolution and accuracy for characterizing small subpopulations and tracking the definite evolution pattern.4-6 In such cases, the historical timing and clonal architecture of critical genetic events could be buried unless clonal dominance occurs.
Single-cell analysis provides new perspectives in delineating the exact phylogeny of subclonal populations and in discovering subtle diversification. There are limited genetic single-cell studies so far which yield insight into the existence of clonal diversity of MM and its evolution.8-10 However, the cohort size of these studies has curtailed the ability to infer the clonal architecture. Besides, the small number of longitudinal samples has limited the ability to determine the clonal evolution in correlation to therapy resistance and clinical outcomes. The clinical impact of clonal phylogeny and evolution is still poorly understood. Quantitative multigene fluorescence in situ hybridization (QM-FISH) is a cytological high-resolution technique that enables the detection of multiple chromosomal changes synchronously in individual nuclei.11,12 QM-FISH has been used to provide direct evidence for the genetic diversity of tumor cells within individual patients in hematologic malignancies.13,14 Here, we identified the clonal architecture of different time points using QM-FISH at the single-cell level and explored the prognostic values of different clonal evolution patterns in a large-scale clinical analysis.
Methods
Patients and samples
We performed QM-FISH of 157 sequential samples from 57 MM patients and expanded the analysis with cFISH in 376 paired untreated/relapsed samples from 188 patients, including the above-mentioned 57 cases and 131 nonoverlapping cases. All samples were collected from cases in the prospective, nonrandomized clinical trial (BDH 2008/02) approved by the Institute of Hematology & Blood Diseases Hospital, Chinese Academy of Medical Science & Peking Union Medical College. The clinical and cytogenetic features of patients at diagnosis are summarized in supplemental Table S1. The treatment regimen was described in previous studies.15,16 Briefly, patients were assigned to either the immunomodulatory agents-based therapy or proteasome inhibitors-based treatment. After at least 4 cycles of therapy with at least partial remission, patients underwent either autologous stem cell transplant or 2 more cycles of consolidation therapy. Informed consent to participate in the study was obtained. This study was conducted in accordance with the Declaration of Helsinki and approved by the local institutional ethics committees.
Specimen and probes preparation
FISH analysis was performed on bone marrow (BM) samples using sorted plasma cells. Plasma cells were purified from by Miltenyi technology (anti-CD138 coated magnetic beads, Paris, France) at a purity of more than 95%. The following probes were used in the QM-FISH panel: del(17p) (TP53), del(13q) (RB1), del(16q) (CYLD), del(11q) (cIAP), and 1q21gains (CKS1B). The 5 probes were designed based on the UCSC (University of California, Santa Cruz) genome browser database (http://genome.ucsc.edu/). Bacterial artificial chromosome plasmid that targets these 5 genes was extracted using the plasmid purification kit (Qiagen, Hilden, Germany) according to the instructions provided by the manufacturer, digested with EcoRI (Sigma, St. Louis, MO), and purified. The purified DNA probes for del(17p) (TP53), del(13q) (RB1), del(16q) (CYLD), del(11q) (cIAP), and 1q21 gains (CKS1B) were labeled by nick-translation with green dUTP (green, Abbott Molecular, Abbott Park, IL), PromoFluor-555-aadUTP (orange, PromoKine, Heidelberg, Germany), PromoFluor-590-aadUTP (red, PromoKine, Heidelberg, Germany), HyPer5 dCTP (infrared, GE Healthcare), and PromoFluor-415-aadUTP (light blue, PromoKine, Heidelberg, Germany), respectively.11,12 The specificity and sensitivity of these probes were confirmed using human dermal fibroblasts cell line prior to hybridization of MM samples.
Cytogenetic evolution analysis by QM-FISH
Fields within the 4', 6-diamidino-2-phenylindole dihydrochlorideand (DAPI) stained nuclear outline (dark blue) were chosen for the acquisition of images of DAPI, Green, Cy3v1, Texas Red, and Zeiss PF415 with a ×630 objective lens under a Zeiss Axioplan laser-scanning confocal microscope (Zeiss, Oberkochen, Germany) with a high-resolution, charge-coupled camera. The images were analyzed using a computer loaded with Axio Vision software. Each field was documented for 10 slices and merged using the background extension. The signal patterns of at least 200 nonoverlapping cell nuclei were analyzed per sample. The exact copy number in the nucleus of each gene was recorded. The presence of gene amplification or deletion was identified when the copy number in over 10% of the nucleus of each section was above or under the DNA ploidy number. The clone that was most frequently detected in a sample was regarded as the predominant clone, and other clones were subclones. In clonal evolution paths analysis, subclones with multiple abnormalities were determined to be genuine instead of resulting from signal dropout if they were observed in more than 2% of the nucleus of a sample.
Conventional FISH studies
cFISH analyses were performed on CD138-purified plasma cells using the following probes: 13q14(RB-1), 17p13.1(TP53), 1q21, 14q32 (5'IGH,3'IGH), t(11;14), t(4;14), and t(14;16) as described previously.15,16 At least 200 interphase nuclei were analyzed, and the threshold for all aberrations was set at 10%. High-risk cytogenetic abnormalities were defined by the presence of del17p, t(4;14), or t(14;16). The clone size of an abnormality was defined as the fraction of observed interphase nuclei harboring the certain abnormality. In clonal evolution analysis, obvious change in clone size was identified if the cell fraction was increased or decreased by more than 50% after relapse.
Statistical analysis
Primary endpoints were failure-free survival (FFS) and overall survival (OS). First FFS was calculated from diagnosis to first relapse, as well as the interval between first and second sampling. Second FFS was defined as the FFS after the second sampling. First OS was measured from the initiation of treatment to the date of death or last follow-up. Second OS was defined as survival after second sampling. The Kaplan-Meier method and log-rank test were used to analyze differences in survival times between subgroups. A two-sided Fisher exact test or χ-squared test was used to compare categorical parameters. Student t or Mann-Whitney U tests were used to examine differences between continuous variables. Spearman correlation was used to access the association between 2 variables. P < .05 was considered statistically significant. Analyses were carried out with R version 3.6.2 or SPSS Version 21.0 software (version 21.0, IBM, Chicago, IL).
Results
Clonal heterogeneity and phylogeny of critical cytogenetic aberrations in MM
We performed QM-FISH in 129 longitudinal samples of 57 MM patients. All the patients had newly diagnosed and first-relapsed paired samples and 12 patients had a cytogenetic evaluation for more than 2 time points, including second-relapsed or post-treatment samples. A median of 4 subclones (range 2 to 6) were distinguished at the first time sampling of each patient. We make a brief illustration for patient #20 as follows. Five cytogenetic abnormalities were examined in 200 plasma cells by QM-FISH (Figure 1A). In the newly diagnosed sample of this patient, the most recurrent alternative was 13q deletion (192/200, 96.0%), following with 1q21 gain observed in 126/200 (63.0%) cells. 11q and 16q deletion was shown as a subclonal level. We defined 6 subclones after clustering of the genetic events of single cells (Figure 1A). Thus, a stepwise process of cytogenetic alternation was observed, and a most plausible tumor phylogeny was proposed in this case (Figure 1B). It is common to find 2 or more cooccuring abnormalities in a sample. Briefly, if there are 2 subclones in the sample, 1 with only alteration A and the other with both alteration A and B, it suggests the possibility that alternation A can be detected at an early stage while alternation B tends to serve as a passenger event. Thus, we can conclude that A occurred prior to B, excluding the unlikely occurrence of acquiring and then losing an abnormality (Figure 1C).
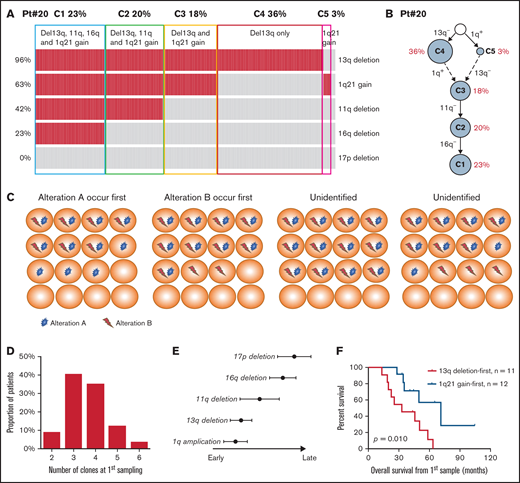
(A) The heatmap showing the cytogenetic pattern of patient #20. Each row represents a specific kind of cytogenetic abnormality while each column represents 1 cell. In total, 5 cytogenetic abnormalities were examined in 200 plasma cells. Cells are clustered into 5 subgroups. (B) Plausible clonal phylogeny tree for patients in (A) (C) Diagrams of identifying the historical timing and sequence of critical cytogenetic events by QM-FISH. (D) Number of cytogenetic clones at first time-point sampling. (E) Timeline of different cytogenetic events in MM. Timing on the x-axis is from early to late. (F) Kaplan-Meier curves of overall survival for patients with different sequences of 13q deletion and 1q21 gain occurrence.
(A) The heatmap showing the cytogenetic pattern of patient #20. Each row represents a specific kind of cytogenetic abnormality while each column represents 1 cell. In total, 5 cytogenetic abnormalities were examined in 200 plasma cells. Cells are clustered into 5 subgroups. (B) Plausible clonal phylogeny tree for patients in (A) (C) Diagrams of identifying the historical timing and sequence of critical cytogenetic events by QM-FISH. (D) Number of cytogenetic clones at first time-point sampling. (E) Timeline of different cytogenetic events in MM. Timing on the x-axis is from early to late. (F) Kaplan-Meier curves of overall survival for patients with different sequences of 13q deletion and 1q21 gain occurrence.
Take it together, intraclonal genetic diversity is a common feature of MM patients. Forty-three of 57 patients (75.4%) harbored 3 or 4 cytogenetic clones at first time point sampling (Figure 1D). We delineated the phylogeny of the subclonal tumor population in each patient and established robust trends for the timing of temporal acquisition in the whole cohort using the pairwise precedence mentioned above. 13q deletion and the first 1q gain tended to be earlier cytogenetic alternation, whereas 16q and 17p deletion were acquired later (Figure 1E). Subclones carrying both 13q deletion and 1q gain were detected in 28 patients at diagnosis. The sequence of 13q deletion and 1q21 gain occurrence was identified in 23 patients by the single-cell analysis. 1q21 gain and 13q deletion each occurred first in 12 and 11 patients, respectively. Strikingly, patients in whom 13q deletion was acquired first showed a significantly worse survival than 1q21 gain-first patients (median OS from first sampling 32.9 months vs 71.2 months, P = .010; Figure 1F). It indicated that the disease seemed to be more aggressive if 1q21 gain is arisen after 13q deletion rather than presented as an initial driver alteration. These data suggest that order influences outcome, although this small retrospective study requires confirmation in a prospective larger cohort.
Four evolutionary patterns identified by QM-FISH
Clonal evolution patterns were visualized at single-cell levels identified by QM-FISH. We inferred the most likely ancestral relationships between subclones and derived the evolutionary architecture in each patient (supplemental Figure 1). The evolutionary architectures observed were diverse in different patients. Four distinct evolutionary patterns were identified (Figure 2). Eighteen of 57 (31.6%) patients showed clonal stabilization. These patients were characterized by no novel subclones emerging and no existing subclones disappearing at relapse. Subclones observed in <10% single cells were not involved in defining the evolutionary patterns. There might be some minor change in subclonal construction, but the predominant clone in the 2 time-point samplings remained unchanged. Differential evolution was observed in 12 patients (21.1%), where clonal dynamics resulted from a change in the predominant clone from presentation to relapse. The predominant clone at diagnosis disappeared or decreased to a minor clone, while a subclone showed growth advantage and turned to be a predominant clone at relapse. We found evidence of branching evolution in 9 patients (15.8%). Here, 1 or more clones harboring novel cytogenetic abnormalities emerged between the early and late time points, whereas some disappeared. The remainder of patients demonstrated a linear evolution pattern (18/57, 31.6%). The predominant clones acquired 1 or more novel cytogenetic abnormalities at the later time point. 17p deletion was the most frequently acquired cytogenetic abnormality, observed in 10/18 patients, following with 1q gain (n = 8) and 16q deletion (n = 3).
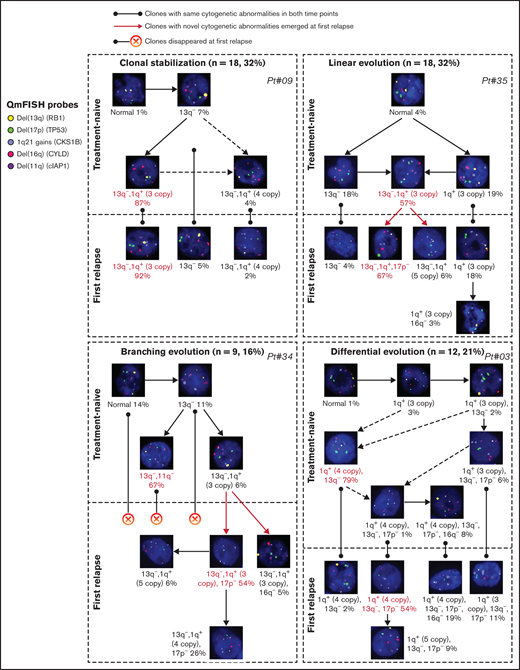
Examples of 4 evolutionary patterns identified by QM-FISH. The major clone in each sampling time point was marked as red.
Examples of 4 evolutionary patterns identified by QM-FISH. The major clone in each sampling time point was marked as red.
Surprisingly, the pattern of cytogenetic evolution could not be predicted by the number of cytogenetic clones at first time-point sampling (supplemental Figure 2A). Patients with stable progression showed similar clonal heterogeneity at presentation compared with those with a linear or branching evolution. However, the construction of subclones in earlier time points was associated with evolutionary patterns. The incidence rate of high-risk abnormalities at baseline was significantly lower in patients with clonal stabilization (P < .01; supplemental Figure 2B). The 4 evolutionary patterns of cytogenetic abnormalities exerted a significant impact on survival (Figure 3). Patients with clonal stabilization had a significantly improved OS than those with other evolutionary patterns (median first OS, 71.2 months vs 39.7 months vs 35.2 months vs 25.5 months for stable, differential, branching, and linear patterns, respectively, P = .001; Figure 3). However, there is no difference in sampling interval among 4 evolutionary patterns (first FFS, P = .131; Figure 3A). Therefore, the survival differences were mostly attributable to a significantly shorter FFS after relapse (second FFS, P < .001; Figure 3B).
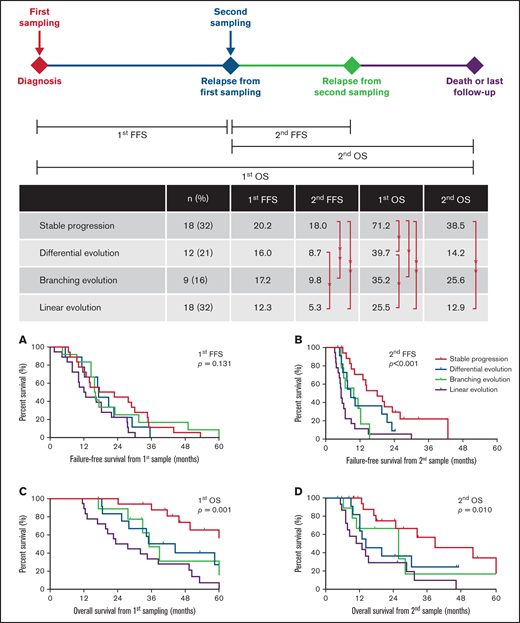
Distribution and survival analysis for patients with 4 evolutionary patterns. Different landmarks are used: (A) FFS from first sampling (first FFS), (B) FFS from second sampling (second FFS), (C) OS from first sampling (first OS), and (D) OS from second sampling (second OS).
Distribution and survival analysis for patients with 4 evolutionary patterns. Different landmarks are used: (A) FFS from first sampling (first FFS), (B) FFS from second sampling (second FFS), (C) OS from first sampling (first OS), and (D) OS from second sampling (second OS).
Expand the cohort to stratify evolution by cFISH
In order to evaluate the accuracy of abnormalities detection by QM-FISH, we performed cFISH in these 57 MM patients. Cell fractions of cytogenetic abnormalities detected by QM-FISH were significantly correlated with those detected by cFISH (P < .001; Figure 4A). That indicated QM-FISH detected multiple cytogenetic abnormalities at the same time in a single cell without decreasing the recognition accuracy rate. Patients were divided into 3 groups by cFISH: without either new required abnormalities or obvious change in fraction (n = 22, 39%); without new abnormalities but with obvious change in fraction of abnormalities (n = 13, 23%); and with new required abnormalities at relapse (n = 22, 39%). We found 18 out of 22 patients (82%) in the first group were characterized as stable evolution by QM-FISH. Moreover, among the 22 patients in the third group identified by cFISH, 16 (73%) had linear evolution while 5 (23%) had branching evolution (Figure 4B). Therefore, a high degree of consistency and complementarity across cFISH and QM-FISH was observed in the evaluation of cytogenetic evolution patterns in MM.
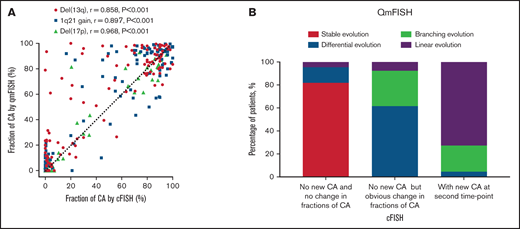
Comparison of detection of cytogenetic abnormalities (CA) by cFISH and QM-FISH. (A) Correlation of fraction of CA detected by cFISH and QM-FISH. (B) Distribution of 4 evolutionary patterns among different cytogenetic evolution groups stratified by cFISH.
Comparison of detection of cytogenetic abnormalities (CA) by cFISH and QM-FISH. (A) Correlation of fraction of CA detected by cFISH and QM-FISH. (B) Distribution of 4 evolutionary patterns among different cytogenetic evolution groups stratified by cFISH.
We then expanded our cohort to further discuss the prognostic value of cytogenetic evolution. In total, at least 2 time point cytogenetic evaluations by cFISH were undergone in 188 MM patients, including the diagnostic and relapsed specimens. The median interval between the 2 time point cytogenetic evaluations was 19 months (range, 2 months to 76 months). The proportion of patients with high-risk cytogenetic features was 33% at diagnosis and 49% at relapse (Figure 5A). This increased proportion was largely due to the newly emerging 17p deletion. Most of the del(17p) at relapse were deleted at a high clone size (supplemental Figure 3A). Consistent with our previous study,17 patients with del(17p) in a percentage of >50% at relapse displayed the most dismal outcome, whereas the other curves did not distinctly separate (supplemental Figure 3B). However, the number of patients with 10% to 20% del(17p) was relatively small (n = 4). The prognostic impact of the small fraction of del(17p) at relapse should be validated in larger cohorts of patients.
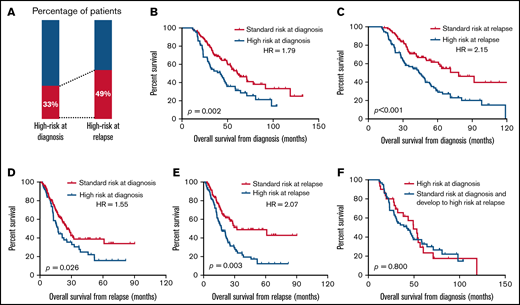
The prognostic significance of high-risk aberrations that are present at baseline or at relapse. (A) Proportion of patients with high-risk aberrations present at diagnosis and at relapse. (B-E) Kaplan-Meier curves estimates for survival in patients with the presence of high-risk aberrations at diagnosis (B,D) and patients with the presence of high-risk aberrations at relapse (C,E). Different landmarks are used: OS from diagnosis (B,C) and OS from relapse (D,E). (F) Kaplan-Meier curves in patients with high-risk aberrations at diagnosis.
The prognostic significance of high-risk aberrations that are present at baseline or at relapse. (A) Proportion of patients with high-risk aberrations present at diagnosis and at relapse. (B-E) Kaplan-Meier curves estimates for survival in patients with the presence of high-risk aberrations at diagnosis (B,D) and patients with the presence of high-risk aberrations at relapse (C,E). Different landmarks are used: OS from diagnosis (B,C) and OS from relapse (D,E). (F) Kaplan-Meier curves in patients with high-risk aberrations at diagnosis.
The inferior outcomes were observed regardless of whether the occurrence of high-risk aberrations was early at diagnosis or late after relapse (Figure 5B,C). Moreover, the prognostic value of the presence of high-risk aberrations at diagnosis was attenuated over time (hazard ratio [HR]= 1.79, P = .002 for survival from diagnosis; HR = 1.55, P = .026 for survival from relapse; Figure 5B,D). Survival from relapse was greater influenced by the presence of high-risk aberrations at relapse (HR = 2.07; Figure 5E) rather than present at diagnosis (HR = 1.55; Figure 5D). There was no difference in OS for patients who had primary high-risk aberrations at diagnosis compared with those who developed high-risk aberrations after relapse (P = .800; Figure 5F). These results indicated that patients may benefit from the repeated cytogenetic evaluation, especially for the prediction of survival after relapse.
In total, 72 out of 188 patients (38%) developed new cytogenetic abnormalities after relapse. The remaining 78 patients (41%) observed an obvious elevation in the fraction of cells with a certain abnormality. 17p deletion was the most common of the new abnormalities (43/72, 60%), following with de novo 1q21 gain (35/72, 49%). Both the patients with newly acquired high-risk abnormalities and those with newly acquired standard-risk abnormalities experienced worse outcomes than those without new abnormalities after relapse (P < .001). However, the type of the new abnormalities did not significantly impact survival (supplemental Figure 4). The occurrence of cytogenetic evolution in each patient is further demonstrated in supplemental Figure 5A. The presence of IGH translocation was not associated with increased odds of new abnormalities after relapse (supplemental Figure 5B-E). Patients with newly acquired abnormalities and patients with an obviously changed fraction experienced significantly inferior outcomes than those with stable cytogenetic architecture at relapse (P < .001; supplemental Figure 5E,F).
Clonal evolutions of 1q21
The impact of 1q21 gain/amplification at primary diagnosis on survival has been evaluated in our previous study.18 The present study investigated the prognostic value of evolution in copy number or clone size of 1q21 gain/amplification during follow-up. The incidence of patients carrying at least 3 copies of 1q21 was higher after relapse than at diagnosis (69% vs 55%, P = .004). Patients were categorized into 6 groups according to the change patterns in copy number and clone size of 1q21 gain between the 2 time-point samplings (Figure 6A). Patients without 1q21 gain/amplification at both time points (group B) and patients who had an obvious decrease in clone size or loss of 1q21 gain at relapse (group A) experienced similar superior outcomes (second FFS 18.1 months vs 27.8 months, P = .469), whereas patients carrying 1q21 gain/amplification at both time points with or without increase in clone size (groups C and D) had a relatively worse survival (second FFS 12.4 months and 10.5 months, respectively, P < .05, compared with groups A and B). The remaining patients who had an increase in copy number of 1q21 and those who developed de novo 1q21 gain at relapse observed the poorest outcome (groups E and F, second FFS 6.7 months and 8.9 months; Figure 6B). The interval time between 2 time-point samplings was similar among groups, whereas the different evolution patterns of 1q21 gain could clearly stratify both overall survival and postrelapse survival (P < .001; Figure 6C, D).
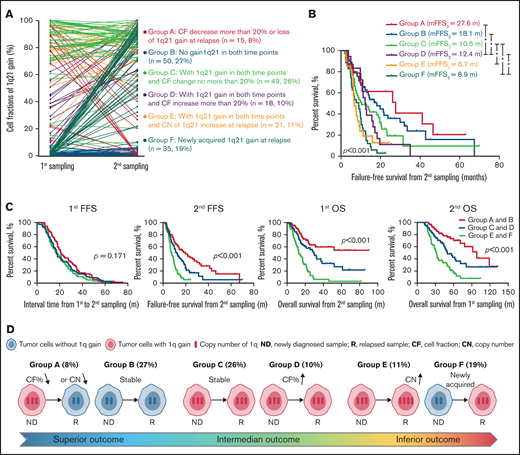
Clonal evolution in patients with gain/amplification of 1q21. (A) The change in cell fraction and copy number of 1q21 gain between the 2 time-point samplings. Different color demonstrates 6 different changing patterns. (B) Failure-free survival from second sampling among patients with different 1q21 evolutionary patterns. (C) Six 1q21 evolutionary patterns are merged to 3 groups according to the survival curves. Kaplan-Meier plots for first FFS, second FFS, first OS, and second OS are presented in patients with different groups. m, months. (D) Diagram of different kinds of evolution in copy number or clone size of 1q21 gain during follow-up.
Clonal evolution in patients with gain/amplification of 1q21. (A) The change in cell fraction and copy number of 1q21 gain between the 2 time-point samplings. Different color demonstrates 6 different changing patterns. (B) Failure-free survival from second sampling among patients with different 1q21 evolutionary patterns. (C) Six 1q21 evolutionary patterns are merged to 3 groups according to the survival curves. Kaplan-Meier plots for first FFS, second FFS, first OS, and second OS are presented in patients with different groups. m, months. (D) Diagram of different kinds of evolution in copy number or clone size of 1q21 gain during follow-up.
Discussion
Although the treatment options for relapsed patients have increased, MM remains an incurable disease. The general tendency of the disease course was unable to be altered. Clonal evolution is one of the most essential factors underlying the intractability of cancer. Previous studies support that MM develops through a multistep process via the acquisition of sequential genetic hits. Because the sequential samples were difficult to collect completely, sample size and clinical data were not enough to investigate clonal evolution paths and their clinical characteristics.6,19-20 Therefore, the full clinical impact of intraclonal heterogeneity and clonal evolution has, to date, not been completely evaluated, and it is of primary importance to understand its clinical implications.
Risk-adapted therapy strategies based on cytogenetic evaluation at diagnosis have become the cornerstone of contemporary clinical practice.21 Although a considerable quantity of cytogenetic aberrations has been reported, only a small proportion tend to be determining factors of MM development and clinical outcome.22-24 Therefore, we chose 5 important genetic events to track the evolution of crucial abnormalities during the disease course: del(17p), del(13q), del(16q), del(11q), and 1q21 gain. FISH is still the most precise and rapid tool to assess copy numbers variation in tumor samples due to its simplicity and reliability for key biomarkers research. cFISH is the gold standard to identify the cytogenetic alterations and guide prognostic stratification in MM.21,25,26 However, conventional FISH could detect 1 or 2 abnormalities at a time. Weak signals, losing a hybridization signal, or high background may result in a relatively low signal-to-noise ratio when multiple probes are detected by cFISH. Thus, 5 cytogenetic abnormalities in individual cells could be detected by QM-FISH with enhanced resolution and high signals/noise ratio with intact nuclear morphology is reached.
Some studies deciphered the chronology of certain cytogenetic anomalies in bulk tumors, but the presence of various aberrations was not examined in the same nuclei.27,28 In our study, QM-FISH provided direct evidence regarding the relationship of different clones within a sample and identified the temporal sequence of the detected abnormalities at the single-cell level. Single-event and multievent subclones coexisted in most patients both at presentation and relapse, indicating that multievent subclones do not drastically outcompete single-event populations in phylogeny sweep (Figure 1C). Hence, we observed the stepwise process of cytogenetic abnormalities in different cases and conducted a timeline of crucial cytogenetic abnormalities. Consistent with previous studies,27,28 initial gains of 1q21 and 13q deletion served as early events in the disease course, while 16q and 17p deletion were observed to occur late as passenger events. Furthermore, our data suggest the dynamic patterns of subclonal development based on the ancestral architecture of each sample.
We investigated the evolutionary patterns using longitudinal QM-FISH on paired presentation and relapse samples. The frequency of each clonal evolution path was similar to previous results using array comparative genomic hybridization or whole-exome sequencing.5,6,19 Our results have revealed that clonal equilibrium is a common evolution pattern observed in one-third of MM patients. The genetic alterations initially identified in a tumor at the time of diagnosis have been shown to remain stable over time. These patients are more likely to be effectively treated with salvage therapy after disease progression and achieve similar or slightly inferior responses in the next disease course. With regard to clonal competition, 3 evolutionary patterns have been observed. Patients with differential evolutionary patterns had a stable clonal structure, but the relative proportions of subclones underwent dramatic modifications. This pattern demonstrates the presence of therapy selection that minor resistant clones at diagnosis may expand into predominant clones after relapse. Acquiring novel genetic aberration occurred in patients with linear and branching evolution. Linear evolutionary pattern has been well-documented recently with the advent of next-generation sequencing. Clonal instability tends to occur, and a progeny clone carrying novel aberration replaces its parent clone upon intensive chemotherapy. In patients with branching evolution, some sensitive clones disappeared along with other fitting clones acquiring new aberration. Clonal evolution is an adverse prognostic factor for survival. Patients with clonal stabilization had a superior outcome. Nevertheless, we failed to demonstrate a significantly different survival among the 3 evolutionary patterns. The proportion of clonal evolution identified by cFISH (61%) was similar to that identified by QM-FISH (68%). High consistency was observed across cFISH and QM-FISH in the evaluation of cytogenetic evolution patterns. However, cFISH was unable to distinguish linear and branching evolution paths effectively. It has limitations in visualizing intraclonal diversity and evolutionary architectures, and the sensitivity of cFISH in identifying minor subclones (frequency <10%) is less than that of QM-FISH. We could better identify the clonal architecture and track the changes of clone density over time by QM-FISH.
1q21 gain/amplification is one of the most common cytogenetic abnormalities, especially in the Asian population.29 Although 1q21 gain/amplification is considered a poor prognosis marker in MM, the prognostic value of the extra copy number variation of 1q21 remains debatable.18 Our previous study reports patients with >3 copies 1q21 showed comparable progression-free survival and OS in those with 3 copies of 1q21,15 consistent with several studies.30,31 In contrast, some investigations held the opposite view that the impact was worse for >3 copies of 1q21 as compared with 3 copies.32,33 In a present study, we discussed the impact of clonal evolution in 1q21 for the first time. Patients with increased clone size of 1q21 gain at relapse observed intermediate outcomes, while those who had an increased copy number of 1q21 or those who developed de novo 1q21 gain at relapse showed significantly dismal outcomes. These results suggested that the evolution of 1q21 gain across disease progression had a notable impact on survival.
Several limitations in the current study need to be addressed in the future. First, MM is a genetically heterogeneous disease with a patchy infiltration pattern in the BM. Moreover, clonal evolution is a continuous process. QM-FISH represents only a semirandom sweep of 1 time point by sampling a single BM site. Thus, the true heterogeneity and clonal structure may be masked. Second, QM-FISH could only detect the evolutionary path of selected cytogenetic abnormalities. Some other secondary genetic events associated with MM disease progression were not included. Third, the subjects in our cohort were treated with uniform proteasome inhibitors or an immunomodulatory drugs-based regimen. Thus, further study is needed to discuss whether the impact of cytogenetic evolution patterns could be equally applied to other treated series. Fourth, the cohort size and retrospective design of this study limit the scope of our conclusions.
In summary, the clonal structure of MM could undergo dramatic evolution, including changing the relative proportions of different subclones, the disappearance of previous subclones, or the acquisition of new cytogenetic abnormalities. Cytogenetic evolution was associated with inferior outcomes in MM. These findings suggest that QM-FISH is a valuable tool for the analysis of clonal phylogeny and the evolution pattern of critical cytogenetic aberrations. Patients may benefit from the repeated cytogenetic evaluation, especially for the risk stratification of survival after relapse. Personalized treatment strategy is required for MM patients based on their clonal evolution patterns.
Acknowledgments
The present study was supported by the International Cooperation Projects of National Natural Science Foundation (81920108006), the National Natural Science Foundation (81630007, 81670202, 81570181, 81900214), Chinese Academy of Medical Sciences Innovation Fund for Medical Sciences (CIFMS: 2021-I2M-C&T-B-079, 2017-I2M-1-015, 2019-I2M-2-009), and the Atlas of Blood Cell Alliance.
Authorship
Contribution: Y.Y. analyzed the data and wrote the manuscript; X.Q., Y.Y., and L.L. performed experiments; J.L., H.F., W.Y., C.D., Z.Y., Y.X., S.D., W.S., R.L., W.L., Q.W., D.Z., J.W., L.Q., and G.A. managed patients and collected samples; Y.-T.T., K.C.A., A.Z., and N.C.M. put forward suggestions for revision; N.C.M., L.Q., and G.A. designed the research, revised the manuscript critically, and approved the final version; and all authors reviewed the manuscript and provided final approval for submission.
Conflict-of-interest disclosure: K.C.A. is Consultant/Advisory Board: BMS, Pfizer, Janssen, Amgen, Astrazeneca, Mana, Starton, Window; and Founder: Oncopep, C4 Therapeutics, Raqia, NextRNA. N.C.M. is Consultant/Advisory Board: Janssen, BMS, Amgen, Novartis, Abbvie, Oncopep, Raqia, and Legend; and Founder and/or Stock holder: Oncopep and C4 therapeutics. The remaining authors declare no competing financial interests.
Correspondence: Gang An, 288 Nanjing Road, Tianjin 300020, China; e-mail: angang@ihcams.ac.cn; Lugui Qiu, 288 Nanjing Road, Tianjin 300020, China; e-mail: qiulg@ihcams.ac.cn; and Nikhil C. Munshi, 450 Brookline Ave, Boston, MA 02215; e-mail: nikhil_munshi@dfci.harvard.edu.

