

Key Points
14% of newly diagnosed APL patients in the Vizient Clinical Data Base died during initial admission or were discharged to hospice.
Adverse outcomes were lower with guideline-concordant treatment, low-risk disease, higher hospital AML volume, and younger age.

Abstract
Acute promyelocytic leukemia (APL) is associated with a favorable long-term prognosis if appropriate treatment is initiated promptly. Outcomes in clinical trials and population-based registries vary; potential explanations include a delay in treatment and lower adherence to guideline-recommended therapy in real-world practice. We used the Vizient Clinical Data Base to describe demographic characteristics, baseline clinical characteristics, and treatment patterns in patients newly diagnosed with APL during the study period of April 2017 to March 2020. Baseline white blood cell count was used to assign risk status and assess treatment concordance with National Comprehensive Cancer Network guidelines. Logistic regression models examined adjusted associations between patient, hospital, disease characteristics, and adverse outcomes (in-hospital death or discharge to hospice). Among 1464 patients with APL, 205 (14.0%) experienced an adverse outcome. A substantial subset (20.6%) of patients did not receive guideline-concordant regimens. Odds of adverse outcomes increased with failure to receive guideline-concordant treatment (odds ratio [OR], 2.31; 95% confidence interval [CI], 1.43-3.75; P = .001), high-risk disease (OR, 2.48; 95% CI, 1.53-4.00; P < .001), and increasing age (≥60 years: OR, 11.13; 95% CI, 4.55-27.22; P < .001). Higher hospital acute myeloid leukemia (AML) patient volume was associated with lower odds of adverse outcome (OR, 0.44; 95% CI, 0.20-0.99 [for ≤50 vs >200 AML patients per year]; P = .046). In conclusion, in this large database analysis, 14.0% of patients newly diagnosed with APL died or were discharged to hospice. A substantial proportion of patients did not receive guideline-concordant therapy, potentially contributing to adverse outcomes.
Introduction
Acute promyelocytic leukemia (APL) accounts for ∼10% of newly diagnosed cases of acute myeloid leukemia (AML) in the United States.1 Unlike other forms of AML, APL is treated with all-trans retinoic acid (ATRA)-based combination therapies and is associated with a substantially more favorable prognosis if appropriate treatment is initiated promptly.1,2 Long-term survival rates of >90% have been reported in clinical trials using ATRA-based therapies, and population-based outcomes documented in the Surveillance, Epidemiology, and End Results registry improved after the adoption of ATRA.3-7 Despite these advances, there is a substantial burden of early mortality related to hemorrhagic complications. Furthermore, the outcomes of patients in clinical trials and population-based registry studies vary substantially.4,5,8-12 The factors underlying these survival differences are unknown. Prior studies have suggested survival differences based on patient demographic characteristics (age, race, and socioeconomic status) and treatment setting, with more favorable outcomes observed for patients treated at academic or National Cancer Institute–designated cancer centers.6,7,10,13 However, the initial diagnosis and treatment of APL commonly occur in the inpatient setting, where most administrative cancer registry, claims, or even electronic medical record datasets lack detail; hence, little population-based information is available on treatment timing, risk status, or adherence to guidelines.
To fill this knowledge gap, we used data from the Vizient Clinical Data Base (CDB), which includes demographic characteristics, baseline clinical characteristics (including risk status), and detailed real-world treatment patterns, to examine associations with adverse outcomes in patients newly diagnosed with APL.
Methods
Data source and patient selection
The Vizient CDB contains inpatient and outpatient records from >95% of academic medical centers and cancer specialty hospitals across the United States, as well as 400 community hospital affiliates.14,15 The database includes patient demographic characteristics; hospital characteristics; detailed (charge-level) data on accommodations, procedures, and medication receipt; results for blood count and chemistry laboratory tests; and discharge timing and status. The study database was deidentified and without specific dates; resource use was reported relative to the admission date.
All adults with inpatient admissions for newly diagnosed APL were identified by using the International Classification of Diseases, 10th Revision (ICD-10), code C92.40 from April 2017 to March 2020. Only hospitals providing data during the entire study period were included in the data set. We selected the first admission observed. Patients with an unknown disposition status (n = 1) or who were transferred to another hospital (n = 31) were excluded. To minimize potential misclassification of APL, we excluded patients who did not receive any ATRA (n = 48) or for whom medication administration information was not available (n = 441). In subset analyses examining treatment patterns, we further excluded patients with length of stay (LOS) ≤3 days and/or unknown baseline white blood cell count (WBC), as we were unable to assess whether a specific treatment regimen was guideline-concordant for a given patient’s individual disease risk.
Outcomes of interest
We defined a composite adverse outcome of inpatient mortality or discharge to hospice. Discharge to hospice was included as it indicates a pivot away from curative APL-directed therapy due to either overwhelming complications of therapy or treatment failure. Intermediate outcomes included complications occurring during the hospitalization, such as intensive care unit (ICU) admission and intracranial hemorrhage, as reported by ICD-10 accommodation and diagnosis codes, respectively. In addition, indicators were created for intubation and the transfusion of blood products (red blood cells [RBCs], platelets, cryoprecipitate, and fresh frozen plasma) during the inpatient stay. Supplemental Table 1 reports the specific ICD-10 diagnosis and procedure codes.
Measurement of explanatory variables
APL risk status was assigned based on admission WBC count recorded at day 0 or 1. Patients with a WBC >10 G/L were designated as high risk and ≤10 G/L as low risk, consistent with guidelines published by the National Comprehensive Cancer Network (NCCN).16 We identified coagulopathy based on the presence of any abnormality in key coagulation tests (prothrombin time ≥14 seconds, partial thromboplastin time ≥35 seconds, or international normalized ratio ≥1.5).
To capture hospital clinical staff experience, we constructed a hospital-level AML volume measure based on the average annual number of unique adult AML inpatients at each hospital. We used the AML volume because it better captures the experience of hospital teams in diagnosing and managing this group of acutely ill patients, including the ability to distinguish APL from AML, with rapid initiation of APL-appropriate therapy. In addition, the annual AML volume was subject to less year-to-year variation within hospitals.
Additional variables included patient demographic characteristics (age, sex, race, ethnicity, and insurance status at admission), hospital factors (geographic location and teaching status), time to treatment initiation, and LOS.
Treatment patterns
Treatment regimens were measured based on daily receipt of specific drugs, combinations, timing, and duration. We searched for records indicating receipt of ATRA, arsenic trioxide (ATO), anthracycline (idarubicin, daunorubicin, doxorubicin, and mitoxantrone), and gemtuzumab ozogamicin (GO); this information was used to assign observed regimens. A minimum of 3 days of ATRA was required to qualify as receiving an ATRA-based regimen.
Based on current NCCN guidelines (version 3.2021) and patient risk status, we classified each observed regimen as guideline-concordant or guideline non-concordant.16 ATRA in combination with either ATO, an anthracycline, or GO was defined as guideline-concordant for low-risk patients. Guideline-concordant treatment of high-risk APL included ATRA + arsenic + anthracycline or GO, ATRA + anthracycline, and ATRA + GO. Other combinations that did not include the relevant drugs or adequate duration for an individual patient’s risk group were labeled as “not NCCN-guideline recommended.” Supplemental Table 2 provides an overview of all treatment regimens analyzed and whether they were consistent with NCCN guidelines.
Statistical analysis
Univariate analyses were used to describe patient, hospital, and disease characteristics for the overall cohort and by risk status, with comparisons using Pearson’s χ2 test. Multivariable logistic regression analyses were used to identify factors associated with adverse outcomes for the overall cohort, with a sensitivity analysis that excluded patients with LOS ≤3 days. Models included the following categorical variables: patient age, sex, race, ethnicity, hospital geographic region, hospital AML patient volume, risk status, baseline platelet count, presence of coagulopathy, and time to treatment initiation. Due to the strong correlation between age and Medicare enrollment, as well as AML volume and teaching status, we did not include insurance or teaching status in the models. We also evaluated the associations between the outcome and treatment concordance with NCCN guidelines among a subcohort with LOS >3 days and known risk status. We tested for interactions between guideline concordance and age and hospital AML volume.
Results of the logistic regression analyses were presented as odds ratios (ORs) with 95% confidence intervals (95% CIs) and predicted margins. C-statistics were calculated to assess goodness-of-fit. All tests were two-sided with an alpha of 0.05. All analyses were performed in SAS version 9.4 (SAS Institute, Inc., Cary, NC) and STATA version 14.2 (Stata Corp. College Station, TX).
Ethics approval and data-sharing statement
Because the Vizient CDB contains only deidentified data, this study was deemed exempt by the Yale University Human Investigations Committee. The original data cannot be shared by the authors per end-user agreement; data requests should be directed to Vizient Inc.
Results
Study population
A total of 1464 admissions from 118 hospitals met the full selection criteria; a subset (n = 1008) reported both WBC count and had a LOS >3 days (Figure 1). Median patient age was 53.5 years (interquartile range [IQR], 39-66 years) with 50.5% female, 70.0% white, and 76.8% non-Hispanic (Table 1). Most patients were treated at academic medical centers (92.4%), and 64.8% were diagnosed in hospitals that treated ≥100 patients with AML per year. The median LOS was 30 days (IQR, 20-36 days), with 91 patients (6.2%) having a LOS ≤3 days.
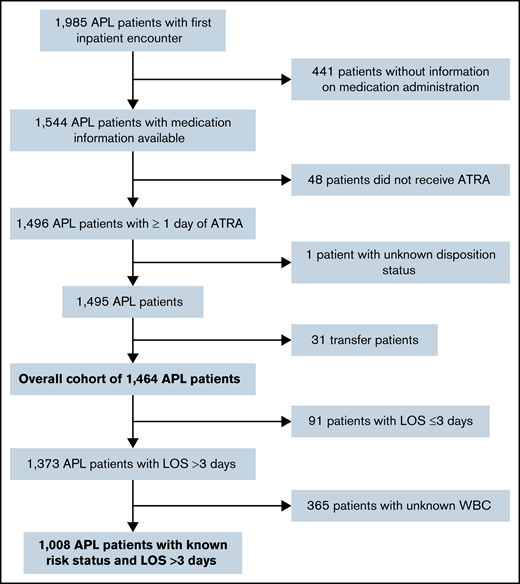
Patient selection flowchart. Patients were selected in a stepwise process. Patients had to have an ICD-10 diagnosis code of “APL, not having achieved remission” (C92.40) and received at least 1 day of ATRA for inclusion. We excluded outpatient and subsequent inpatient encounters, patients who were transferred or had an unknown disposition status, and patients without information on medication administration. The overall cohort included 1464 patients with APL. For analyses evaluating the treatment patterns, patients with LOS ≤3 days and unknown WBC were excluded as well. Data from the Vizient CDB used with permission of Vizient, Inc. All rights reserved.
Patient selection flowchart. Patients were selected in a stepwise process. Patients had to have an ICD-10 diagnosis code of “APL, not having achieved remission” (C92.40) and received at least 1 day of ATRA for inclusion. We excluded outpatient and subsequent inpatient encounters, patients who were transferred or had an unknown disposition status, and patients without information on medication administration. The overall cohort included 1464 patients with APL. For analyses evaluating the treatment patterns, patients with LOS ≤3 days and unknown WBC were excluded as well. Data from the Vizient CDB used with permission of Vizient, Inc. All rights reserved.
Baseline patient and hospital characteristics, overall and by risk level
| Characteristic | Overall (N, column %) | Low risk (column %) | High risk (column %) | Unknown risk (column %) | P |
|---|---|---|---|---|---|
| Sample N (row %) | 1464 | 706 (48.2%) | 366 (25.0%) | 392 (26.8%) | |
| Age (median, 53 y; IQR, 38-65 y) | .76 | ||||
| ≤39 y | 389 (26.6%) | 26.6% | 24.3% | 28.6% | |
| 40-59 y | 543 (37.1%) | 37.0% | 38.8% | 35.7% | |
| ≥60 y | 532 (36.3%) | 36.4% | 36.9% | 35.7% | |
| Sex | .97 | ||||
| Male | 724 (49.5%) | 49.3% | 49.2% | 50.0% | |
| Female | 740 (50.5%) | 50.7% | 50.8% | 50.0% | |
| Race | .001 | ||||
| White | 1024 (70.0%) | 74.9% | 67.5% | 63.3% | |
| African American | 190 (13.0%) | 11.5% | 13.9% | 14.8% | |
| Other/unknown | 250 (17.1%) | 13.6% | 18.6% | 21.9% | |
| Ethnicity | <.001 | ||||
| Hispanic | 154 (10.5%) | 8.5% | 9.8% | 14.8% | |
| Non-Hispanic | 1124 (76.8%) | 80.7% | 80.1% | 66.6% | |
| Unknown | 186 (12.7%) | 10.8% | 10.1% | 18.6% | |
| Primary payer source | .09 | ||||
| Commercial | 672 (45.9%) | 48.4% | 43.4% | 43.6% | |
| Medicaid | 280 (19.1%) | 17.3% | 22.4% | 19.4% | |
| Medicare | 432 (29.5%) | 30.0% | 26.8% | 31.1% | |
| Other | 80 (5.5%) | 4.3% | 7.4% | 5.9% | |
| AAMC teaching status | .06 | ||||
| Academic medical center | 1353 (92.4%) | 92.4% | 94.8% | 90.3% | |
| Non-academic medical center | 111 (7.6%) | 7.7% | 5.2% | 9.7% | |
| Hospital AML patient volume per year | <.001 | ||||
| ≤50 | 218 (14.9%) | 15.0% | 15.0% | 14.5% | |
| 51-100 | 305 (20.8%) | 19.8% | 23.5% | 20.2% | |
| 101-200 | 649 (44.3%) | 47.3% | 46.2% | 37.2% | |
| >200 | 292 (20.0%) | 17.9% | 15.3% | 28.1% | |
| Geographic location | <.001 | ||||
| West | 189 (12.9%) | 13.9% | 14.5% | 9.7% | |
| Midwest | 385 (26.3%) | 33.1% | 28.1% | 12.2% | |
| South | 627 (42.8%) | 39.0% | 44.5% | 48.2% | |
| Northeast | 263 (18.0%) | 14.0% | 12.8% | 29.9% | |
| Initial clinical presentation | |||||
| Platelet count on admission | <.001 | ||||
| <50 G/L | 788 (53.9%) | 67.9% | 80.6% | 3.6% | |
| 50-150 G/L | 270 (18.4%) | >27.3% | >13.8% | <2.6% | |
| >150 G/L | 30 (2.1%) | 3.3% | <2.8% | <2.6% | |
| Unknown | 376 (25.7%) | <1.5% | <2.8% | >91.2% | |
| Coagulopathy | <.001 | ||||
| Yes | 530 (36.2%) | 40.1% | 64.8% | 2.6% | |
| No | 396 (27.1%) | 42.4% | 23.2% | 3.1% | |
| Unknown | 538 (36.8%) | 17.6% | 12.0% | 94.4% | |
| Time to treatment initiation | .001 | ||||
| Within 2 d of admission | 1376 (94.0%) | >92.0% | >97.2% | 92.4% | |
| ≥3 d after admission | 88 (6.0%) | <8.0% | <2.8% | 7.7% |
Risk status was defined in accordance with NCCN guidelines based on WBC count on admission as low (WBC ≤10 G/L), high (WBC >10 G/L), or unknown (no WBC on admission available) risk. P values refer to the comparison of observed and expected frequency distributions of a given row variable across disease risk as assessed by Pearson’s χ2 test. In line with data-user agreement, cell sizes with <10 patients were suppressed to protect privacy rights. AAMC, American Association of Medical Colleges. Data from the Vizient CDB used with permission of Vizient, Inc. All rights reserved.
Baseline WBC was available for 1010 patients (71.7%); 48.2% and 23.5% were classified as low risk and high risk, respectively. High-risk patients were less likely to be white (67.5% vs 74.9%; P = .001) and more likely to have baseline coagulopathy (64.8% vs 40.1%; P < .001), a platelet count <50 G/L (80.6% vs 67.9%; P < .001), and Medicaid as primary payer (22.4% vs 17.3%; P = .02) compared with low-risk patients; 98.1% of high-risk patients vs 92.8% (P < .001) of low-risk patients started treatment within 2 days of admission.
Treatment
The most common regimens were ATRA (≥3 days) + arsenic (≥1 day) overall (63.4%) and among patients with low-risk APL (83.4%). Patients with high-risk disease most commonly received ATRA (≥3 days) + arsenic (≥1 day) + anthracycline (≥1 day) (28.6%) or ATRA (≥3 days) + anthracycline (≥1 day) or GO (≥1 day) (19.9%). An overview of all regimens according to risk status is provided in supplemental Table 2.
Most patients (79.3%) received treatment regimens that were NCCN guideline concordant for their reported risk category. Rates of guideline-concordant therapy were higher among low-risk compared with high-risk disease (86.1% vs 64.6%; P < .001) (Figure 2). Treatment was initiated within 2 days of admission in 94.0% of patients. Interactions between the likelihood of receiving guideline-concordant therapy and either patient age group or annual AML patient volume were not significant.
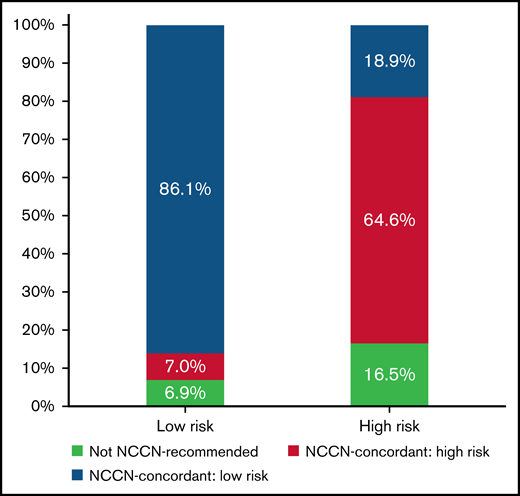
Treatment patterns and concordance with NCCN guidelines by baseline disease risk. Distribution of treatment patterns in all patients with a LOS >3 days and known baseline risk status. Low-risk (n = 686) and high-risk (n = 322) patients were defined as WBC ≤10 G/L and WBC >10 G/L, respectively. Treatment regimens were classified based on current NCCN recommendations. ATRA + ATO was defined as the preferred regimen for low-risk APL (blue) with ATRA + ATO + anthracycline or GO constituting the preferred regimens for patients with high-risk APL (green). ATRA + anthracycline or GO can be used independent of disease risk in patients with contraindications to ATO and was included as a risk-agnostic, guideline-concordant treatment regimen among the respective NCCN guideline–concordant regimens in the low-risk (blue) and high-risk (green) patient populations.16 Other treatment regimens were classified as not NCCN-recommended (red). Overall, 86.1% of low-risk patients and 64.6% of high-risk patients with APL received guideline-concordant regimens for their risk status. Among patients with high-risk APL, 18.9% were treated with ATRA + ATO, a regimen that is NCCN concordant only for patients with low-risk APL. Data from the Vizient CDB used with permission of Vizient, Inc. All rights reserved.
Treatment patterns and concordance with NCCN guidelines by baseline disease risk. Distribution of treatment patterns in all patients with a LOS >3 days and known baseline risk status. Low-risk (n = 686) and high-risk (n = 322) patients were defined as WBC ≤10 G/L and WBC >10 G/L, respectively. Treatment regimens were classified based on current NCCN recommendations. ATRA + ATO was defined as the preferred regimen for low-risk APL (blue) with ATRA + ATO + anthracycline or GO constituting the preferred regimens for patients with high-risk APL (green). ATRA + anthracycline or GO can be used independent of disease risk in patients with contraindications to ATO and was included as a risk-agnostic, guideline-concordant treatment regimen among the respective NCCN guideline–concordant regimens in the low-risk (blue) and high-risk (green) patient populations.16 Other treatment regimens were classified as not NCCN-recommended (red). Overall, 86.1% of low-risk patients and 64.6% of high-risk patients with APL received guideline-concordant regimens for their risk status. Among patients with high-risk APL, 18.9% were treated with ATRA + ATO, a regimen that is NCCN concordant only for patients with low-risk APL. Data from the Vizient CDB used with permission of Vizient, Inc. All rights reserved.
Adverse outcomes
Among all 1464 patients, 205 (14.0%) experienced the composite adverse outcome of inpatient mortality (12.3%) or discharge to hospice (1.7%). Rates of adverse outcomes were 7.4%, 26.8%, and 14.0% among patients with low, high, and unknown risk, respectively. In unadjusted analysis, there were significant associations between age, race, ethnicity, Medicare insurance status, presence of coagulopathy, ICU admission, and intubation and adverse outcome (supplemental Table 3).
In the full sample, the adjusted odds of adverse outcomes increased with age (age ≥60 years; OR, 7.59; 95% CI, 4.39-13.13; P < .001) and high-risk status (OR, 4.27; 95% CI, 2.86-6.39; P < .001), whereas the odds of adverse outcomes were lower with treatment at a hospital with higher AML volume (OR, 0.35; 95% CI, 0.19-0.63; P < .001 [for >200 vs ≤50 AML patients per year]) and the absence of coagulopathy (OR, 0.56; 95% CI, 0.35-0.89; P = .01). The c-statistic for the model was 0.80, indicating good model fit (Table 2).
Multivariable logistic regression of predictors of inpatient death and discharge to hospice among 1464 adult patients with APL
| Variable | OR | 95% CI | P | Predicted margin |
|---|---|---|---|---|
| Age, y | ||||
| ≤39 y | 1.00 | 0.047 | ||
| 40-59 y | 2.68 | 1.52-4.71 | .001 | 0.110 |
| ≥60 y | 7.59 | 4.39-13.13 | <.001 | 0.237 |
| Sex | ||||
| Male | 1.00 | 0.146 | ||
| Female | 0.89 | 0.64-1.23 | .46 | 0.134 |
| Race | ||||
| White | 1.00 | 0.140 | ||
| African American | 0.57 | 0.31-1.03 | .06 | 0.091 |
| Unknown/Other | 1.40 | 0.88-2.25 | .16 | 0.178 |
| Ethnicity | ||||
| Non-Hispanic | 1.00 | 0.131 | ||
| Hispanic | 0.77 | 0.40-1.48 | .43 | 0.107 |
| Unknown | 2.20 | 1.35-3.60 | .002 | 0.225 |
| Hospital region | ||||
| West | 1.00 | 0.170 | ||
| Midwest | 0.65 | 0.37-1.15 | .14 | 0.125 |
| South | 0.89 | 0.54-1.50 | .66 | 0.158 |
| Northeast | 0.50 | 0.27-0.92 | .03 | 0.103 |
| Hospital AML patient volume per year | ||||
| ≤50 | 1.00 | 0.211 | ||
| 51-100 | 0.52 | 0.32-0.89 | .02 | 0.134 |
| 101-200 | 0.55 | 0.34-0.87 | .01 | 0.139 |
| >200 | 0.35 | 0.19-0.63 | <.001 | 0.100 |
| Risk status | ||||
| Low risk (WBC ≤10 G/L) | 1.00 | 0.068 | ||
| High risk (WBC >10 G/L) | 4.27 | 2.86-6.39 | <.001 | 0.209 |
| Unknown | 5.20 | 1.70-15.94 | .004 | 0.238 |
| Platelet count on admission | ||||
| <50 G/L | 1.00 | 0.166 | ||
| 50-150 G/L | 0.76 | 0.47-1.23 | .26 | 0.137 |
| >150 G/L | 0.34 | 0.07-1.60 | .17 | 0.073 |
| Unknown | 0.54 | 0.18-1.62 | .27 | 0.106 |
| Time to treatment initiation | ||||
| ≤2 d after admission | 1.00 | 0.139 | ||
| >2 d after admission | 1.12 | 0.56-2.25 | .75 | 0.151 |
| Coagulopathy | ||||
| Yes | 1.00 | 0.186 | ||
| No | 0.56 | 0.35-0.89 | .01 | 0.123 |
| Unknown | 0.46 | 0.26-0.82 | .008 | 0.105 |
Predictive margins were calculated for each variable from a previously fitted multivariable regression model and describe the average probability for a patient in a given category to experience the adverse outcome with the other variables kept constant. Data from the Vizient CDB used with permission of Vizient, Inc. All rights reserved.
Patients with a LOS ≤3 days experienced a higher rate of adverse outcomes compared with patients with LOS >3 days (72.5% vs 10.1%; P < .001). Among the subsample of patients with known risk status and LOS >3 days, we observed higher odds of adverse outcomes with failure to receive guideline-concordant treatment (OR, 2.31; 95% CI, 1.43-3.75; P = .001), with high-risk disease (OR, 2.48; 95% CI, 1.53-4.00; P < .001) and increasing age. Conversely, treatment at hospitals with higher annual AML patient volume conferred a more favorable prognosis (Table 3). The c-statistic for the model was 0.81. In sensitivity analyses that included patients who did not receive ATRA among the NCCN guideline non-concordant treatment group, we found similar results. Patient age, high-risk disease, and NCCN guideline non-concordant treatment remained associated with higher odds of death or discharge to hospice. Conversely, treatment at a hospital with higher AML volume was associated with favorable outcomes.
Multivariable logistic regression of predictors of inpatient death and discharge to hospice among 1,008 APL patients with LOS >3 days and known risk status
| Variable | OR | 95% CI | P | Predicted margin |
|---|---|---|---|---|
| Age | ||||
| ≤39 y | 1.00 | 0.023 | ||
| 40-59 y | 4.34 | 1.76-10.74 | .001 | 0.087 |
| ≥60 y | 11.1 | 4.55-27.23 | <.001 | 0.182 |
| Sex | ||||
| Male | 1.00 | 0.113 | ||
| Female | 0.77 | 0.49-1.21 | .26 | 0.093 |
| Race | ||||
| White | 1.00 | 0.099 | ||
| African American | 0.78 | 0.36-1.65 | .51 | 0.081 |
| Unknown/other | 1.68 | 0.86-3.29 | .13 | 0.146 |
| Ethnicity | ||||
| Non-Hispanic | 1.00 | 0.101 | ||
| Hispanic | 0.98 | 0.38-2.46 | .95 | 0.098 |
| Unknown | 1.33 | 0.61-2.87 | .48 | 0.125 |
| Hospital region | ||||
| West | 1.00 | 0.106 | ||
| Midwest | 0.83 | 0.38-1.83 | .65 | 0.092 |
| South | 1.12 | 0.56-2.27 | .75 | 0.115 |
| Northeast | 0.77 | 0.31-1.90 | .57 | 0.086 |
| Hospital AML patient volume per year | ||||
| ≤50 | 1.00 | 0.159 | ||
| 51-100 | 0.43 | 0.20-0.92 | .03 | 0.085 |
| 101-200 | 0.54 | 0.29-1.02 | .06 | 0.100 |
| >200 | 0.44 | 0.20-0.99 | .046 | 0.085 |
| Risk status | ||||
| Low risk (WBC ≤10 G/L) | 1.00 | 0.074 | ||
| High risk (WBC >10 G/L) | 2.48 | 1.53-4.00 | <.001 | 0.152 |
| Platelet count on admission | ||||
| <50 G/L | 1.00 | 0.109 | ||
| 50-150 G/L | 0.78 | 0.45-1.37 | .39 | 0.090 |
| >150 G/L | 0.30 | 0.04-2.47 | .26 | 0.040 |
| Unknown | Omitted | |||
| Time to treatment initiation | ||||
| ≤2 d after admission | 1.00 | 0.099 | ||
| >2 d after admission | 1.98 | 0.82-4.76 | .13 | 0.164 |
| Coagulopathy | ||||
| Yes | 1.00 | 0.124 | ||
| No | 0.67 | 0.39-1.13 | .13 | 0.090 |
| Unknown | 0.37 | 0.17-0.82 | .02 | 0.056 |
| NCCN guideline–concordant treatment | ||||
| Yes | 1.00 | 0.083 | ||
| No | 2.31 | 1.43-3.75 | .001 | 0.160 |
Predictive margins were calculated for each variable from a previously fitted multivariable regression model and describe the average probability for a patient in a given category to experience the adverse outcome with the other variables kept constant. Data from the Vizient CDB used with permission of Vizient, Inc. All rights reserved.
Occurrence of complications and supportive care practices
In the overall patient population, 12.6% were intubated, 23.4% were admitted to the ICU, and 11.5% experienced intracranial hemorrhage. Complications were more common in patients with high-risk disease compared with low-risk disease (P < .001). For example, 23.8% of high-risk vs 7.1% of low-risk patients were intubated. Among patients requiring intubation or ICU admission, 67.4% and 39.4%, respectively, had adverse outcomes. Supplemental Figure 1 reports proportions of these complications according to disease risk and treatment category. Among patients receiving guideline-concordant therapy, high-risk patients were more likely to be admitted to the ICU, to be intubated, and to experience intracranial hemorrhage compared with low-risk patients (P < .001 for all comparisons). Rates of these complications were independent of disease risk among patients who did not receive guideline-concordant therapy.
Transfusion records were available for 1362 patients (93.0%). RBCs and platelets were administered in 92.8% and 86.8% of patients, respectively. Cryoprecipitate and fresh frozen plasma were transfused in 50.0% and 20.4% of patients. Transfusion requirements tended to be higher for all blood products in patients with high-risk APL compared with those with low-risk APL (supplemental Table 4). The median number of RBCs, platelets, and cryoprecipitate transfusions in low-risk patients were 4 (IQR, 2-6), 4 (IQR, 1-9), and 0 (IQR, 0-2), respectively, compared with 5 (IQR, 3-8), 9.5 (IQR, 4-16), and 2 (IQR, 0-2) in high-risk patients.
Discussion
In this analysis of 1464 patients with newly diagnosed APL, we found that 79.3% received NCCN guideline–concordant therapy specific to their risk status and that treatment was initiated in a timely manner for 94.0%. Overall, 14% experienced the composite adverse outcome of inpatient mortality or discharge to hospice, with rates ∼3.5 times higher for high-risk patients compared with low-risk patients. Adjusted analyses found that high-risk status, failure to receive guideline-concordant therapy, and increasing age were associated with increased odds of adverse outcomes, whereas treatment in a hospital with higher annual AML patient volume was associated with favorable outcomes. Although age is not a mutable factor, and disease severity at presentation may or may not indicate delays in referral from primary care, our results highlight the importance of increasing guideline-concordant treatment and interventions to reduce the outcome differential between high and low AML volume facilities. Addressing the underlying causes of why patients do not receive guideline-concordant therapies is therefore essential to improve outcomes.
Potential explanations for suboptimal treatment include patient comorbidities, early complications, and hospital and provider characteristics, although none of these has been consistently identified in the literature.9,12 In contrast to prior large database studies, our study is the first to analyze specific treatment regimens and to evaluate whether the treatment received was consistent with NCCN recommendations based on disease risk. We found that 86.1% of low-risk patients and 64.6% of high-risk patients were treated with NCCN guideline–concordant treatment regimens.16 In addition, only 3.4% of all patients were treated with ATRA monotherapy. Although those numbers remain suboptimal, they are superior to one study reporting only single-agent therapy for 29% of patients with APL.12 Comorbidities (eg, cardiac dysfunction) or polypharmacy (eg, concomitant essential drugs leading to QTc interval prolongation) may have prevented administration of guideline-concordant therapy on an individual patient basis but are difficult to capture in database analyses.
With 14.0% of patients dying in the hospital or being discharged to hospice, our results again highlight the differences in outcomes between clinical trials and real-world analyses. Early mortality in clinical trials ranged from 0% to 8% depending on treatment regimen and baseline disease risk.4,5,8,9 In contrast, both European and US registry studies have reported early mortality of up to 30%, although improvements have been noted in more recent cohorts.10-12 Our results suggest that failure to receive guideline-concordant therapy could be a major factor underlying those discrepant outcomes. Differences in patient age and baseline disease risk could be additional explanations, as prior clinical trials focused on low-risk and/or younger patients than in our study.4,8 This is supported by the fact that we found an association of older age (especially age ≥60 years) and WBC >10 G/L with higher rates of inpatient death or discharge to hospice. Although older age has been identified as an adverse prognostic factor in multiple large databases,12,17 this is the first large database study that includes laboratory parameters and risk stratifies patients accordingly. In addition, we were able to show that the absence of coagulopathy is associated with favorable outcomes, which could reflect the impact of hemorrhagic complications on early mortality. Although the specific cause of death was not available for analysis, 11.5% of patients in our study developed an intracranial hemorrhage, which has been previously shown to be strongly associated with mortality in patients with APL.17
Because APL is a curable malignancy if treated early and appropriately, it is important to ensure adequate therapy at all levels of care.18 As such, greater access to specialist care and treatment in academic or dedicated cancer centers have been associated with improved outcomes in patients with APL.12,17 Similarly, we found that the odds of adverse outcomes were lower in hospitals with higher annual AML patient volume, which could reflect differences in the quality of supportive care and management of complications. This supports the transfer of patients with APL to higher volume centers with greater experience and resources available to improve outcomes. However, Jillella et al9 conducted a prospective, multicenter trial showing that outcomes in the community setting can be similar to academic centers after the implementation of standardized algorithms and expert consultation.
Although not a focus of this study, disparities in outcomes with higher rates of early death and lower survival in both AML and APL patients without health insurance and non-white race/ethnicity have been reported previously in the California Cancer Registry and the Surveillance, Epidemiology, and End Results registry.19-21 Our bivariate analyses indicated that African-American patients were less likely to experience adverse outcomes, but the effect of race/ethnicity was not significant in models that adjusted for age, risk status, and guideline-concordant therapy, factors not available in cancer registry data.
Despite the richness of the data, our study has limitations related to the data available in the Vizient CDB. We were unable to verify the APL diagnosis by molecular testing results and had to rely on the ICD-10 diagnosis code. However, we required patients to have received at least 1 day of ATRA for inclusion and at least 3 days for assignment to an ATRA-based treatment regimen, which should have limited the number of non-APL AML patients who were empirically treated with ATRA. Second, we were unable to evaluate physician intent with respect to treatment choice and whether affected by comorbid conditions, leading to uncertainty regarding the appropriateness of a specific regimen. In addition, the WBC at admission may have changed by the time of treatment initiation, which might have led to a change in disease risk and misclassification of guideline-concordant treatment in a subset of patients, especially if treatment was not started immediately. Third, our patients were primarily treated in academic centers, which may limit the generalizability of our findings to nonacademic care settings. Fourth, we constructed a composite measure of coagulopathy based on results for prothrombin time, partial thromboplastin time, and international normalized ratio tests but acknowledge that assays can vary across institutions, which may limit the reliability of our measure. Furthermore, fibrinogen and D-dimer levels were not reported, which precluded a formal assessment of the rates of disseminated intravascular coagulation. Finally, patients may not be followed up across participating hospitals, and thus patients who transfer care from one hospital to another could be included twice in separate admissions. However, we excluded patients who were transferred to another hospital, which should limit the extent of this problem.
In conclusion, this study is the first to evaluate specific treatment patterns in patients admitted to the hospital with APL. We found a 14.0% rate of inpatient death during first admission or discharge to hospice in the Vizient CDB, which is inferior to clinical trials but superior to other registry and database studies. Adherence to NCCN guideline–concordant treatment regimens was suboptimal, and patients who did not receive guideline-concordant treatment had inferior outcomes. Our results highlight the need for ongoing practice improvement in the real-world setting and suggest lower rates of guideline-concordant therapy as a contributing factor to worse outcomes compared with clinical trials.
Acknowledgments
A.M.Z. is a Leukemia and Lymphoma Society Scholar in Clinical Research and is also supported by a National Institutes of Health, National Cancer Institute Cancer Clinical Investigator Team Leadership Award (CCITLA). This research was partly funded by the Dennis Cooper Hematology Young Investigator Award (AMZ) and was in part supported by the National Cancer Institute of the National Institutes of Health under award number P30 CA016359.
The views expressed in this article are those of the authors, and the endorsement of the National Cancer Institute, the National Institutes of Health, or the Department of Health and Human Services is not intended and should not be inferred.
Authorship
Contribution: J.P.B. and R.W. performed analyses; J.P.B., A.M.Z., and A.J.D. were responsible for conception and design of the study; J.P.B. and A.J.D. drafted the initial version of the manuscript; and A.M.Z. and A.J.D. supervised the study; and all authors contributed to the critical interpretation of findings and subsequent drafts of the manuscript, and have reviewed and approved the submitted version of the manuscript.
Conflict-of-interest disclosure: N.A.P. consulted for and received honoraria from Alexion, Pfizer, Agios Pharmaceuticals, Blueprint Medicines, Incyte, Novartis, Celgene, Bristol Myers Squibb, and CTI BioPharma, PharmaEssentia; and received research funding (all to the institution) from Boehringer Ingelheim, Astellas Pharma, Daiichi Sankyo, Sunesis Pharmaceuticals, Jazz Pharmaceuticals, Pfizer, Astex Pharmaceuticals, CTI Biopharma, Celgene, Genentech, AI Therapeutics, Samus Therapeutics, Arog Pharmaceuticals, and Kartos Therapeutics. S.F.H. has been a consultant for Celgene, Bayer, Genentech, Pharmacyclics, and AbbVie; and received research funding from DTRM Biopharm, Celgene, and TG Therapeutics. A.M.Z. received research funding (institutional) from Celgene, Acceleron, Abbvie, Otsuka, Pfizer, MedImmune/AstraZeneca, Boehringer Ingelheim, Trovagene, Incyte, Takeda, and ADC Therapeutics; and had a consultancy with and received honoraria from AbbVie, Otsuka, Pfizer, Celgene, Ariad, Incyte, Agios, Boehringer Ingelheim, Novartis, Acceleron, Astellas, Daiichi Sankyo, Cardinal Health, Seattle Genetics, BeyondSpring, and Takeda. A.J.D. received consulting funds from Amgen. None of these relationships were related to the development of this work. The remaining authors declare no competing financial interests.
Correspondence: Amer M. Zeidan, Section of Hematology, Department of Internal Medicine, Yale University, 333 Cedar St, PO Box 208028, New Haven, CT 06520-8028; e-mail: amer.zeidan@yale.edu.

