

Key Points
miRNAs in the pathophysiological process of cGVHD has increased, and their potential role as biomarkers are mainly unknown.
Both single miRNAs and miRNA profiles in serum seem to be highly associated with cGVHD in patients after allo-HSCT.

Abstract
Chronic graft-versus-host disease (cGVHD) is the most common long-term complication of allogeneic hematopoietic stem cell transplantation (allo-HSCT). During the last decade, the interest of micro RNAs (miRNAs) in the pathophysiological process of cGVHD has increased. The objectives of this study were to investigate a wide range of serum miRNAs in allografted patients and identify associations between miRNAs and cGVHD. The study included 79 allotransplanted adults, where serum samples were obtained 1 year after the allo-HSCT, and miRNA profiling analysis in serum was performed. Fifty of the 79 patients (63%) had signs of cGVHD at the 1-year post–allo-HSCT control. miRNA sequencing analysis revealed 1380 different miRNAs detected for at least 1 patient, whereas 233 miRNAs (17%) were detected in >70 patients. We identified 10 miRNAs that differed significantly between patients with and without cGVHD (P < .005; false discovery rate <0.1), and all of these miRNAs were detected for >75 of the patients. Furthermore, 5 distinct miRNAs, miR-365-3p, miR-148-3p, miR-122-5p, miR-378-3p, and miR-192-5p, were found to be particularly associated with cGVHD in our analysis and were validated by receiver operating characteristics analysis. Based on only 3 miRNAs, miR-365-3p, miR-148-3p, and miR-378-3p, we developed a miRNA signature that, by bioinformatic approaches and linear regression model, utterly improved our potential diagnostic biomarker model for cGVHD. We conclude that miRNAs are differently expressed among patients with and without cGVHD, although further and larger studies are needed to validate our present findings.
Introduction
Allogeneic hematopoietic stem cell transplantation (allo-HSCT) is currently the most potent antileukemic treatment and offers patients with aggressive hematological malignancies the best opportunity for cure.1,2 The treatment approach depends on the ability of the engrafting immune system to eradicate residual leukemia cells through the graft-versus-leukemia effect.1 However, the treatment is associated with a relatively high risk of complications leading to high frequencies of morbidity and mortality.3 Among these complications is graft-versus-host disease (GVHD),4,5 characterized by inflammation in different organs mediated by immunocompetent grafted donor cells. GVHD can be divided in acute GVHD (aGVHD) and chronic GVHD (cGVHD),4,5 which by classical definition is diagnosed before and after 100 days after allo-HSCT. However, this conventional division has been challenged by the recognition that signs of aGVHD and cGVHD may occur outside of these designated periods. In contrast to aGVHD, which mainly affects skin, liver, and gastrointestinal (GI) tract, cGVHD can affect almost all organ systems. The complex immunopathology of cGVHD is still poorly understood,6 and preclinical models have weaknesses and limitations in the study of the disease.7 Biomarkers with diagnostic and prognostic impact have been studied in cGVHD,8-13 although still no biomarkers are established in routine clinical practice.8,11
Micro RNAs (miRNAs) are single-stranded noncoding RNA molecules derived from endogenous hairpin-shaped transcripts. Their functions are related to RNA silencing and posttranscriptional regulation of gene expression. They predominately bind to the 3′ untranslated region of messenger RNAs (mRNAs), thereby inhibiting their translation.14 The last decades have brought new insight to the role of miRNAs in several human diseases, including malignant diseases and inflammatory conditions. The discovery that miRNA was relatively stable in blood, despite known ribonuclease activity, led to the untangling of exome transporter system for miRNA in serum, protecting them from degeneration.15 An increased interest of miRNAs as molecular biomarkers for several diseases followed, and this has also been translated into the research field of GVHD.15 The majority of studies performed so far have focused on the potential role of miRNAs in aGVHD16-19 ; however, their involvement in cGVHD and potential role as biomarkers in cGVHD are mainly unknown.
The aim of the present study was to investigate miRNA profiles in a consecutive cohort of allo-HSCT grafted patients, searching for miRNAs and miRNA profiles associated with disease and disease burden. Finally, the study aimed to investigate the possibilities for miRNAs as biomarkers in cGVHD.
Methods
Patients’ characteristics
The study was approved by the local ethics committee (Regional Ethics Committee III, University of Bergen, Norway; REK Vest 350/2017), and samples were collected after written informed consent. The study included 79 consecutively allotransplanted adults, 46 men and 33 women with a median age of 49 years (range, 15-71 years), who were transplanted in a single center with human leukocyte antigen–matched family donors between March 2006 and March 2019. The decision to perform an allo-HSCT was taken by the Norwegian Advisory Board for Stem Cell Transplantation and based on national guidelines. Thus, our study is population-based and includes an unselected and consecutive group of well-characterized patients. Patients were transplanted with granulocyte colony–stimulating factor–mobilized peripheral blood stem cells. Most patients received GVHD prophylaxis with cyclosporine A plus methotrexate (77/79, 97%), 1 patient received only cyclosporine A, and 1 patient received cyclosporine A plus sirolimus.20 Conditioning regimens included both myeloablative conditioning and reduced intensity conditioning, and acute myelogenous leukemia/myelodysplastic syndrome (MDS) was the most common indication for transplantation (50/79, 63%). The patient characteristics are given in Table 1 and supplemental Figure 1.
Demographical, clinical, and laboratory data for the 79 patients included in the study
| Patient characteristics | Observation | Plus cGVHD | Minus cGVHD | |
|---|---|---|---|---|
| Total | 79 | 50 | 29 | |
| Demographic data and disease history | ||||
| Gender (numbers, male/female) | 46/33 | 29/21 | 17/12 | |
| Age (years, median, and range) | 49 (15-71) | 52 (17-71) | 44 (15-61) | |
| Height (cm, median, and range) | 173 (149-193) | 174 (153-190) | 172 (149-193) | |
| Weight (kg, median, and range) | 73 (42-133) | 75 (47-133) | 67 (42-110) | |
| BMI (kg/m2, median, and range) | 23.7 (16.9-39.7) | 24.8 (17.9-39.7) | 22.1 (16.9-31) | |
| Diagnosis (numbers) | AML/MDS | 50 | 36 | 14 |
| ALL | 16 | 9 | 7 | |
| MF | 5 | 2 | 3 | |
| MDS/MPN | 4 | 3 | 1 | |
| CLL | 2 | 0 | 2 | |
| AA HL | 1 1 | 0 0 | 1 1 | |
| Conditioning regimen (numbers) | BU + CY | 43 | 28 | 15 |
| FLU + BU | 14 | 10 | 4 | |
| FLU + TRE | 11 | 8 | 3 | |
| FLU + BU + ATG | 3 | 2 | 1 | |
| TBI + ETO | 2 | 0 | 2 | |
| TBI + CY | 2 | 1 | 1 | |
| FLU + CY | 2 | 0 | 2 | |
| CY + ATG | 1 | 0 | 1 | |
| BEAM | 1 | 1 | 0 | |
| Previously aGVHD | 30 | 25 | 5 | |
| Laboratory data 1-year control | Hemoglobin g/dL | 12.7 (8.0-16.3) | 12.7 (9.1-15.6) | 12.6 (8.0-16.3) |
| Leukocytes × 109/L | 6.1 (1.6-12.8) | 7.0 (3.0-12.8) | 5.3 (1.6-11.7) | |
| Neutrophils × 109/L | 3.3 (0.6-9.2) | 3.8 (1.1-9.2) | 2.7 (0.6-5.8) | |
| Platelets × 109/L | 203 (20-385) | 209 (20-385) | 201 (22-354) | |
| CRP mg/L | 3 (1-120) | 3 (1-120) | 2 (1-42) | |
| Albumin g/L | 42 (28-50) | 42 (28-50) | 43.5 (39-50) | |
| Bilirubin µmol/L | (3-129) | 8 (3-129) | 6 (3-16) | |
| cGVHD debut after allo-HSCT | 3-6 mo 6-9 mo 9-12 mo Overlap syndrome | 17 6 16 11 | ||
| cGVHD organ involvement (numbers) | Liver/bile duct Skin GI tract Eyes | 26 22 21 21 | ||
| Mouth | 17 | |||
| Lungs | 3 | |||
| UG tract | 3 | |||
| Musculoskeletal | 1 | |||
Values are, unless otherwise stated, given as median and range in parentheses. Height and weight were registered at the start of conditioning therapy.
AA, aplastic anemia; ALL, acute lymphoblastic leukemia; AML, acute myelogenous leukemia; ATG, antithymoglobulin; BMI, body mass index; BU, busulphan; CLL, chronic lymphocytic leukemia; CRP, C-reactive protein; CY, cyclophosphamide; ETO, etoposide; FLU, fludarabine; FLU, fludarabine; HL, Hodgkin’s lymphoma; MDS/MPN, myelodysplastic syndrome/myeloproliferative neoplasm overlap syndromes; MF, myelofibrosis; TBI, total body irradiation; TRE, treosulfan; UG; urogenital.
Diagnosis of cGVHD
cGVHD was diagnosed according to generally accepted criteria based on careful clinical evaluation and additional biopsies for histological confirmation.21-23 cGVHD was divided into classic cGVHD and overlap cGVHD, with concurrent and overlapping aGVHD and cGVHD features.23 In the present study, we used detectable and/or therapy-requiring features of cGVHD at the 1-year posttransplant control as diagnostic criteria to identify patients with cGVHD.
Preparation of serum samples
Samples were collected during the clinical consultation performed routinely 1 year after the transplant. All venous blood samples were collected into sterile plastic tubes (BD Vacutainer SST Serum Separation Tubes, Becton-Dickinson; Franklin Lakes, NJ) and allowed to coagulate for 120 minutes at room temperature (18°C) before centrifugation (300g for 10 minutes) and serum collection. All samples were immediately frozen and stored at −70°C until analyzed.
Analysis of miRNAs in serum samples
Analysis of miRNA sequencing data were performed using the QIAGEN CLC Genomics Server version 20.0.4 (QIAGEN CLC bio, Aarhus, Denmark). Briefly, the 12-nt unique molecular identifiers (UMIs) between linker sequence and Illumina adapter sequence were extracted from each sample-demultiplexed sequencing reads, and the reads were annotated by the corresponding UMI. After removing all artificial sequences, we discarded reads with <15 nt or >55 nt. Reads with the same or 1-nt differences in their UMIs were grouped together as UMI-grouped reads, and reads from each UMI group were merged to produce a consensus sequence representing a single molecule from the starting RNA sample. These consensus reads were then aligned to miRBase v22 with a maximum mismatch of 2 nt, and the unmapped reads were subsequently mapped to human genome GRCh38 (ENSEMBL).
Bioinformatical and statistical analyses
The trimmed mean of M-values normalization method was used for statistical analysis. This is to compensate for sample-specific effects caused by variation in library size/sequencing depth between samples and to compensate for potential under- and oversampling effects. Unless otherwise stated, differential expression analyses were performed using a multifactorial statistical test based on a negative binomial generalizes linear regression (GLM) implemented in QIAGEN CLC Genomics Server v20.0.4. Bioinformatical analyses were performed using the J-Express package (MolMine AS, Bergen, Norway).24 For hierarchical clustering, all values were mean variance normalized. Statistical analyses and graphical analyses were performed using the Graph Pad Prism version 9.0 for Windows (GraphPad Software, San Diego, CA). Receiver operating characteristics (ROC) curves and the area under the ROC curve (AUC) were used to assess the sensitivity and specificity of miRNA biomarkers for the diagnosis of cGVHD. Least absolute shrinkage and selection operator (LASSO) analysis was further used to enhance the prediction accuracy and interpretability of the resulting statistical model. Youden’s index (J) was used in conjunction with ROC analysis for selecting the optimum cutoff value for calculation of predictive values. Calculation of odds ratio was used for analysis of categorized data.
Results
The majority of patients receiving allo-HSCT develop cGVHD
Fifty of the 79 patients included in the study (63%) had detectable and/or therapy-requiring features of cGVHD 1-year posttransplant. Forty-seven of these 50 patients with cGVHD received systemic immunosuppression with cyclosporine A, mycophenolate mofetil, and/or systemic corticosteroids at the time of sampling, whereas for 3 patients, treatment was initiated at the 1-year posttransplant control. Fourteen of these 47 patients (17% of the whole cohort) received combination treatment of at least 2 immunosuppressives. Of the 79 patients in the study, 24 patients (30%) developed aGVHD, and among these patients, 20 also developed cGVHD (22% of patients). cGVHD patients were classified as having classic cGVHD (n = 39) or overlap syndrome (n = 11) by features of aGVHD and cGVHD persisting after 100 days posttransplant.23 For classic cGVHD patients, the debut of symptoms varied: 17 patients (34% of cGVHD patients) had debut between 3 and 6 months, 6 patients (12%) had debut between 6 and 9 months, and 16 patients (32%) had debut between 9 and 12 months (Table 1; supplemental Figure 1). No significant differences in blood cell count and levels of inflammatory markers; C-reactive protein, albumin, and bilirubin were detected between patients with and without cGVHD (Table 1).
The most frequently affected organs were the liver/bile duct (26 patients [52%]), skin (22 patients [44%]), GI tract (21 patients [42%]), eyes (21 patients [42%]), and mouth (17 patients [38%]). Eight of the 29 patients (28%) without signs of cGVHD received extended cGVHD prophylaxis at 1-year posttransplant due to either previous severe aGVHD and/or the presence of other risk factors for development of cGVHD. Thus, a total of 49 patients (64%) received cyclosporine A 1-year posttransplant. Other treatment approaches for patients with GVHD included systemic corticosteroid therapy (16 patients [32% of cGVHD patients]) and mycophenolate mofetil (5 patients [10% of cGVHD patients]). For additional details regarding patients, transplantation, and cGVHD features, see Table 1 and supplemental Figure 1.
Serum miRNA could be detected among transplanted patients
We first investigated miRNA levels in allo-HSCT recipients 1 year after the transplant. A total of 1380 miRNAs were detected in at least 1 patient, and the distribution of detectable miRNAs demonstrated a heterogeneous pattern (Figure 1A). The number of miRNAs detected among the allo-HSCT patients demonstrated considerable variation. Of the miRNAs 16.9% were detected in 70 to 79 of the patients, 3.5% among 60 to 69 patients, 3.0% among 50 to 59 patients, 3.3% among 40 to 49 patients, 4.2% among 30 to 39 patients, 6.1% among 20 to 29 patients, 11.2% among 10 to 19 patients, 13.6% among 5 to 9 patients, and 38.3% only among 1 to 4 patients (Figure 1B). The number of detectable miRNAs in each patient ranged from 243 to 636, with a median of 427 detectable miRNAs (Figure 1C).

Detection of miRNAs among allo-HSCT patients 1-year posttransplant. The figure demonstrates the detection of miRNAs in serum among allo-HSCT recipients. (A) The panel shows the presence of different miRNAs and their expression. Red color indicates detectable levels in serum, whereas black color indicates levels below the detection limit. Patients are distributed in the vertical columns and miRNAs in the horizontal columns. (B) The pie chart illustrates the distribution of detectable levels among the 1380 miRNAs that were detected in our study. Of the miRNAs 16.9% were detected in 70 to 79 of the patients, 3.5% among 60 to 69 patients, 3.0% among 50 to 59 patients, 3.3% among 40 to 49 patients, 4.2% among 30 to 39 patients, 6.1% among 20 to 29 patients, 11.2% among 10 to 19 patients, 13.6% among 5 to 9 patients, and 38.3% among 1 to 4 patients. Some miRNAs were detected among >70 of the 79 patients in the study, whereas for other miRNAs, only a few patients demonstrated detectable levels in serum. (C) The bar graph indicates the total number of detectable miRNAs among each of the individual patient samples. The number of detectable miRNAs ranged from 243 to 636 miRNAs (median 427 detectable miRNAs).
Detection of miRNAs among allo-HSCT patients 1-year posttransplant. The figure demonstrates the detection of miRNAs in serum among allo-HSCT recipients. (A) The panel shows the presence of different miRNAs and their expression. Red color indicates detectable levels in serum, whereas black color indicates levels below the detection limit. Patients are distributed in the vertical columns and miRNAs in the horizontal columns. (B) The pie chart illustrates the distribution of detectable levels among the 1380 miRNAs that were detected in our study. Of the miRNAs 16.9% were detected in 70 to 79 of the patients, 3.5% among 60 to 69 patients, 3.0% among 50 to 59 patients, 3.3% among 40 to 49 patients, 4.2% among 30 to 39 patients, 6.1% among 20 to 29 patients, 11.2% among 10 to 19 patients, 13.6% among 5 to 9 patients, and 38.3% among 1 to 4 patients. Some miRNAs were detected among >70 of the 79 patients in the study, whereas for other miRNAs, only a few patients demonstrated detectable levels in serum. (C) The bar graph indicates the total number of detectable miRNAs among each of the individual patient samples. The number of detectable miRNAs ranged from 243 to 636 miRNAs (median 427 detectable miRNAs).
miRNA profiles identified by bioinformatical analysis identified 2 distinct patient groups with high association to cGVHD occurrence
First, we set the cutoff value for differentially expressed miRNAs as P < .02 and then identified 21 miRNAs that were differentially expressed between patients with and without cGVHD. Based on the relative expression of these miRNAs, we performed a hierarchical cluster analysis by the use of Pearson correlation as the distance matrix and complete linkage as the coupling method. The cluster analyses divided the patient population in 2 different patient clusters, with 49 and 30 patients in each cluster, respectively (Figure 2). The first group included a high prevalence of cGVHD (37 of 49 patients), with generally high expression profiles of miRNAs, whereas the last group showed a low prevalence of cGVHD, with 17 of 30 patients showing no sign of cGVHD and generally low expression of miRNAs (Figure 2). The frequencies of cGVHD within the miRNA clusters was found to be significant (odds ratio, 4.03; 95% confidence interval [CI], 1.52-10.66, P = .0049).

Hierarchical clustering of miRNA expression profiles and cGVHD patients. We performed a hierarchical cluster analysis (Pearson’s correlation, complete linkage) based on the 21 most discriminative miRNAs identified (P < .02) (Table 2). The heat map, the corresponding dendrograms, and the belonging patient data are demonstrated in the figure. Green indicates high relative miRNA expression levels, whereas blue indicates low expression. The patients' characteristics are given in the columns above. We identified 2 main patient clusters: the left main cluster includes a major part of patients with cGVHD, whereas the right cluster includes mainly patients without posttransplant cGVHD. Thirty-seven of the 50 cGVHD patients clustered in the group with generally high expression of miRNAs, whereas 17 of the 29 without cGVHD clustered in the group with generally low expression of miRNAs. The frequency of cGVHD patients differed significantly between the 2 main clusters (odds ratio, 4.03; 95% CI, 1.52-10.66, P = .0049). AML, acute myelogenous leukemia; ALL, acute lymphoblastic leukemia; MF, myelofibrosis; MPN, myeloproliferative neoplasia; CLL, chronic lymphocytic leukemia; AA, aplastic anemia; HL, Hodgkin’s lymphoma; BU, busulphan; CY, cyclophosphamide; FLU, fludarabine; TRE, treosulfan; ATG, antithymoglobulin; TBI, total body irradiation; ETO, etoposide.
Hierarchical clustering of miRNA expression profiles and cGVHD patients. We performed a hierarchical cluster analysis (Pearson’s correlation, complete linkage) based on the 21 most discriminative miRNAs identified (P < .02) (Table 2). The heat map, the corresponding dendrograms, and the belonging patient data are demonstrated in the figure. Green indicates high relative miRNA expression levels, whereas blue indicates low expression. The patients' characteristics are given in the columns above. We identified 2 main patient clusters: the left main cluster includes a major part of patients with cGVHD, whereas the right cluster includes mainly patients without posttransplant cGVHD. Thirty-seven of the 50 cGVHD patients clustered in the group with generally high expression of miRNAs, whereas 17 of the 29 without cGVHD clustered in the group with generally low expression of miRNAs. The frequency of cGVHD patients differed significantly between the 2 main clusters (odds ratio, 4.03; 95% CI, 1.52-10.66, P = .0049). AML, acute myelogenous leukemia; ALL, acute lymphoblastic leukemia; MF, myelofibrosis; MPN, myeloproliferative neoplasia; CLL, chronic lymphocytic leukemia; AA, aplastic anemia; HL, Hodgkin’s lymphoma; BU, busulphan; CY, cyclophosphamide; FLU, fludarabine; TRE, treosulfan; ATG, antithymoglobulin; TBI, total body irradiation; ETO, etoposide.
Several miRNAs were significantly differentially expressed in patients with and without cGVHD
Previous studies have indicated roles of single miRNAs in a variety of conditions, such as inflammation and malignant disease We therefore searched for the most discriminative miRNAs between patients with and without cGVHD 1-year posttransplant. By corrections for age and by searching for discriminative miRNAs, we identified 10 miRNAs that clearly appeared to be differentially expressed. These 10 miRNAs were identified by P < .005, false discovery rate (FDR) <0.1, and fold difference >1.3 and were identified in >75 patients (Table 2). The expression of these 10 miRNAs and their geometric mean and geometric standard deviation is presented in Figure 3. Finally, by taking into account multiple comparisons, we performed statistical analysis by calculating the FDR (Table 2).
Most discriminative miRNAs (FDR <0.1) for patients with and without cGVHD
| miRNA | Fold difference | Log fold difference | P value | FDR | Number of patients |
|---|---|---|---|---|---|
| miR-148a-3p | 1.437328 | 0.523389 | .000201 | 0.0264 | 79 |
| miR-365a-3p | 1.863069 | 0.897681 | .000303 | 0.0264 | 76 |
| miR-122-5p | 1.764591 | 0.819334 | .00034 | 0.0264 | 79 |
| miR-378a-3p | 1.34327 | 0.425749 | .000617 | 0.0359 | 79 |
| miR-192-5p | 1.464128 | 0.550042 | .000851 | 0.0396 | 79 |
| miR-194-5p | 1.416809 | 0.502645 | .001335 | 0.0519 | 79 |
| miR-885-5p | 1.810141 | 0.856102 | .001744 | 0.0581 | 77 |
| miR-27b-3p | 1.359085 | 0.442636 | .002402 | 0.0700 | 79 |
| miR-885-3p | 1.817219 | 0.861732 | .003039 | 0.0787 | 79 |
| miR-139-5p | 1.460209 | 0.546175 | .003877 | 0.0903 | 76 |
The table shows the most discriminative miRNAs that separated patients with cGVHD and patients without cGVHD at 1-year control after allo-HSCT. Fold change and P values are defined by multifactorial statistical tests based on a negative binomial generalized linear model. FDR is calculated based on the 233 miRNAs, with <10 undetectable miRNAs among the 79 included patients. The number of patients that had detectable serum levels of each miRNA is shown (far right column).
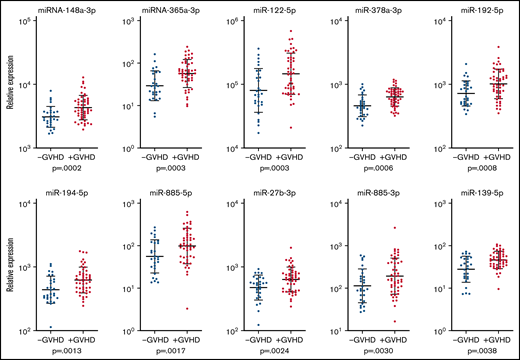
Expression of miRNAs among patients with and without cGVHD 1-year posttransplant. The relative expression in log10 scale of the 10 most significantly expressed miRNAs found among >70 of the patients with and without cGVHD and the corresponding P values based on differential expression analysis are shown for each miRNA. Patients with cGVHD are presented with red dots, and patients without cGVHD are presented with blue dots. The bars indicate geometric mean values plus or minus the geometric standard deviation.
Expression of miRNAs among patients with and without cGVHD 1-year posttransplant. The relative expression in log10 scale of the 10 most significantly expressed miRNAs found among >70 of the patients with and without cGVHD and the corresponding P values based on differential expression analysis are shown for each miRNA. Patients with cGVHD are presented with red dots, and patients without cGVHD are presented with blue dots. The bars indicate geometric mean values plus or minus the geometric standard deviation.
ROC analyses identified highly discriminative miRNAs
Our complete miRNA profile based on differential expression analysis identified five miRNAs to be significantly associated with cGVHD: miR-365a-3p, miR-148a-3p, miR-122-5p, miR-378a-3p, and miR-192-5p. All these miRNAs were detected in >75 patients and demonstrated a FDR <0.05. For these 5 miRNAs, we performed individual ROC analyses (Figure 4). The ROC curves had AUCs of 0.729 (95% CI, 0.612-0.846) for miR-365a-3p, 0.720 (95% CI, 0.603-0.837) for miR-148a-3p, 0.715 (95% CI, 0.596-0.834) for miR-122-5p, 0.732 (95% CI, 0.612-0.852) for miR-378a-3p, and 0.688 (95% CI, 0.568-0.807) for miR-192-5p. Hence, all these 5 miRNAs were considered discriminative for cGVHD, with potential to be examined further as candidate biomarkers for diagnostic purposes for cGVHD.

ROC analysis of highly discriminative miRNAs. The five miRNAs miRa-365-3p, miR-148a-3p, miR-122-5p, miR-378a-3p, and miR-192-5p were the most discriminative miRNAs for the probability of cGVHD based on the differential expression analysis and were detected in >75 patients. The figure demonstrates the ROC curves for these 5 miRNAs. (A) The AUC was 0.729 (95% CI, 0.612-0.846) for miR-365a-3p. (B) The AUC was 0.720 (95% CI, 0.603-0.837) for miR-148a-3p. (C) The AUC was 0.715 (95% CI, 0.596-0.834) for miR-122-5p. (D) The AUC was 0.732 (95% CI, 0.612-0.852) for miR-378a-3p. (E) The AUC was 0.688 (95% CI, 0.568-0.807) for miR-192-5p. (F) The figure demonstrates the correlation coefficients for the relative expression of the 5 miRNAs miR-365a-3p, miR-148a-3p, miR-122-5p, miR-378a-3p, and miR-192-5p.
ROC analysis of highly discriminative miRNAs. The five miRNAs miRa-365-3p, miR-148a-3p, miR-122-5p, miR-378a-3p, and miR-192-5p were the most discriminative miRNAs for the probability of cGVHD based on the differential expression analysis and were detected in >75 patients. The figure demonstrates the ROC curves for these 5 miRNAs. (A) The AUC was 0.729 (95% CI, 0.612-0.846) for miR-365a-3p. (B) The AUC was 0.720 (95% CI, 0.603-0.837) for miR-148a-3p. (C) The AUC was 0.715 (95% CI, 0.596-0.834) for miR-122-5p. (D) The AUC was 0.732 (95% CI, 0.612-0.852) for miR-378a-3p. (E) The AUC was 0.688 (95% CI, 0.568-0.807) for miR-192-5p. (F) The figure demonstrates the correlation coefficients for the relative expression of the 5 miRNAs miR-365a-3p, miR-148a-3p, miR-122-5p, miR-378a-3p, and miR-192-5p.
Development of a 5-miRNA signature highly discriminative for cGVHD
Five miRNAs were identified as significantly differentially expressed, defined both by P < .001 and FDR <0.05, between patients with and without cGVHD: miR-365a-3p, miR-148a-3p, miR-122-5p, miR-378a-3p, and miR-192-5p, and based on the relative expression of these miRNAs, we first performed a hierarchical cluster analysis by use of Euclidean correlation as the distance matrix and complete linkage as the coupling method (Figure 5). The cluster analyses clearly identified a subgroup of patients with increased serum levels of the 5 miRNAs and high occurrence of cGVHD, where 18 of 20 patients had signs of cGVHD (odds ratio, 7.59; 95% CI, 1.61-35.71, P = .0103). Furthermore, we calculated the negative predictive values (NPVs) and the positive predictive values (PPVs) for these 5 miRNAs. All NPVs were >0.70 and all PPVs >0.57 (Table 3).

Development of a miRNA signature highly associated with cGVHD. (A) Based on the relative expression of the 5 miRNAs miRNA-365a-3p, miRNA-148a-3p, miR-122-5p, miR-378a-3p, and miR-192-5p, we performed a hierarchical cluster analysis (Euclidean correlation and complete linkage). This cluster analysis clearly demonstrates that high serum levels of these miRNAs were associated with high frequency of patients with cGVHD. Using LASSO analysis, we identified miR-365a-3p, mir-148a-3p, and miR-378a-3p to be sufficient for the prediction for the diagnostic model. We performed an internal fivefold crossvalidation for our material, and ROC curves were compared. (B) ROC curve for miR-378a-3p without crossvalidation (red) and with crossvalidation (blue); the AUCs were 0.732 and 0.719, respectively. (C) ROC curve for miR-148a-3p without crossvalidation (red) and with crossvalidation (blue); the AUCs were 0.732 and 0.719, respectively. (D) ROC curve for miR-365a-3p without crossvalidation (red) and with crossvalidation (blue); the AUCs were 0.720 and 0.692, respectively. (E) Based on a linear regression model to improve the diagnostic model by use of the 3 miRNAs miR-378a-3p, miR-148a-3p, and miR-365a-3p, the highest AUC was reached. ROC curve without crossvalidation (red) and with crossvalidation (blue) are shown; the AUCs were 0.778 and 0.740, respectively.
Development of a miRNA signature highly associated with cGVHD. (A) Based on the relative expression of the 5 miRNAs miRNA-365a-3p, miRNA-148a-3p, miR-122-5p, miR-378a-3p, and miR-192-5p, we performed a hierarchical cluster analysis (Euclidean correlation and complete linkage). This cluster analysis clearly demonstrates that high serum levels of these miRNAs were associated with high frequency of patients with cGVHD. Using LASSO analysis, we identified miR-365a-3p, mir-148a-3p, and miR-378a-3p to be sufficient for the prediction for the diagnostic model. We performed an internal fivefold crossvalidation for our material, and ROC curves were compared. (B) ROC curve for miR-378a-3p without crossvalidation (red) and with crossvalidation (blue); the AUCs were 0.732 and 0.719, respectively. (C) ROC curve for miR-148a-3p without crossvalidation (red) and with crossvalidation (blue); the AUCs were 0.732 and 0.719, respectively. (D) ROC curve for miR-365a-3p without crossvalidation (red) and with crossvalidation (blue); the AUCs were 0.720 and 0.692, respectively. (E) Based on a linear regression model to improve the diagnostic model by use of the 3 miRNAs miR-378a-3p, miR-148a-3p, and miR-365a-3p, the highest AUC was reached. ROC curve without crossvalidation (red) and with crossvalidation (blue) are shown; the AUCs were 0.778 and 0.740, respectively.
Most discriminative miRNAs for patients with and without cGVHD based on false discovery rates and predictive values
| miRNA | N | FDR | NPV | PPV | NPV-CV | PPV-CV |
|---|---|---|---|---|---|---|
| miR-122-5p | 79 | 0.0264 | 0.700 | 0.746 | 0.588 | 0.758 |
| miR-148-3p | 79 | 0.0264 | 0.548 | 0.838 | 0.554 | 0.824 |
| miR-365-3p | 76 | 0.0264 | 0.645 | 0.812 | 0.643 | 0.763 |
| miR-378a-3p | 79 | 0.0359 | 0.613 | 0.792 | 0.707 | 0.789 |
| miR-192-5p | 79 | 0.0396 | 0.490 | 0.857 | 0.612 | 0.830 |
The table demonstrates the 5 most discriminative miRNAs as separated by patients with cGVHD and patients without cGVHD at 1-year control after allo-HSCT based on FDR. “N” denotes the number of patients with detectable serum levels of each miRNA. Predictive values were calculated by cutoff values set by use of Youden’s index.
NPV-CV, NPVs with crossvalidation; PPV-CV, positive predictive value with crossvalidation.
Crossvalidation identified a 3-miRNA signature highly specific for cGVHD
To reduce the variance of our estimation model, we performed an internal validation of our miRNA data and ROC analyses by using a fivefold crossvalidation. Furthermore, by LASSO analysis, in order to enhance the prediction accuracy and interpretability of the results, we identified that miR-122-5p and miR-192-5p did not contribute to the diagnostic model, hence the use of the 3 miRNAs miR-365a-3p, miR-148a-3p, and miR-378a-3p for further analysis. As expected, the predictive power (ie, the AUC) was lower after the internal fivefold crossvalidation for individual miRNAs, although the AUC was still significant. The ROC curves AUCs declined after crossvalidation, from 0.729 to 0.713 for miR-365a-3p, from 0.720 to 0.692 for miR-148a-3p, and from 0.732 to 0.719 for miR-378a-3p (Figure 5). Furthermore, we calculated the NPVs and the PPVs based on fivefold crossvalidation and by use of Youden’s index, and for these 3 miRNAs, the crossvalidated NPVs were >0.70, and all cross-validated PPVs were >0.60 (Table 3). Finally, based on the LASSO analysis, we made a linear regression model to improve the diagnostic model by use of the 3 miRNAs miR-378a-3p, miR-148a-3p, and miR-365a-3p. Based on this model, we obtained the highest and most significant AUC, reaching 0.778 and 0.740, without and with crossvalidation, respectively (Figure 5). Hence, the NPV and PPV with use of Youden’s index were 0.645 and 0.819, respectively.
Discussion
cGVHD is a major contributor to morbidity and mortality after allo-HSCT.5 cGVHD is a pleiotropic, multiorgan syndrome involving tissue inflammation and development of fibrosis, ultimately leading to organ dysfunction.5 Given the disease’s heterogeneity of clinical manifestations, it is believed that both patient, donor, and transplant factors modulate the phenotype. In our present study, among 79 allografted patients, 50 (63%) patients had signs and/or symptoms of cGVHD. This prevalence of cGVHD is in concordance with other studies and reflects the high prevalence of this condition among allo-HSCT recipients.23,25,26 Several organ systems were also affected among our cohort of cGVHD patients, also reflecting the representativeness of our patients’ cohort in the setting of cGVHD studies.
The last decade has seen a growing interest and understanding of miRNAs, both in malignant diseases, inflammatory conditions, and other diseases.27 miRNAs act as posttranscriptional regulators predominantly by facilitating mRNA degradation or inhibiting translation. For most miRNAs, multiple, even hundreds of, target mRNAs have been predicted.14 Conversely, mRNAs frequently contain binding sites for multiple miRNAs.27 Thus, miRNAs are likely to play diverse roles in controlling gene expression in different contexts dependent on both miRNA and mRNA concentration and their binding affinity. The role of miRNAs has also been studied in GVHD; however, the majority of these studies have been performed in aGVHD, and our knowledge of miRNAs in cGVHD is generally limited and deficient.14,15,28 In this study, we examined a broad profile of serum miRNAs in patients who have completed allo-HSCT. To our knowledge, this is the first study of a larger miRNA profile analysis among allo-HSCT patients, with a major focus on cGVHD. We found that analysis of miRNAs was feasible in frozen serum samples, and the quality controls for the samples were satisfactory even after several years of freezing. A heterogeneous pattern of miRNAs was identified among allo-HSCT recipients, and a large quantity of miRNAs were detected in the majority of patients. Hence, we conclude that broad miRNA profiles may be identified among allo-HSCT recipients 1 year after transplant.
We searched for discriminative miRNAs, which were differentially expressed between patients who developed cGVHD and those who did not develop cGVHD. We then identified different miRNAs that were significantly differentially expressed between patients with cGVHD and patients without cGVHD. Given the pleiotropic effects of miRNAs, we sought to study miRNA profiles rather than single miRNAs. We applied bioinformatical tools to study miRNA profiles in allo-HSCT recipients and were able to identify different patient clusters based on miRNA profiles. In the 2 main clusters identified by hierarchical cluster analysis, a significant unequal distribution of patients with cGVHD was identified, with high overexpression of cGVHD patients in 1 cluster. Most of the miRNAs identified were upregulated among cGVHD patients. For the 10 most discriminative miRNAs identified, we searched the literature for involvement of these miRNAs in malignant and inflammatory diseases and found several studies where these miRNAs are associated with these types of conditions (Table 4). We extensively reviewed the literature to search for previous publications supporting the involvement of the most discriminative miRNAs identified in our study in cGVHD pathophysiology. miR-365a-3p was the most highly significant altered miRNA between patients with and without cGVHD. A previous study has demonstrated that miR-365a is associated with nuclear factor κ-B (NF-κB), and induced expression of NF-κB subunit induces an upregulation of the miR-365 promoter activity.29 NF-κB is involved in expression of several inflammatory mediators and is believed to be crucial in GVHD pathophysiology.30 Furthermore, miR-365 seems to be a direct negative regulator of interleukin-6 (IL-6).29 IL-6 was previously believed to be associated with proinflammatory effects; however, more recent evidence supports a more pleiotropic effect of IL-6 in inflammatory conditions.31 miR-148a-3p was also one of the miRNAs highly associated with cGVHD. miR-148a-3p has also previously been found to be significantly increased in GVHD patients, and interestingly, extracorporeal photopheresis levels significantly decreased the miR-148a-3p expression levels.32 Furthermore, miR-148a seems to activate Th1 cells, and induced expression of miR-148a is believed to be crucial for chronic inflammation.33 miR-148a downregulates expression of the proapoptotic gene Bim,33 resulting in survival of inflammatory generating T cells.33 Another miRNA associated with cGVHD in our study, miRNA-378a-3p, has previously been found differentially expressed in patients with primary Sjogren’s syndrome compared with healthy controls.34 This chronic autoimmune syndrome has several common characteristics with cGVHD, especially symptoms from secretory glands resembling cGVHD, and hence can indicate a potential role of miR-378a-3p in this process.34
Identified miRNAs involved in GVHD, malignant conditions, or inflammatory conditions, based on PubMed literature search
| miRNA | GVHD | Malignancies | Inflammation |
|---|---|---|---|
| miR-365a-3p | 35 | 29 | |
| miR-148a-3p | 32 | ||
| miR-122-5p | 36 | ||
| miR-378a-3p | 37 | 38 | |
| miR-192-5p | 39 | 40 | |
| miR-194-5p | 41 | 42 | |
| miR-885-5p | 43 | 44 | |
| miR-27b-3p | 45 | 46 | |
| miR-885-3p | 47 | 48 | |
| miR-139-5p | 49 | 50 |
The table shows the miRNAs found to be discriminative between GVHD and non-GVHD patients, and publications indicate a role of the specific miRNA in GVHD, malignant diseases, or inflammatory diseases.
No biomarkers of cGVHD have so far been established as useful in clinical practice, although the search for such markers have been an attractive research goal for several years. An ideal biomarker should be easily measured, produce rapid results from readily available sources, have a high sensitivity and specificity, allow early detection, and should be greatly up- or downregulated. Based on these considerations, our study clearly indicates that miRNA, or miRNA profiles, could have potential for establishing a fundament for use as a noninvasive biomarker in cGVHD. We found that the 5 miRNAs miR-365a-3p, miR-148a-3p, miR-122-5p, miR-378a-3p, and miR-192-5p were most significantly elevated in the serum of patients with cGVHD when compared with non-cGVHD patients. Based on only 3 miRNAs, miR-365-3p, miR-148-3p, and miR-378-3p, we developed a miRNA signature that, by linear regression in a fivefold crossvalidation model, demonstrated to be robust as a potential diagnostic biomarker model for cGVHD.
Our study has some limitations. It should be emphasized that the implications of single miRNAs and miRNA profiles, including their potential use as biomarkers, are limited due to present technology established in most clinical settings. Furthermore, the timing of sample acquisition is critical, and immunosuppression therapy might alter the miRNA patterns. In addition, newly diagnosed and established patients with cGVHD were studied together, although the cumulated pathological process may differ in these patients. However, these challenges are often similar in all studies evaluating cGVHD, and the discovery, validation, and reproducibility of biomarkers remains an obstacle.8-11 Finally, antithymoglobulin (ATG) has recently been demonstrated to significantly decrease the incidence of GVHD after allo-HSCT51 and hence is more regularly added to the GVHD prophylactic regimen. For our patients, ATG was not routinely used, and the effect of ATG on miRNAs profiling is hence unknown. Finally, ideal biomarkers should also be predictive (ie, in the setting of allo-HSCT, identify patients who are more likely than other patients to develop complications [ie, cGVHD]).13 If an increase in serum levels of specific miRNAs could also precede development of cGVHD remains unanswered, although this is an important question for future studies. Taken together, we believe the evidence for miRNAs in cGVHD pathophysiology and their potential use as noninvasive biomarkers are convincing, although future and larger confirming studies are needed.15
Conclusions
To conclude, the present miRNA profiling study was conducted to identify serum miRNA signatures associated with cGVHD, and our observations suggest that cGVHD is associated with significant alterations in miRNA serum profiles. We conclude that miRNAs are differentially expressed among patients with and without cGVHD, although further and larger studies are needed to validate the present findings, and more investigations must be done to evaluate the potential diagnostic and prognostic impact of circulating miRNAs among allo-HSCT recipients.
Acknowledgments
The technical support of Karen Marie Hagen and Kristin Paulsen Rye is greatly appreciated. The research project was funded by Helse Vest, Rakel and Otto Kristian Bruuns fund, Øyvind Mølbach Petersens fund, and Norwegian Society of Internal Medicine.
Authorship
Contribution: H.R. and K.J.H. contributed to conceptualization, resources, and supervision; H.R and M.H.S. contributed to methodology, visualization, and software; H.R. contributed to formal analysis, project administration, funding acquisition, data curation, and preparing the original draft; H.R., A.K.V., S.J., A.L.H., K.A.M., T.H.A.T., and K.J.H. contributed to investigation; and H.R., A.K.V., S.J., A.L.H., M.H.S., K.A.M., T.H.A.T., and K.J.H. contributed to reviewing and editing.
Conflict-of-interest disclosure: The authors declare no competing financial interests.
Correspondence: Håkon Reikvam, Department of Medicine, Haukeland University Hospital, N-5021 Bergen, Norway; e-mail: hakon.reikvam@uib.no.

