

Key Points
R-B with ASCT and MR is a feasible first-line strategy for younger, transplant-eligible patients with MCL.
R-B with ASCT and MR achieves outcomes comparable to R-CHOP/R-DHAP with ASCT.

Abstract
The objective of this study was to explore differences in outcomes between first-line rituximab plus bendamustine (R-B) and R-CHOP/R-DHAP (rituximab, cyclophosphamide, doxorubicin, vincristine, prednisone, dexamethasone, cytarabine, cisplatin) in transplant-eligible patients with mantle cell lymphoma (MCL). A population-based cohort of 97 patients aged 18 to 65 years with stage II-IV MCL, consecutively treated with R-B was retrospectively identified at BC Cancer. Baseline characteristics, response rates, and outcomes were compared with the cohort of 232 patients with MCL randomized to the R-CHOP/R-DHAP arm of the MCL Younger trial. The primary endpoint was the hazard ratio (HR) of the progression-free survival (PFS) comparison between both groups, adjusted for MCL International Prognostic Index (MIPI), Ki67 index, and blastoid/ pleomorphic morphology. Ann Arbor stage, lactate dehydrogenase, MIPI, blastoid morphology, and MCL35 assignments were similar between both groups. The overall response rate (ORR) to R-B was 90% (54% complete response [CR]); 77% of patients proceeded to autologous stem cell transplantation (ASCT) and 78% received maintenance rituximab (MR). The ORR to R-CHOP/R-DHAP was 94% (54% CR); 78% proceeded to ASCT and 2% received MR. There were no differences in PFS in unadjusted (HR, 0.87; 95% confidence interval [CI], 0.53-1.41; P = .56) or adjusted (HR, 0.79; 95% CI, 0.45-1.37; P = .40) comparisons. There were no clear differences in secondary endpoints in unadjusted or adjusted analyses. This retrospective adjusted comparison of 2 independent cohorts of younger patients with MCL suggests that R-B with ASCT and maintenance rituximab is a feasible and effective first-line treatment, with outcomes comparable to R-CHOP/R-DHAP with ASCT.
Introduction
The standard first-line therapy for mantle cell lymphoma (MCL) in young, fit patients incorporates rituximab (R) with cytotoxic chemotherapy followed by high-dose chemotherapy and autologous stem cell transplantation (ASCT) followed by maintenance rituximab (MR).1 The European MCL Younger trial showed that alternating R-CHOP (rituximab, cyclophosphamide, vincristine, and prednisone)/R-DHAP (rituximab, dexamethasone, cytarabine, cisplatin) and ASCT is associated with a longer time to treatment failure (hazard ratio [HR], 0.60; 95% confidence interval [CI], 0.47-0.76) and overall survival (OS; HR, adjusted for MCL International Prognostic Index [MIPI] score, 0.74; 95% CI, 0.56-0.98) compared with R-CHOP and ASCT.2,3 Furthermore, the LyMa trial showed that 3 years of MR after 4 cycles of R-DHAP and ASCT is associated with improved progression-free survival (PFS) and OS compared with observation.4 MR can also be considered after ASCT consolidation following alternative induction regimens.5
Rituximab in combination with bendamustine (R-B) achieves higher response rates and PFS compared with R-CHOP in stem cell transplant-ineligible patients with less toxicity.6,7 In transplant-eligible patients, R-B achieves response rates, ASCT rates, and outcomes that are comparable to those historically achieved with R-CHOP. In that study, patients consistently received 2 years of MR after ASCT.8
The Southwest Oncology Group 1106 randomized clinical trial compared R-B against R-Hyper-CVAD (hyperfractionated rituximab, cyclophosphamide, vincristine, doxorubicin, prednisone, methotrexate, cytarabine) before ASCT. Although the study was terminated early because of higher toxicity and lower rates of stem cell mobilization in the R-Hyper-CVAD arm, response rates, minimal residual disease (MRD) negativity, and outcomes were favorable and similar between both regimens (5-year PFS: 66% R-B vs 62% R-Hyper-CVAD; 5-year OS: 80% R-B vs 74% R-Hyper-CVAD).9 Collectively, these data support that use of R-B should be further explored in the transplant-eligible population.
R-B can be administered in the outpatient setting with less toxicity than R-CHOP/R-DHAP or R-Hyper-CVAD. However, R-B has never been compared with R-CHOP/R-DHAP as induction therapy before ASCT. The objective of this study was to explore differences in outcomes achieved using first-line R-B followed by ASCT and R maintenance in a real-world cohort from British Columbia (BC), Canada, against the R-CHOP/R-DHAP+ASCT arm of the randomized European MCL Younger trial in a retrospective, adjusted pooled individual patient data analysis.
Methods
R-B cohort
Patients aged 18 to 65 years with stage II to IV MCL and consecutively treated with first-line R-B between June 2013 and January 2020 were identified using the BC Cancer Centre for Lymphoid Cancer clinical and pathology databases, which have been previously described.8,10 The subgroup of patients treated with first-line R-B before December 2018 has been previously described,8 and their follow-up was updated for the present analysis. All eligibility criteria of the MCL Younger trial were retrospectively applied when selecting the R-B group. Patients with Eastern Cooperative Oncology Group (ECOG) performance status 3 to 4, pregnancy or lactation, or severely impaired cardiac, pulmonary, hepatic (transaminases > 3 times upper limits of normal or total bilirubin > 34.2 μmol/L), or renal (creatinine > 2 times upper limit of normal) function, unless related to lymphoma, were excluded.2
In BC, 6 cycles of R-B have been recommended as first-line therapy for all patients with MCL regardless of age or fitness since June 2013. Transplant-eligible patients responding to R-B proceed to high-dose BEAM (carmustine, etoposide, cytarabine, and melphalan) and ASCT. MR, administered every 3 months for 2 years, is also recommended for responding patients after ASCT.8
Patients underwent response assessment after completion of induction therapy and after ASCT, generally with computed tomography (CT) scans with or without bone marrow biopsies. During MR, patients were assessed before each scheduled dose. Following completion of MR, patients were assessed according to physician discretion, generally every 3 to 6 months, with no specific guidelines indicating frequency of follow-up or imaging investigations, particularly in asymptomatic patients without clinical concern for relapse or progression.
R-CHOP/R-DHAP cohort
Patients aged 18 to 65 years with stage II to IV MCL who were randomized to the R-CHOP/R-DHAP arm of the MCL Younger trial and included in the primary analysis during July 2004 to March 2010 were identified. Patients were planned to receive a total of 6 cycles of chemotherapy including 3 of R-CHOP alternating with 3 of R-DHAP followed by high-dose cytarabine-containing chemotherapy and total body irradiation conditioning and ASCT. MR after ASCT was not recommended in this study as it was not yet standard of care. Patients were followed every 3 months until progression, and CT scans were performed every 6 months.2
Response assessment
In both cohorts, response after 6 cycles of first-line induction therapy was evaluated with CT scans, with or without bone marrow biopsies, and assessed using the 1999 International Working Group criteria.11 Cases with radiologic unconfirmed complete response in whom bone marrow biopsy for response assessment was not performed or available were conservatively downgraded to a partial response. In the R-B cohort, these criteria were centrally and retrospectively applied exclusively for purposes of the current analysis, whereas in the R-CHOP/R-DHAP cohort, these criteria were applied by local investigators during the course of the trial. Positron emission tomography scans or gastrointestinal biopsies were not routinely performed in either cohort. MRD assessments were not performed in the R-B cohort.
Gene expression profiling (MCL35 assay)
At baseline, diagnostic formalin-fixed paraffin-embedded tumor samples, when available from both cohorts, were extracted for the MCL35 assay. After extraction, gene expression was quantified from 200 ng RNA on the NanoString platform (NanoString Technologies, Seattle, WA), with a predefined code set interrogating for expression of 17 proliferation genes and 18 housekeeping genes (MCL35 assay), using the “high sensitivity” setting of the second-generation nCounter Prep Station and 490 fields of view. Normalization for RNA loading was performed using the geometric mean of 18 housekeeping genes, and if this was below a predefined threshold, the assay was deemed to have failed.12-15
Statistical analysis
Characteristics between cohorts were compared using descriptive statistics. Survival outcomes were summarized using the Kaplan-Meier method, and differences between groups were exploratively compared using the log-rank test. Multivariate Cox models were fitted to evaluate the effect of treatment strategy between cohorts, adjusted for relevant prognostic factors.
The primary end point was PFS with the HR of the comparison between both groups, adjusted for MIPI score as a continuous variable, Ki67 index (≥30% vs <30%), and blastoid/pleomorphic morphology as the primary effect measure. Additional analyses were performed evaluating the HR adjusted for each of the following single variables: MIPI score as a continuous variable, individual MIPI variables, Ki-67 index, and blastoid/pleomorphic morphology. The adjusted HR was also evaluated for combinations of these variables. MCL35 results were not included in the multivariate models because of incomplete data.
PFS was calculated from the initiation of first-line therapy to date of first progression/relapse, with censoring at date of last remission for patients without progression/relapse or date of next lymphoma therapy initiation for patients without preceding progression/relapse. Secondary end points included response rates, ASCT rates, event-free survival (EFS), OS, and time to next treatment (TTNT). EFS was calculated from the date of start of first-line therapy to date of first progression/relapse, date of next lymphoma therapy (independent of progression/treatment failure), or date of death from any cause. OS was calculated from the date of start of first-line therapy to the date of death from any cause. Follow-up was calculated by the reverse Kaplan-Meier method. In this analysis, patients with PFS, EFS, or OS events were censored for observation time due to their event. Patients without an event were counted as events at end of observation. Analyses were performed using SPSS 14 and IBM SPSS Statistics Subscription (11-2018).
TTNT was calculated from the date of start of first-line therapy to the date of start of the next line of therapy. TTNT was estimated using competing risk analysis, treating death without next line of treatment as a competing event. TTNT analyses were performed using the cmprsk package of The R Project for Statistical Computing, version 4.0.3. Studies were approved by their governing Research Ethics Boards. The studies were conducted according to the Declaration of Helsinki.
Results
Baseline characteristics
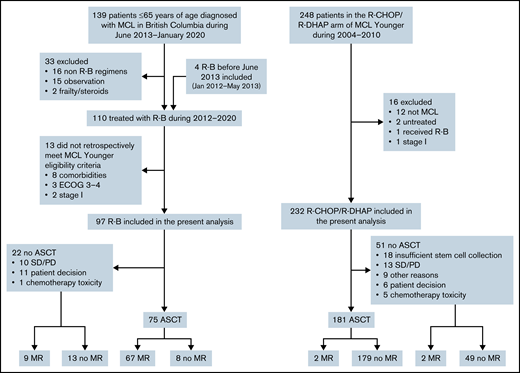
A total of 139 patients 18 to 65 years of age were diagnosed with MCL in BC between June 2013 and January 2020. Of these, 16 were treated with non R-B regimens, most commonly R-CHOP/R-DHAP or R-CHOP according to physician discretion. Thirteen patients did not meet MCL Younger trial eligibility and were excluded. Additionally, 4 patients who received R-B before June 2013 were identified and included in this analysis. A total of 97 patients who received R-B were included (Figure 1). The 232 patients with MCL treated with R-CHOP/R-DHAP in the primary analysis of the MCL Younger trial were included.
Ann Arbor stage, lactate dehydrogenase ratio to the upper limit of normal, MCL35 risk groups, and blastoid/pleomorphic morphology were similar between both groups. Patients treated with R-B were older, had slightly worse performance status, had a greater proportion with Ki67 ≥ 30%, and showed a trend toward higher MIPI risk (Table 1). Immunohistochemical or molecular testing for TP53 alterations was not performed.
Baseline characteristics
| Characteristic | R-B (n = 97) | R-CHOP/R-DHAP (n = 232) | P |
|---|---|---|---|
| Median year (range) | 2016 (2012-2020) | 2007 (2004-2010) | <.001 |
| Age, y | |||
| Median (range) | 58 (40-65) | 56 (32-65) | <.001 |
| Age ≥ 60, n (%) | 42 (43) | 64 (27) | .004 |
| Male sex, n (%) | 60 (62) | 183 (79) | .001 |
| Ann Arbor stage, n (%) | .17 | ||
| II | 4 (4) | 10 (4) | |
| III | 6 (6) | 31 (13) | |
| IV | 87 (90) | 191 (82) | |
| Bone marrow involvement, n (%) | 76 (78) | 173 (75) | .47 |
| B symptoms, n (%) | 11/78 (14) | 71 (31) | .004 |
| ECOG performance status, n (%) | <.001 | ||
| 0 | 30 (31) | 150 (65) | |
| 1 | 54 (56) | 73 (32) | |
| 2 | 13 (13) | 9 (4) | |
| Lactate dehydrogenase | |||
| Lactate dehydrogenase/upper limits of normal ratio (range) | 0.81 (0.41-3.26) | 0.89 (0.41-12.2) | .30 |
| Elevated, n (%) | 27 (28) | 81 (35) | .21 |
| WBC count × 109/L (range) | 7.0 (3.1-136) | 7.6 (1.1-323.8) | .34 |
| MIPI | |||
| MIPI score (range) | 5.65 (4.58-7.82) | 5.56 (4.07-8.68) | .089 |
| MIPI risk category, n(%) | .16 | ||
| Low risk | 53 (55) | 150 (65) | |
| Intermediate risk | 24 (25) | 51 (22) | |
| High risk | 20 (21) | 31 (13) | |
| Blastoid/pleomorphic, n (%) | 7 (7) | 14/169 (8) | .76 |
| Ki67 index | |||
| Median (range) | 25 (5-90) | 21 (1.5-95) | .14 |
| ≥30%, n (%) | 40/89 (45) | 34/129 (26) | .004 |
| MCL35 risk group, n (%) | .60 | ||
| Low risk | 27/50 (54) | 21/36 (58) | |
| Standard risk | 17/50 (34) | 13/36 (36) | |
| High risk | 6/50 (12) | 2/36 (6) | |
Archived formalin-fixed paraffin-embedded tissue from diagnosis was available and retrieved from N = 50 and N = 36 patients from the real-world and trial cohorts, respectively. There were no differences in MCL35 risk groups between cohorts, although note is made of the >2:1 difference in retrieved material between these cohorts.
Response rates and outcomes
The overall response rate (ORR) to R-B was 90% (54% complete response [CR]); 77% patients proceeded to ASCT, and 78% received maintenance rituximab (MR). The ORR to R-CHOP/R-DHAP was 94% (54% CR, including CR unconfirmed); 78% proceeded to ASCT, and 2% received MR (Figure 1; Table 2). In the 12 patients on R-B who did not proceed with ASCT for reasons other than stable disease/progressive disease, reasons were patient preference (n = 11) and physician decision based on toxicity of R-B (n = 1). There were no cases with failure to mobilize stem cells after R-B. Conversely, 18 of 36 responding patients who did not proceed with ASCT after R-CHOP/R-DHAP had insufficient stem cell mobilization. The other more frequent reasons were patient choice (n = 6) and toxicity of induction chemotherapy (n = 5).
Response rates, additional therapies after induction, and subsequent outcomes
| R-B | R-CHOP/R-DHAP | P | |
|---|---|---|---|
| Response rates and additional first line therapies | N = 97 | N = 232 | |
| Response rates after induction, n (%) | |||
| Complete response | 52 (54) | 122/226* (54) | |
| Partial response | 35 (36) | 91/226 (40) | |
| Stable disease | 2 (2) | 5/226 (2) | |
| Progressive disease | 8 (8) | 8/226 (4) | |
| ASCT, n (%) | 75 (77) | 181 (78) | .890 |
| Maintenance rituximab, n (%) | 76 (78) | 4 (2) | <.001 |
| Time-to-event outcomes from start of induction | N = 97 | N = 232 | |
| PFS from start of induction | |||
| Median, years (95% CI) | NR† | 9.5 (6.5-12.6) | .564 |
| 5-y rate (95% CI) | 76% (58-94) | 68% (62-74) | |
| EFS from start of induction | |||
| Median, years (95% CI) | NR† | 7.9 (5.9-10) | .570 |
| 5-y rate (95% CI) | 70% (51-89) | 65% (59-71) | |
| OS from start of induction | |||
| Median, years (95% CI) | NR† | 13.8 (9.5-18.1) | .443 |
| 5-y rate (95% CI) | 79% (64-94) | 77% (72-82) | |
| TTNT from start of induction | |||
| Median, years (95% CI) | NR† | NR | .918 |
| 5-y rate (95% CI) | 24% (14-36) | 27% (21-33) | |
| Time-to-event outcomes from ASCT | N = 75 | N = 181 | |
| PFS from ASCT | |||
| Median, years (95% CI) | NR† | NR | .095 |
| 5-y rate (95% CI) | 87% (63-100) | 75% (68-82) | |
| EFS from ASCT | |||
| Median, years (95% CI) | NR† | 9.4 (6.9-11.9) | .342 |
| 5-y rate (95% CI) | 79% (56-100) | 73% (66-80) | |
| OS from ASCT | |||
| Median, years (95% CI) | NR† | 13.4 (7.2-19.6) | .137 |
| 5-y rate (95% CI) | 88% (74-100) | 80% (74-86) | |
| TTNT from ASCT | |||
| Median, years (95% CI) | NR† | NR | .373 |
| 5-y rate (95% CI) | 14% (0-35) | 20% (13-26) | |
Six patients excluded: induction treatment aborted without restaging.
Median outcomes not reached in the R-B group because of insufficient duration of follow-up.
After a median follow-up of 4.3 years (range, 0.2-7.6 years) in the R-B group and 7.1 years (range, 0.1-14.8 years) in the R-CHOP/R-DHAP group, there were no differences in PFS between both groups in an unadjusted analysis (5-year rate, 76% vs 68%, respectively; HR, 0.87; 95% CI, 0.53-1.41; P = .56; Figure 2A). Similarly, the PFS HR for the comparison of R-B vs R-CHOP/R-DHAP adjusted for MIPI, Ki67 ≥ 30%, and blastoid/pleomorphic morphology was 0.79 (95% CI, 0.45-1.37; P = .40). The HRs were below 1 but far from statistical significance in models adjusting the treatment comparison for MIPI score, individual MIPI variables, Ki67, or blastoid/pleomorphic morphology individually or in combinations (Table 3).
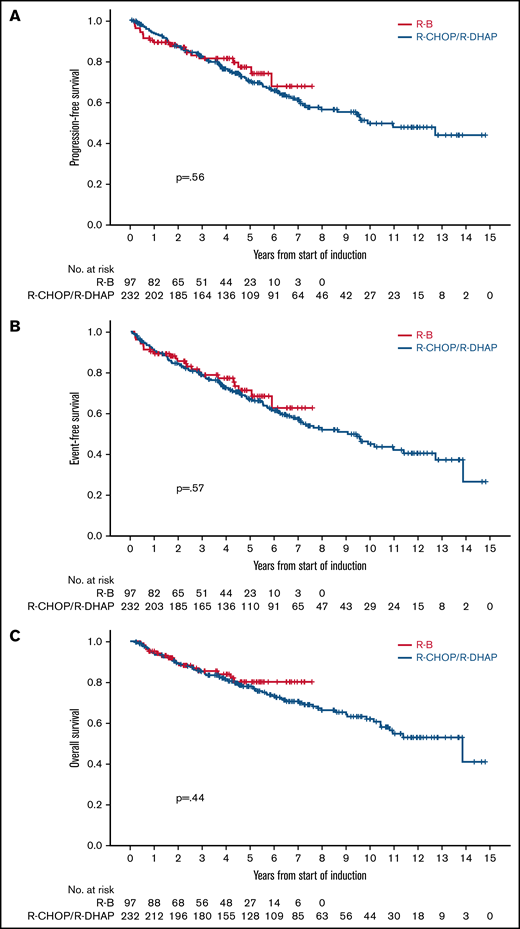
Crude outcome comparisons between R-B and R-CHOP/R-DHAP. (A) PFS. (B) EFS. (C) OS.
Crude outcome comparisons between R-B and R-CHOP/R-DHAP. (A) PFS. (B) EFS. (C) OS.
Crude and adjusted PFS, EFS, and OS comparisons between R-B and R-CHOP/R-DHAP
| Variable(s) in the model | n | PFS | EFS | OS | ||||
|---|---|---|---|---|---|---|---|---|
| R-B | R-CHOP/R-DHAP | HR (95% CI) | P | HR (95% CI) | P | HR (95% CI) | P | |
| Unadjusted analyses | ||||||||
| R-B vs R-CHOP/R-DHAP | 97 | 232 | 0.87 (0.53-1.41) | .56 | 0.88 (0.56-1.37) | .57 | 0.81 (0.46-1.40) | .44 |
| MIPI continuous R-B | 97 | N/A | 3.65 (1.94-6.85) | <.001 | 3.26 (1.78-5.96) | <.001 | 3.94 (2.0-7.76) | <.001 |
| MIPI continuous R-CHOP/R-DHAP | N/A | 232 | 1.78 (1.31-2.42) | <.001 | 1.92 (1.46-2.52) | <.001 | 2.33 (1.72-3.15) | <.001 |
| Blastoid/pleomorphic vs not R-B | 97 | N/A | 4.16 (1.39-12.47) | .011 | 3.5 (1.19-10.27) | .023 | 3.75 (1.07-13.21) | .039 |
| Blastoid/pleomorphic vs not R-CHOP/R-DHAP | N/A | 169 | 1.63 (0.78-3.44) | .196 | 1.72 (0.88-3.35) | .110 | 1.73 (0.78-3.83) | .174 |
| Ki67 ≥ 30% vs < 30% R-B | 89 | N/A | 2.08 (0.85-5.1) | .110 | 2.6 (1.1-6.15) | .029 | 2.27 (0.76-6.76) | .143 |
| Ki67 ≥ 30% vs < 30% R-CHOP/R-DHAP | N/A | 129 | 1.88 (1.03-3.44) | .042 | 2.24 (1.31-3.83) | .003 | 2.86 (1.55-5.29) | .001 |
| MCL35 high risk vs not R-B | 50 | N/A | 2.42 (0.67-8.77) | .180 | 2.14 (0.6-7.6) | .240 | 6.65 (1.57-28.2) | .010 |
| MCL35 high risk vs not R-CHOP/R-DHAP | N/A | 36 | 20.5 (2.81-149) | .003 | 21 (2.89-153) | .003 | 20.5 (2.81-149) | .003 |
| Adjusted analyses | ||||||||
| R-B vs R-CHOP/R-DHAP | 97 | 232 | 0.83 (0.51-1.34) | .44 | 0.84 (0.54-1.31) | .44 | 0.76 (0.44-1.32) | .33 |
| MIPI continuous | 2.02 (1.54-2.64) | <.001 | 2.08 (1.63-2.66) | <.001 | 2.54 (1.93-3.34) | <.001 | ||
| R-B vs R-CHOP/R-DHAP | 97 | 169 | 0.84 (0.51-1.39) | .50 | 0.87 (0.55-1.38) | .54 | 0.83 (0.47-1.48) | .54 |
| Blastoid/pleomorphic vs not | 2.06 (1.11-3.81) | .021 | 2.02 (1.14-3.56) | .015 | 2.06 (1.06-4.02) | .034 | ||
| R-B vs R-CHOP/R-DHAP | 89 | 129 | 0.83 (0.48-1.45) | .51 | 0.78 (0.47-1.31) | .34 | 0.63 (0.33-1.19) | .15 |
| Ki67 ≥ 30% vs < 30% | 1.93 (1.17-3.17) | .010 | 2.33 (1.49-3.66) | <.001 | 2.72 (1.59-4.67) | <.001 | ||
| R-B vs R-CHOP/R-DHAP | 89 | 169 | 0.82 (0.47-1.42) | .47 | 0.81 (0.51-1.28) | .36 | 0.69 (0.36-1.31) | .26 |
| MIPI continuous | 2.33 (1.67-3.25) | <.001 | 2.08 (1.58-2.74) | <.001 | 2.88 (2.05-4.05) | <.001 | ||
| Blastoid/pleomorphic vs not | 2.01 (1.04-3.90) | .038 | 1.88 (1.06-3.32) | .030 | 2.13 (1.05-4.30) | .036 | ||
| R-B vs R-CHOP/R-DHAP | 89 | 129 | 0.76 (0.44-1.32) | .33 | 0.78 (0.47-1.30) | .33 | 0.63 (0.33-1.19) | .15 |
| MIPI continuous | 2.18 (1.55-3.08) | <.001 | 2.15 (1.59-2.90) | <.001 | 2.53 (1.78-3.60) | <.001 | ||
| Ki67 ≥ 30% vs < 30% | 1.46 (0.86-2.48) | .16 | 1.91 (1.20-3.04) | .006 | 1.95 (1.08-3.51) | .026 | ||
| R-B vs R-CHOP/R-DHAP | 89 | 114 | 0.81 (0.47-1.42) | .47 | 0.76 (0.45-1.28) | .30 | 0.63 (0.33-1.21) | .16 |
| Ki67 ≥ 30% vs < 30% | 1.73 (1.04-2.89) | .035 | 2.09 (1.32-3.32) | .002 | 2.51 (1.43-4.42) | .001 | ||
| Blastoid/pleomorphic vs not | 2.01 (1.04-3.89) | .039 | 1.92 (1.05-3.52) | .035 | 2.05 (1.02-4.13) | .045 | ||
| R-B vs R-CHOP/R-DHAP | 89 | 114 | 0.79 (0.45-1.37) | .40 | 0.75 (0.45-1.25) | .27 | 0.65 (0.34-1.24) | .19 |
| MIPI continuous | 2.17 (1.53-3.07) | <.001 | 2.14 (1.57-2.93) | <.001 | 2.52 (1.76-3.60) | <.001 | ||
| Ki67 ≥ 30% vs < 30% | 1.38 (0.81-2.36) | .24 | 1.67 (1.03-2.71) | .037 | 1.82 (1.0-3.31) | .050 | ||
| Blastoid/pleomorphic vs not | 1.90 (0.98-3.71) | .058 | 1.81 (0.98-3.34) | .057 | 1.89 (0.93-3.84) | .080 | ||
N/A, not applicable.
There were no clear differences in EFS in unadjusted (5-year rate, 70% vs 65%; HR, 0.88; 95% CI, 0.56-1.37; P = .57; Figure 2B) or adjusted analyses (HR, 0.75; 95% CI, 0.45-1.25; P = .27). There were no differences in OS in unadjusted (5-year rate, 79% vs 77%; HR, 0.81; 95% CI, 0.46-1.40; P = .44; Figure 2C) or adjusted analyses (HR, 0.65; 95% CI, 0.24-1.24; P = .19). The HRs were also below 1 and far from statistical significance in the various adjusted models (Table 3). Outcomes calculated from the point of ASCT (R-B, n = 75; R-CHOP/R-DHAP, n = 181) were also similar between both cohorts (Table 2).
There were 16 (15%) deaths in the R-B cohort: 12 from lymphoma progression, 3 from secondary neoplasia, and 1 unrelated. There were no treatment-related deaths. There were 93 (40%) deaths in the R-CHOP/R-DHAP cohort: 38 from lymphoma progression, 15 during/after salvage treatment, 9 ASCT related, 2 cardiac deaths in first remission, 11 secondary neoplasia, 11 unclear cause, and 7 unrelated.
TTNT
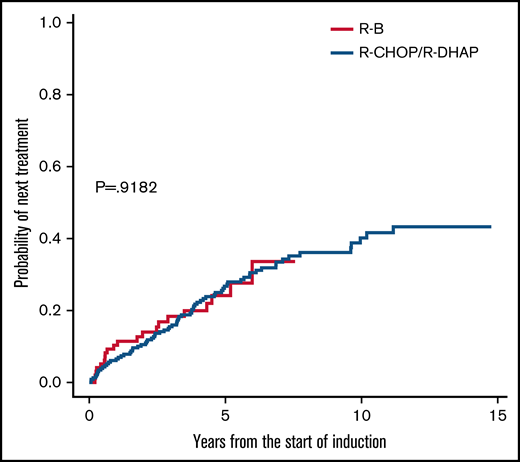
TTNT was also similar in unadjusted analyses (5-year rate, 24% vs 27%; HR, 1.01; 95% CI, 0.62-1.67; P = .918; Figure 3). Next treatments were diverse, with more frequent use of ibrutinib after R-B but more frequent rituximab-based chemotherapy after R-CHOP/R-DHAP (Table 4). About 15% in each group received allogeneic stem cell transplantation.
Next/second-line therapies
| R-B (n = 21) | R-CHOP/R-DHAP (n = 75) | |
|---|---|---|
| Individual treatments | ||
| Cytarabine based | ||
| R-high-dose cytarabine | 0 | 11 (15) |
| R-DHAP | 1 (5) | 9 (12) |
| DEXA-BEAM | 0 | 5 (7) |
| R-Hyper-CVAD | 0 | 2 (3) |
| R-B | 0 | 12 (16) |
| R-FC | 0 | 8 (11)* |
| BTK inhibitor | 11 (52) | 2 (3) |
| R-CHOP | 7 (33) | 1 (1) |
| Bortezomib-based | 0 | 5 (7) |
| Radiation alone | 0 | 4 (5) |
| Temsirolimus | 0 | 3 (4) |
| Other | 2 (10)† | 10 (13)‡ |
| Unknown | 0 | 3 (4) |
| Stem cell transplantation | ||
| Allogeneic | 3 (14) | 11 (15) |
| Autologous | 0 | 5 (7)§ |
DEXA-BEAM, dexamethasone, carmustine, etoposide, cytarabine, melphalan.
Includes 2 patients who also received mitoxantrone.
One R-GDP and 1 HDMTX.
Other: 3 R-ICE, 3 directly to stem cell transplant, 1 intrathecal chemotherapy, 1 rituximab monotherapy, and 1 MCL-002 trial.
None had previously received ASCT as consolidation after R-CHOP/R-DHAP.
Discussion
In this retrospective comparison of 2 independent cohorts of younger patients with MCL, there were no marked differences in any measure of outcome between first-line R-B with ASCT and MR compared with R-CHOP/R-DHAP with ASCT and observation. Outcomes in the R-B cohort were favorable, including 5-year PFS of 76%, EFS of 70%, OS of 79%, and TTNT of 24%. Studies of high-dose cytarabine-containing induction regimens, with or without ASCT, have also shown comparable outcomes in this patient population.3,4,9,16,17 A randomized comparison between R-B vs R-CHOP/R-DHAP is unlikely to occur and hence the rationale for this study.
Despite aligning both cohorts as much as possible by applying uniform eligibility criteria and despite adjusting the HR of the comparison between the 2 strategies according to well-established prognostic factors, there is the potential for residual confounding and other differences between cohorts. These include different population bases, treatment eras, geography, length of follow-up, second-line therapies, and use of imaging investigations. There were incomplete biologic data for Ki67, blastoid/pleomorphic morphology, and MCL35 risk groups, reducing statistical power in the multivariate analyses. Testing for MRD or TP53 alterations was not performed in the R-B cohort.
The R-B cohort had a higher proportion of poor prognostic features including worse performance status and elevated Ki67, likely because this was a nonclinical trial cohort. Collectively, all imbalances biased the R-B cohort toward potentially worse outcomes. Therefore, the comparable outcome results suggest there may be a valid role for R-B with ASCT and MR in this patient population.
Prior data suggest high-risk MIPI, elevated Ki-67, and blastoid/pleomorphic morphology are associated with higher rates of progressive disease after R-B.8,14 It is possible low- or intermediate-risk patients may achieve equally favorable long-term outcomes with the R-B strategy or even with other forms of treatment de-escalation, but this requires further investigation.
R-B can be safely administered in the outpatient setting with less toxicity than with R-CHOP/R-DHAP, although detailed toxicity data were not available in the R-B cohort. There were no instances of insufficient stem cell mobilization after R-B, although this complication impeded ASCT in 8.5% patients in CR/partial response after R-CHOP/R-DHAP.2 There were more treatment-related deaths and deaths from secondary neoplasia in the R-CHOP/R-DHAP cohort, but it is recognized the latter cohort has more than twice the number of patients and longer follow-up for these events to occur. In this nonrandomized comparison, we cannot determine whether the R-CHOP/R-DHAP regimen itself contributed to the higher incidence of procedure related mortality after ASCT, although in the MCL Younger trial, ASCT-related deaths in remission were similar between both arms (3.4% each).2 We speculate differences in treatment-related deaths may be related to changes in supportive care practices between treatment eras, patient selection for ASCT between a single transplant center in BC vs multiple centers in Europe, and use of different high-dose regimens especially the total body irradiation-containing regimen used in the MCL Younger trial.
The differential use of MR between cohorts may also have influenced outcomes. The LyMa trial showed that 3 years of MR after 4 cycles of R-DHAP and ASCT is associated with improved PFS and OS compared with observation.4 Conversely, a subgroup analysis of the MAINTAIN trial suggests that 2 years of MR was not associated with improved PFS or OS after 6 cycles of R-B in transplant-ineligible patients.18 In contrast, large retrospective real-world analyses revealed an improved PFS and OS after R-B followed by MR.19,20 Our data cannot determine whether the use of MR compensated in the long term for the lack of high-dose cytarabine induction and consolidation in patients treated with R-B plus high-dose BEAM and ASCT. Furthermore, 9 of 22 (41%) patients who did not undergo ASCT after R-B received MR, whereas 2 of 51 (4%) who did not undergo ASCT after R-CHOP/R-DHAP received MR. This imbalance may also have improved outcomes in the R-B cohort, although these numbers are small.
Various randomized studies in MCL will evaluate the impact of the addition of novel agents, particularly Bruton tyrosine kinase inhibitors (BTKis), into front-line immunochemotherapy for MCL. The Triangle study (#NCT 02858258) will evaluate the addition of ibrutinib in transplant-eligible patients receiving R-CHOP/R-DHAP and whether ASCT is still justified in these patients. The ECOG/American College of Radiology Imaging Network 4181 study (#NCT 04115631) will evaluate the addition of acalabrutinib in transplant-eligible patients receiving R-B induction with or without cytarabine. Two randomized phase 3 trials (#NCT 01776840 and #NCT 02972840) will evaluate the addition of BTKis in transplant-ineligible patients receiving R-B and MR. Toxicity and efficacy will inform the optimal immunochemotherapy backbone if BTKis are eventually brought into the front-line setting.
In summary, there were no differences in unadjusted or adjusted outcomes between R-B with ASCT and MR vs R-CHOP/R-DHAP with ASCT and observation in this retrospective comparison of 2 independent cohorts of transplant-eligible patients with MCL. R-B with ASCT and MR may be a reasonable first-line strategy for younger, transplant-eligible patients with MCL.
Acknowledgments
Medical writers were not involved in the writing of this manuscript.
This study was funded by National Cancer Institute grant CA217847.
Authorship
Contribution: D.V., E.H., and M.D. designed the research; D.V. and E.H. performed the research and analyzed data; and all authors contributed to the acquisition, analysis, or interpretation of data for this article and drafts of this article, revised the manuscript critically for important intellectual content, approved the final version to be published, and agreed to be accountable for all aspects of the article.
Conflict-of-interest disclosure: D.V. received honoraria/consulting fees from Janssen, Roche, BMS, Celgene, Kite/Gilead, AstraZeneca, Abbvie, Kyowa Kirin, and BeiGene and research funding (to the institution) from Roche and AstraZeneca. K.J.S. received honoraria/consulting fees from BMS, Seattle Genetics, Kyowa, Astra Zeneca, Merck, Gilead, Novartis, Janssen, and DSMC Regeneron and was on the steering committee for Beigene. D.W.S. received consultancy fees from Abbvie, AstraZeneca, Celgene, Incyte, and Janssen and research funding from Janssen, NanoString Technologies, and Roche. D.W.S., C.A.R., and L.M.R. are named inventors on a patent for the MCL35 assay. A.S.G. received research funding from Roche, Astrazeneca, AbbVie, and Janssen and honoraria/consulting fees from Sandoz, Astrazeneca, AbbVie, and Janssen. C.L.F. received honoraria/consulting fees from BMS, Seattle Genetics, Celgene, Abbvie, Sanofi, Incyte, Amgen, and Janssen and research funding from Teva, Janssen, and Roche/Genentech. The remaining authors declare no competing financial interests.
Correspondence: Diego Villa, BC Cancer–Vancouver Cancer Centre, 600 W 10th Ave, Vancouver, BC V5Z 4E6, Canada; e-mail: dvilla@bccancer.bc.ca.

