

Key Points
Posttransplant survival outcomes were comparable between adult patients with Ph-like ALL fusions and other high-risk B-cell ALL.
In patients with Ph-like ALL, RFS was significantly influenced by disease status (P < .001) and conditioning regimen intensity (P = .014).

Abstract
Allogenic hematopoietic cell transplantation (alloHCT) is a well-established curative modality for acute lymphoblastic leukemia (ALL), yet large amounts of data describing alloHCT outcomes in Philadelphia (Ph)-like ALL are lacking. We retrospectively analyzed archived DNA samples from consecutive adults with B-cell Ph-negative ALL who underwent alloHCT in complete remission (CR) (n = 127) at our center between 2006 and 2020. Identification of fusions associated with Ph-like ALL was performed using cumulative results from RNA-seq, conventional cytogenetics, fluorescence in situ hybridization, and whole genome array studies. Fusions associated with Ph-like ALL were detected in 56 (44%) patients, of whom 38 were carrying CRLF2r. Compared with other non–Ph-like ALL (n = 71), patients with fusions associated with Ph-like ALL were more frequently Hispanic (P = .008), were less likely to carry high-risk cytogenetics (P < .001), and were more likely to receive blinatumomab prior to HCT (P = .019). With the median followup of 3.5 years, patients with Ph-like ALL fusions had comparable posttransplant outcomes compared with other B-cell ALL: 3-year relapse-free survival (RFS) (41% vs 44%; P = .36), overall survival (OS) (51% vs 50%; P = .59), and relapse (37% vs 31%; P = .47). In multivariable analysis, age (P = .023), disease status at the time of transplant (P < .001), and donor type (P = .015) influenced OS. RFS (primary endpoint) was significantly influenced by disease status (P < .001) and conditioning regimen intensity (P = .014). In conclusion, our data suggest that alloHCT consolidation results in similarly favorable survival outcomes in adult patients with Ph-like fusions and other high-risk B-cell ALL.
Introduction
Philadelphia (Ph)-like acute lymphoblastic leukemia (ALL) is a recently defined subtype of high-risk B-cell ALL (B-ALL), which harbors a kinase-activated gene expression profile similar to Ph-positive (Ph+) ALL but lacks the BCR-ABL1 fusion.1 Ph-like ALL represents up to 20% of all newly diagnosed cases in adults with B-ALL.2 Disease incidence varies in different ethnic backgrounds and is more common in Americans with Hispanic ethnicity and Guatemalans with Native American heritage.2-6
Ph-like ALL is a heterogenous entity and is subclassified into distinct genetic subcategories encompassing molecular alterations in common pathways. Ph-like ALL with CRLF2-rearrangement/overexpression (CRLF2r) is the most common defined subtype of Ph-like ALL across all ages. This overexpression is often driven by fusions involving CRLF2 with IGH or P2RY8 gene, with almost half of the cases also carrying JAK-STAT signaling pathway mutations. The second major group of Ph-like cases carry fusions involving other tyrosine kinases, including ABL1, ABL2, CSF1R, PDGFRB.1-3,7-10 Fusions affecting ABL kinases can potentially be treated with ABL-type tyrosine kinase inhibitors (TKIs), and those affecting the JAK-STAT pathway (including EPOR) may respond to JAK inhibitors.11-13
When treated with standard frontline chemotherapy-based regimens, compared with other B-ALL subtypes, Ph-like ALL is associated with inferior response with high rate of persistent minimal residual disease (MRD) and disease relapse, translated to lower overall survival (OS).1-3 These inferior outcomes in adult patients occur regardless of the initially used treatment regimen (adult vs pediatric inspired) and are not improved with achieving early MRD in response to therapy.3 Worse outcomes have been reported in in CRLF2r subtype of Ph-like ALL, with 5-year OS of <20% in 1 retrospective study by Jain et al.3
Allogenic hematopoietic cell transplantation (alloHCT) is a well-established curative modality for adults with ALL who are considered at increased risk for relapse.14 AlloHCT has proven to overcome various high-risk leukemia genetics and equalize outcomes.15 Considering that Ph-like ALL is a high-risk genetic marker, it is appealing to recommend alloHCT consolidation routinely for this entity in adults. Nevertheless, with the exception of a few recent reports,16,17 data supporting the role of alloHCT in patients with Ph-like ALL are lacking. Here, we conducted a retrospective analysis to investigate outcomes of alloHCT in adult patients with Ph-like ALL.
Methods
Study participants
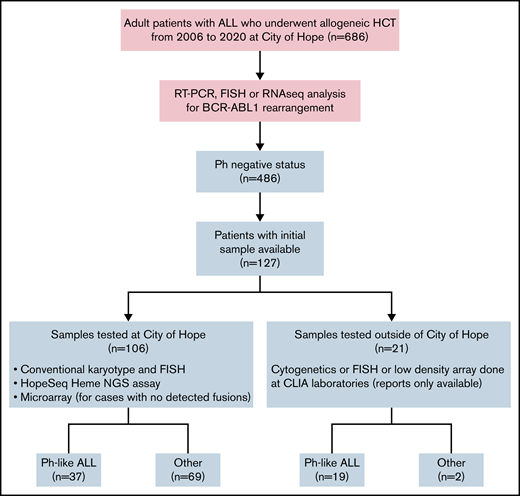
We retrospectively reviewed a consecutive case series of adult patients with Ph-negative B-ALL who underwent alloHCT in complete remission (CR) at our center between 2006 and 2020. The study was approved by the Institutional Review Board at City of Hope National Medical Center and was conducted in accordance with the Declaration of Helsinki. We only included cases with available archived leukemia genetic samples adequate for Ph-like status analysis (n = 106) or those who had documented Ph-like testing (n = 21). Figure 1 depicts the study design.
Data collection
Prior medical history; patient demographic information; cytogenetic and molecular data; prior treatments, including novel therapies (blinatumomab, inotuzumab ozogamicin, and chimeric antigen receptor T-cell therapy); and transplant outcomes were collected through the institution’s electronic medical records, chart reviews, and the blood and marrow transplant program database.
Genomic analysis
For subtype classification of Ph-negative ALL, we used RNA-sequencing (RNA-seq) and DNA-sequencing (DNA-seq) analysis, as described below. To confirm our findings, we used fluorescence in situ hybridization (FISH), reverse transcription polymerase chain reaction (RT-PCR), and single nucleotide polymorphism (SNP) array analysis on selected cases. These tests were developed and their performance characteristics were determined by the City of Hope National Medical Center, Molecular Pathology and Therapy Biomarker Division at Clinical Molecular Diagnostics and Cytogenetics Laboratories (CMDL). These laboratories are certified under the Clinical Laboratory Improvement Amendments of 1988 (CLIA 88) as qualified to perform high-complexity clinical laboratory testing.
RNA-seq.
We used a proprietary RNA-seq assay designed at CMDL and manufactured by ArcherDx/Invitea using Anchored Multiplex PCR technology to detect fusions and assess gene expression across 1188 gene specific primers from 235 genes to detect all the clinically significant fusions and elevated expressions, including CRLF2, for Ph-like ALLs. The detailed criteria for fusion and elevated expression validation and list of targeted genes are summarized in supplemental Tables 1A-B and 2A.
Bone marrow specimens, peripheral blood, and formalin-fixed paraffin-embedded samples with blast percentage of 5% to 100% were used for validation. Libraries were constructed from 40 to 250 ng of RNA using Archer Dx reagents for Ion Torrent with customized gene specific primers. We assessed the quality of RNA samples by real-time quantitative PCR during library preparation and quantified the constructed libraries with KAPA Biosystem Library quantitative PCR kit for Ion Torrent. After quantification, we pooled the barcoded libraries at equimolar concentrations, templated on Ion Chef instrument, and then sequenced on Ion Torrent S5 XL or S5 Prime instruments. Demultiplexed sequencing data were uploaded to Archer Analysis software version 6.0.4 using customized target region file for fusion and expression analysis. Comprehensive fusion and expression call criteria are detailed in the supplementary Material.
DNA-seq.
We used a 135 full exon next-generation sequencing proprietary assay to detect mutations in 56 available samples (supplemental Table 2B). We prepared next-generation sequencing libraries from genomic DNA (40 ng) using the SureSelect target enrichment system (Agilent Technologies, Inc.) after transposase-based fragmentation and adapter ligation and amplified the adapter-ligated library by PCR. Quality control was performed for sizing and concentration. After hybridization of 750 ng of adapter-ligated library with biotin-labeled probes that are specific to target regions, we added the dual-index tag during post-capture PCR amplification. The amplified captured libraries were quality controlled and then pooled and sequenced using Illumina 150 bp paired-end sequencing. We performed alignment of sequence reads to the human genome (GRCh37/hg19), variant calling, and annotation independently using 2 software pipelines: BWA-MEM-GATK and NextGENE (Softgenetics). Annotated variants were processed using previously published criteria.18 We filtered synonymous variants, variants located >2 bp outside protein-coding regions, and polymorphisms present in >1% in population databases, including ExAC, gnomAD, and variants with <30× coverage, and we evaluated the remaining variants using tumor-specific databases including COSMIC, cBioportal, information retrieved from literature, sequence conservation, and in silico prediction algorithms such as MutationTaster, SIFT, Polyphen-2, and FATHMM for clinical significance.
Cytogenetics and FISH and whole-genome oncology microarray SNP array
The City of Hope Cytogenetics Laboratory is certified under the CLIA 88 as qualified to perform high-complexity clinical laboratory testing. Testing includes G-banded chromosome analysis, FISH, and whole-genome oncology microarray (SNP array) for hematological malignancies (CytoScan HD). The laboratory is approved by the Children’s Oncology Group (COG) to perform testing for acute leukemia.
We performed Chromosomal Microarray Analysis (CMA) using the Affymetrix CytoScan HD platform (Thermo Fisher Scientific). This microarray consists of 2 696 550 oligonucleotide probes across the genome including 1 953 246 unique nonpolymorphic probes and 743 304 SNP probes. Patient hybridization parameters are compared with data derived from phenotypically normal individuals. We applied this microarray and associated software (chromosome analysis suite) to identify DNA copy number alterations and extended regions of copy neutral loss of heterozygosity, known in B-lymphoblastic leukemia.
Final results included pathogenic, likely pathogenic, large regions of copy neutral loss/absence of heterozygosity, and variants of uncertain significance. FISH panel for standard-risk ALL was performed on all cases, including BCR-ABL1-ASS1 with 1% background cutoff, IGH with 2% background cutoff, +4/+10 with 2% background cutoff, ETV6-RUNX1 with 2% background cutoff, and KMT2A with 3% background cutoff.
Final classification.
We classified Ph-like and non–Ph-like ALL according to the World Health Organization 2017 classification using accumulative results from RNA-seq, conventional cytogenetics, FISH, RT-PCR, and SNP array studies. For cases that we were unable to classify with fusion, cytogenetic and SNP array were classified as others. We classified patients as having high-risk cytogenetics if they had KMT2A (MLL) rearrangement, low hypodiploidy, complex cytogenetics defined as ≥5 unrelated abnormalities, or t(17;19).
A summary of these studies is provided in supplemental Table 3.
Definition of outcomes
Relapse-free survival (RFS) was the primary endpoint and was defined as time from transplant to the first observation of disease relapse or death from any cause, whichever came first. RFS was censored at the last follow-up if subjects remained alive and relapse-free. Secondary endpoints were OS, nonrelapse mortality (NRM), relapse, and acute and chronic graft-versus-host disease (GVHD). OS was defined as the time from transplant to death from any cause. Patients who were alive at their last follow-up were censored. Death from causes other than relapse was considered NRM. Cumulative incidence of relapse (CIR) was defined as the time of recurrent ALL after transplant, determined by morphological evidence in bone marrow or extramedullary sites. NRM and relapse were competing risk events to each other. Both NRM and relapse were censored at the last follow-up if subjects were alive and relapse-free. Acute and chronic GVHD were graded according to previously published criteria.2
Statistical analysis
Descriptive statistics were used for the baseline characteristics and Ph-like phenotype. The differences with Ph-like genotype in categorical variables were compared using χ-square tests or Fisher’s exact tests whenever appropriate. Continuous characteristics were compared using Kruskal-Wallis tests. Kaplan-Meier curves and log-rank tests were used for OS and RFS in the univariate analysis. Cumulative incidence curves and Gray’s test were used for NRM, CIR, acute GVHD, and chronic GHVD in the univariate analysis. Cox regression models and Fine and Gray regression models were used in the multivariable regression analyses. Covariates that were significantly associated with outcomes at 0.05 levels were chosen to adjust in the multivariable models. All tests were 2-sided at 0.05 significance level. SAS version 9.4/SAS/STAT 15.2 (SAS Institute, Inc.) was used to perform the analyses.
Results
Patient demographic and transplant characteristics
We identified 127 consecutive adult patients with Ph-negative B-ALL who underwent alloHCT at City of Hope (2006-2020). Median age of patients at the time of transplant was 39 years (range, 18-72). Most were male (n = 77; 61%) and Hispanic (n = 90; 71%). The median initial white blood cell count (WBC) was 19.2 k/uL (range, 0.3-560) at the time of ALL diagnosis, and 23% of all patients had high-risk cytogenetics.19 Initial administered induction therapy was hyper-CVAD (37%), pediatric-inspired (33%), Children’s Oncology Group/Children’s Cancer Group (COG/CCG) (13%), or other regimens (17%). Median time from ALL diagnosis to transplant was 6.8 months (range, 2.7-239.6). Patients were transplanted either in CR1 (61%) or CR2/3 (39%). Blinatumomab, inotuzumab ozogamicin, and chimeric antigen receptor T cells were administered prior to transplant (any time during the course of ALL) in 47%, 15%, and 5% of patients, respectively. Pretransplant MRD assessment by multicolor flow cytometry at the reference laboratory (University of Washington) was available for 89 (70%) patients, among whom 78 (85%) were MRD-negative (defined as < 0.01% blast) and 13 (15%) were MRD-positive. Transplant conditioning regimen was myeloablative in 69% (n = 87), and all were total body irradiation–based. Three patients received nonmyeloablative conditioning regimen with fludarabine, cyclophosphamide, and a single dose of radiation. Fludarabine/melphalan-based conditioning regimen was used in all patients who received reduced intensity conditioning (RIC) except for 1, who received clofarabine and melphalan. Stem cell graft was mobilized peripheral blood stem cells in most patients (95%; n = 121). Donors were matched sibling (32%), matched unrelated (29%), mismatched unrelated (13%), haploidentical (23%), or cord blood (2%). Patient and transplant characteristics are detailed in Table 1.
Patient and transplant characteristics
| Ph-like fusions (N = 56) | Others (N = 71) | Total (N = 127) | P | |
|---|---|---|---|---|
| Age at HSCT, y | .12 | |||
| Median (range) | 35 (19-70) | 40 (18-72) | 39 (18-72) | |
| Recipient sex (%) | .70 | |||
| Male | 35 (62.5) | 42 (59.2) | 77 (60.6) | |
| Female | 21 (37.5) | 29 (40.8) | 50 (39.4) | |
| Race (%) | .008 | |||
| White | 6 (10.7) | 24 (33.8) | 30 (23.6) | |
| Hispanic | 46 (82.1) | 44 (62) | 90 (70.9) | |
| Asian | 3 (5.4) | 2 (2.8) | 5 (3.9) | |
| African American | 1 (1.8) | 1 (1.4) | 2 (1.6) | |
| Cytogenetics (%) | <.001 | |||
| Good/intermediate | 53 (94.6) | 45 (63.4) | 98 (77.2) | |
| High | 3 (5.4) | 26 (36.6) | 29 (22.8) | |
| KMT2A (MLL) translocation | 0 | 9 (35) | 9 (31) | |
| Hypodiploidy | 0 | 8 (30.5) | 8 (28) | |
| Complex (≥5 abnormalities) | 3 (100) | 8 (30.5) | 11 (38) | |
| T(17;19) | 0 | 1 (4) | 1 (3) | |
| WBC at diagnosis | .45 | |||
| Median (range) | 21.8 (0.6-512.0) | 13.4 (0.3-560.0) | 19.2 (0.3-560.0) | |
| Time from diagnosis to HCT, mo | .22 | |||
| Median (range) | 8.6 (2.7-50.2) | 6.1 (2.9-239.6) | 6.8 (2.7-239.6) | |
| Disease status at HCT (%) | .89 | |||
| CR1 | 34 (60.7) | 44 (62) | 78 (61.4) | |
| CR2/3 | 22 (39.3) | 27 (38) | 49 (38.6) | |
| MRD status at HCT (%) | .12 | |||
| Negative | 35 (79.5) | 41 (91.1) | 76 (59.8) | |
| Positive | 9 (20.5) | 4 (8.9) | 13 (10.2) | |
| Unknown | 12 | 26 | 38 (29.9) | |
| Prior blinatumomab (%) | .019 | |||
| No | 23 (41.1) | 44 (62) | 67 (52.8) | |
| Yes | 33 (58.9) | 27 (38) | 60 (47.2) | |
| Prior inotuzumab (%) | .42 | |||
| No | 46 (82.1) | 62 (87.3) | 108 (85) | |
| Yes | 10 (17.9) | 9 (12.7) | 19 (15) | |
| Donor (%) | .86 | |||
| Match sibling | 16 (28.6) | 25 (35.2) | 41 (32.3) | |
| Match unrelated | 16 (28.6) | 21 (29.6) | 37 (29.1) | |
| Mismatched unrelated | 9 (16.1) | 8 (11.3) | 17 (13.4) | |
| Haplo-identical | 14 (25) | 15 (21.1) | 29 (22.8) | |
| Cord blood | 1 (1.8) | 2 (2.8) | 3 (2.4) | |
| Conditioning regimen (%) | .89 | |||
| Myeloablative | 38 (67.9) | 49 (69) | 87 (68.5) | |
| Reduce intensity/nonmyeloablative | 18 (32.1) | 22 (31) | 40 (31.5) | |
| Stem cell l source (%) | .44 | |||
| Peripheral blood stem cells | 55 (98.2) | 66 (93) | 121 (95.3) | |
| Bone marrow | 0 (0) | 3 (4.2) | 3 (2.4) | |
| Cord blood | 1 (1.8) | 2 (2.8) | 3 (2.4) | |
| GVHD prophylaxis (%) | .64 | |||
| Tacrolimus/sirolimus-based | 31 (55.4) | 43 (60.6) | 74 (58.3) | |
| PTCy/tacrolimus/MMF-based | 20 (35.7) | 20 (28.2) | 40 (31.5) | |
| Others | 5 (8.9) | 8 (11.3) | 13 (10.2) | |
| Induction regimen (%) | .15 | |||
| Hyper-CVAD | 15 (26.8) | 32 (45.1) | 47 (37) | |
| Pediatric inspired | 23 (41.1) | 19 (26.8) | 42 (33.1) | |
| COG/CCG | 9 (16.1) | 8 (11.3) | 17 (13.4) | |
| Others | 9 (16.1) | 12 (16.9) | 21 (16.5) | |
| Number of therapies for CR1 (%) | .009 | |||
| 1 | 14 (41.2) | 31 (70.5) | 45 (57.7) | |
| ≥2 | 20 (58.8) | 13 (29.5) | 33 (42.3) | |
| Karnofsky performance status (%) | .53 | |||
| 90-100 | 34 (60.7) | 37 (52.1) | 71 (55.9) | |
| 70-80 | 17 (30.4) | 26 (36.6) | 43 (33.9) | |
| 40-60 | 2 (3.6) | 1 (1.4) | 3 (2.4) | |
| Unknown | 3 (5.4) | 7 (9.9) | 10 (7.9) | |
| HCT comorbidity index (%) | .095 | |||
| 0 | 8 (14.3) | 16 (22.5) | 24 (18.9) | |
| 1-2 | 27 (48.2) | 19 (26.8) | 46 (36.2) | |
| ≥3 | 18 (32.1) | 30 (42.3) | 48 (37.8) | |
| Unknown | 3 (5.4) | 6 (8.5) | 9 (7.1) | |
| HCT year (%) | .15 | |||
| 2006-2014 | 11 (19.6) | 22 (31) | 33 (26) | |
| 2015-2020 | 45 (80.4) | 49 (69) | 94 (74) |
Ph-like genetic classification
Among the 127 cases of Ph-negative B-ALL, fusions associated with Ph-like ALL were identified in 56 (44.1%) patients, of whom 38 (67.9%) were carrying CRLF2r and 18 (32.1%) were non-CRLF2r. Among Ph-like CRLF2r cases, IGH-CRLF2 and P2Y8R-CRLF2 rearrangements were detected in 31 and 7 patients, respectively. Among the 18 patients with non-CRLF2r Ph-like ALL, ABL class fusions (n = 7; 5 had ABL1 and 2 had ABL2), JAK2 fusion (n = 5), and EPOR fusion (n = 6) were detected (Figure 2).
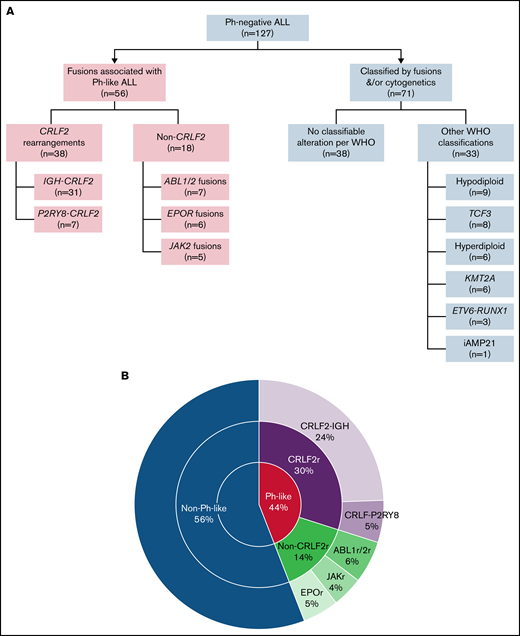
Genomic classification. (A) Flow diagram of the final comprehensive genomic classification. (B) Pie chart showing the frequency of genomic alterations in adults with Ph-like ALL.
Genomic classification. (A) Flow diagram of the final comprehensive genomic classification. (B) Pie chart showing the frequency of genomic alterations in adults with Ph-like ALL.
Comparing patient and disease characteristics between Ph-like and non–Ph-like ALL
Table 1 compares patients and transplant characteristics based on Ph-like ALL fusion status. Briefly, patients with fusions associated with Ph-like ALL (n = 56) were more frequently Hispanic (82% vs 62%; P = .008), less likely harbored high-risk cytogenetics (5% vs 37%; P < .001), more frequently received pretransplant blinatumomab (59% vs 38%; P = .019), and more likely required >1 regimen to achieve CR1 (59% vs 30%; P = .009) compared with other patients with Ph-negative B-cell ALL.
We did not detect any significant difference between patients with and without Ph-like ALL fusions in regard to age (P = .12), disease status (CR1 vs CR2/3; P = .89), or MRD clearance at the time of transplant (negative vs positive; P = .12), median WBC at diagnosis (P = .45), donor type (match related/unrelated vs mismatch vs haplo vs cord blood; P = .86), conditioning regimen intensity (myeloablative vs nonmyeloablative/reduced intensity; P = .89), GVHD prophylaxis (tacrolimus/sirolimus-based vs PTCy-based; P = .64), Karnofsky Performance Status (KPS; P = .53), or HCT comorbidity index (0 vs 1-2 vs >2; P = .10).
Survival outcomes
With the median follow-up of 3.5 years (range, 1-15.0), 3-year posttransplant RFS and OS were 43% (95% CI, 33%-52%) and 50% (95% CI, 40%-59%), respectively, for the whole cohort (Figure 3A). Patients with fusions associated with Ph-like ALL had comparable posttransplant RFS (Hazard ratio [HR] = 1.24; 95% CI, 0.78-1.98; P = .36) and OS (HR = 1.14; 95% CI, 0.69-1.88; P = .59) to other B-cell ALL (Figure 3B-C). By multivariable analysis, transplant in CR2/CR3 (HR = 2.21; 95% CI, 1.38-3.53; P < .001) and using RIC/nonmyeloablative conditioning regimens (HR = 1.84; 95% CI, 1.13-2.98; P = .014) were associated with lower 3-year RFS. Ph-like fusions status (P = .32), age (P = .12), recipient gender (P = .26), cytogenetic risk (P = .49), MRD status at the time of HCT (P = .95), donor type (P = .11), and KPS (P = .32) did not influence the RFS.

Kaplan-Meier curves for survival outcomes at 3 years after HCT. (A) OS and RFS for all patients. (B) Comparison of RFS in patients with and without Ph-like ALL. (C) Comparison of OS in patients with and without Ph-like ALL.
Kaplan-Meier curves for survival outcomes at 3 years after HCT. (A) OS and RFS for all patients. (B) Comparison of RFS in patients with and without Ph-like ALL. (C) Comparison of OS in patients with and without Ph-like ALL.
Age ≥40 at transplant (HR = 1.83; 95% CI, 1.08-3.08; P = .023) and transplant in CR2/CR3 (HR = 2.54; 95% CI, 1.53-4.20; P < .001) were independently associated with inferior OS, while transplant from match-unrelated donor (HR = 0.46; 95% CI, 0.22-0.95; P = .015) was associated with a better OS. There was a trend toward inferior OS in patients with lower KPS (≤70%) (HR = 1.99; 95% CI, 1.00-3.99; P = .051). OS was not significantly impacted by Ph-like status (P = .72), recipient gender (P = .50), cytogenetics risk (P = .56), MRD status (P = .74), or conditioning regimen intensity (P = .31). Table 2 illustrate univariable and multivariable analyzes for OS and RFS.
Univariable and multivariable analysis for OS and RFS
| N | OS | RFS | |||||||||
|---|---|---|---|---|---|---|---|---|---|---|---|
| 3-y (95% CI) | HR (95% CI)* | P* | Adj HR (95% CI)† | Adj P† | 3-y (95% CI) | HR (95% CI)* | P* | Adj HR (95% CI)† | Adj P† | ||
| Age, y | |||||||||||
| <40 | 65 | 0.61 (0.47, 0.72) | Reference | .044 | Reference | .023 | 0.49 (0.36, 0.61) | Reference | .085 | Reference | .12 |
| ≥40 | 62 | 0.38 (0.25, 0.51) | 1.66 (1.00, 2.74) | 1.83 (1.08, 3.08) | 0.35 (0.23, 0.48) | 1.50 (0.94, 2.39) | 1.50 (0.90, 2.50) | ||||
| Sex | |||||||||||
| M | 77 | 0.52 (0.40, 0.63) | Reference | .78 | Reference | .50 | 0.45 (0.33, 0.56) | Reference | .69 | Reference | .26 |
| F | 50 | 0.47 (0.31, 0.61) | 1.07 (0.65, 1.78) | 1.19 (0.71, 2.01) | 0.40 (0.25, 0.54) | 1.10 (0.68, 1.76) | 1.32 (0.81, 2.13) | ||||
| Cytogenetics | |||||||||||
| Good/intermediate | 98 | 0.52 (0.41, 0.62) | Reference | .77 | Reference | .56 | 0.46 (0.35, 0.56) | Reference | .73 | Reference | .49 |
| High | 29 | 0.43 (0.23, 0.62) | 1.09 (0.62, 1.92) | 1.19 (0.66, 2.15) | 0.31 (0.13, 0.50) | 1.10 (0.64, 1.88) | 1.21 (0.70, 2.10) | ||||
| Disease status at HCT | |||||||||||
| CR1 | 78 | 0.59 (0.46, 0.70) | Reference | <.001 | Reference | <.001 | 0.51 (0.38, 0.62) | Reference | .001 | Reference | <.001 |
| CR2/3 | 49 | 0.35 (0.22, 0.49) | 2.26 (1.38, 3.71) | 2.54 (1.53, 4.20) | 0.30 (0.17, 0.43) | 2.08 (1.30, 3.31) | 2.21 (1.38, 3.53) | ||||
| MRD | |||||||||||
| Negative | 76 | 0.52 (0.39, 0.64) | Reference | .74 | Reference | .74 | 0.41 (0.28, 0.53) | Reference | .75 | Reference | .95 |
| Positive | 13 | 0.54 (0.25, 0.76) | 0.86 (0.36, 2.08) | 0.86 (0.34, 2.12) | 0.46 (0.19, 0.70) | 0.88 (0.39, 1.97) | 0.97 (0.41, 2.29) | ||||
| Donor type | |||||||||||
| MSD | 41 | 0.48 (0.32, 0.63) | Reference | .018 | Reference | .015 | 0.41 (0.25, 0.56) | Reference | .065 | Reference | .11 |
| MUD | 37 | 0.68 (0.49, 0.81) | 0.53 (0.26, 1.07) | 0.46 (0.22, 0.95) | 0.61 (0.43, 0.75) | 0.65 (0.34, 1.22) | 0.64 (0.34, 1.21) | ||||
| mMUD | 17 | 0.29 (0.09, 0.53) | 1.70 (0.84, 3.45) | 1.74 (0.84, 3.61) | 0.32 (0.11, 0.55) | 1.54 (0.77, 3.08) | 1.58 (0.78, 3.22) | ||||
| Haplo/cord | 32 | 0.41 (0.21, 0.60) | 1.31 (0.69, 2.48) | 1.22 (0.63, 2.36) | 0.27 (0.11, 0.46) | 1.36 (0.75, 2.47) | 1.20 (0.65, 2.19) | ||||
| Conditioning | |||||||||||
| MAC | 87 | 0.51 (0.39, 0.62) | Reference | .092 | Reference | .31 | 0.45 (0.33, 0.56) | Reference | .028 | Reference | .014 |
| RIC/NMA | 40 | 0.48 (0.32, 0.63) | 1.54 (0.92, 2.59) | 1.35 (0.75, 2.42) | 0.39 (0.24, 0.54) | 1.69 (1.05, 2.73) | 1.84 (1.13, 2.98) | ||||
| KPS | |||||||||||
| 80-100 | 102 | 0.56 (0.44, 0.65) | Reference | .023 | Reference | .051 | 0.46 (0.35, 0.56) | Reference | .14 | Reference | .24 |
| ≤70 | 15 | 0.32 (0.11, 0.56) | 2.16 (1.08, 4.30) | 1.99 (1.00, 3.99) | 0.32 (0.11, 0.56) | 1.65 (0.84, 3.25) | 1.51 (0.76, 2.99) | ||||
| Ph-like | |||||||||||
| Other B-cells | 71 | 0.50 (0.37, 0.61) | Reference | .59 | Reference | .72 | 0.44 (0.32, 0.56) | Reference | .36 | Reference | .32 |
| Ph-like fusions | 56 | 0.51 (0.36, 0.64) | 1.14 (0.69, 1.88) | 1.10 (0.66, 1.82) | 0.41 (0.27, 0.54) | 1.24 (0.78, 1.98) | 1.27 (0.80, 2.02) | ||||
Adj, adjusted; MAC, myeloablative conditioning; NMA, nonmyeloablative.
Univariate analysis and log-rank test.
Based on the multivariable Cox regression model adjusted for age, disease status, and KPS for OS. Disease status and conditioning regimen were adjusted for RFS.
Relapse, nonrelapse mortality, and GVHD outcomes
The 3-year CIR and NRM were 33% (95% CI, 25%-42%) and 24% (95% CI, 17%-32%), respectively; for the whole cohort (Figure 4A). By multivariable analysis, transplant in CR2/3 (HR = 1.97; 95% CI, 1.07-3.61; P = .028) and receiving RIC/nonmyeloablative regimens (HR = 2.09; 95% CI, 1.08-4.02; P = .028) were associated with increased CIR, whereas carrying Ph-like fusions had no impact on the risk of relapse (HR = 1.43; 95% CI, 0.79-2.61; P = .24) (Figure 4B) or NRM (HR = 1.01; 95% CI, 0.48-2.11; P = .99) (Figure 4C). Low KPS (≤70%) (HR= 5.28; 95% CI, 2.29-12.13; P < .001) and transplant from mismatch-unrelated donor (HR = 3.60; 95% CI, 1.20-10.83; P = .019) predicted higher NRM after transplant. Lower KPS was associated with lower CIR (P = .035), but this is likely the result of competing risk with increased NRM in these patients (P < .001). Table 3 shows univariable and multivariable analyses for CIR and NRM.

Kaplan-Meier curves. (A) Relapse and NRM for all patients. (B) Comparison of relapse in patients with and without Ph-like ALL. (C) Comparison of NRM in patients with and without Ph-like ALL.
Kaplan-Meier curves. (A) Relapse and NRM for all patients. (B) Comparison of relapse in patients with and without Ph-like ALL. (C) Comparison of NRM in patients with and without Ph-like ALL.
Univariable and multivariable analysis for relapse and non-relapse mortality
| N | Relapse | NRM | |||||||||
|---|---|---|---|---|---|---|---|---|---|---|---|
| 3-y (95% CI) | HR (95% CI)* | P* | Adj HR (95% CI)† | Adj P† | 3-y (95% CI) | HR (95% CI)* | P* | Adj HR (95% CI)† | Adj P† | ||
| Age, y | |||||||||||
| <40 | 65 | 0.31 (0.20, 0.43) | Reference | .22 | Reference | .53 | 0.20 (0.11, 0.31) | Reference | .41 | Reference | .55 |
| ≥40 | 62 | 0.36 (0.24, 0.49) | 1.45 (0.80, 2.62) | 1.24 (0.64, 2.40) | 0.29 (0.17, 0.41) | 1.34 (0.65, 2.76) | 1.26 (0.59, 2.68) | ||||
| Sex | |||||||||||
| M | 77 | 0.29 (0.19, 0.40) | Reference | .20 | Reference | .14 | 0.26 (0.17, 0.37) | Reference | .26 | Reference | .41 |
| F | 50 | 0.40 (0.26, 0.54) | 1.49 (0.82, 2.70) | 1.60 (0.86, 2.95) | 0.20 (0.09, 0.33) | 0.66 (0.30, 1.45) | 0.70 (0.30, 1.63) | ||||
| Cytogenetics | |||||||||||
| Good/intermediate | 98 | 0.33 (0.24, 0.43) | Reference | .89 | Reference | .89 | 0.21 (0.13, 0.29) | Reference | .56 | Reference | .55 |
| High | 29 | 0.32 (0.16, 0.50) | 1.06 (0.52, 2.17) | 1.05 (0.51, 2.16) | 0.37 (0.17, 0.57) | 1.25 (0.58, 2.70) | 1.28 (0.57, 2.87) | ||||
| Disease status at HCT | |||||||||||
| CR1 | 78 | 0.28 (0.18, 0.39) | Reference | .14 | Reference | .028 | 0.21 (0.12, 0.32) | Reference | .17 | Reference | .21 |
| CR2/3 | 49 | 0.42 (0.27, 0.55) | 1.60 (0.87, 2.92) | 1.97 (1.07, 3.61) | 0.29 (0.17, 0.42) | 1.67 (0.81, 3.46) | 1.60 (0.77, 3.33) | ||||
| MRD | |||||||||||
| Negative | 76 | 0.32 (0.203, 0.44) | Reference | .92 | Reference | .92 | 0.28 (0.17, 0.39) | Reference | .73 | Reference | .80 |
| Positive | 13 | 0.31 (0.09, 0.57) | 0.98 (0.32,2.98) | 1.07 (0.31,3.64) | 0.23 (0.05, 0.49) | 0.84 (0.25, 2.78) | 0.84 (0.23, 3.14) | ||||
| Donor type | |||||||||||
| MSD | 41 | 0.38 (0.23, 0.53) | Reference | .81 | Reference | .96 | 0.21 (0.10, 0.36) | Reference | .076 | Reference | .019 |
| MUD | 37 | 0.25 (0.12, 0.40) | 0.71 (0.33,1.50) | 0.86 (0.39,1.89) | 0.14 (0.05, 0.28) | 0.67 (0.22, 2.04) | 0.75 (0.22, 2.56) | ||||
| mMUD | 17 | 0.29 (0.10, 0.52) | 0.80 (0.28,2.32) | 0.83 (0.29,2.37) | 0.38 (0.14, 0.63) | 2.44 (0.93, 6.42) | 3.60 (1.20, 10.83) | ||||
| Haplo/cord | 32 | 0.42 (0.21, 0.61) | 0.94 (0.44,1.97) | 1.03 (0.46,2.30) | 0.31 (0.14, 0.49) | 1.72 (0.67, 4.44) | 1.97 (0.68, 5.71) | ||||
| Conditioning | |||||||||||
| MAC | 87 | 0.32 (0.22, 0.43) | Reference | .14 | Reference | .028 | 0.23 (0.14, 0.33) | Reference | .46 | Reference | .80 |
| RIC/NMA | 40 | 0.36 (0.21, 0.51) | 1.57 (0.86,2.86) | 2.09 (1.08,4.02) | 0.25 (0.13, 0.39) | 1.28 (0.59, 2.77) | 1.11 (0.50, 2.48) | ||||
| KPS | |||||||||||
| 80-100 | 102 | 0.35 (0.23, 0.45) | Reference | .027 | Reference | .035 | 0.18 (0.11, 0.27) | Reference | <.001 | Reference | <.001 |
| ≤70 | 15 | 0.07 (0.00, 0.27) | 0.15 (0.02,1.16) | 0.10 (0.01,0.85) | 0.61 (0.30, 0.82) | 5.28 (2.29, 12.13) | 5.28 (2.29, 12.13) | ||||
| Ph-like | |||||||||||
| Other B-cell | 71 | 0.31 (0.20, 0.42) | Reference | .47 | Reference | .24 | 0.25 (0.15, 0.36) | Reference | .76 | Reference | .99 |
| Ph-like fusions | 56 | 0.37 (0.24, 0.51) | 1.23 (0.68, 2.23) | 1.43 (0.79,2.61) | 0.22 (0.12, 0.34) | 1.10 (0.53, 2.28) | 1.01 (0.48, 2.11) | ||||
Adj, adjusted; MAC, myeloablative conditioning.
Univariate analysis and Gray’s test.
Based on the multivariable Fine and Gray regression model adjusted for disease status, conditioning, and KPS for relapse. Donor type and KPS were adjusted for NRM.
When analysis was restricted to patients transplanted in CR1 (n = 78), patients with fusions associated with Ph-like ALL had comparable RFS (HR = 1.17; 95% CI, 0.62-2.23; P = .63), OS (HR = 1.02; 95% CI, 0.49-2.10; P = .96), relapse (HR = 1.00; 95% CI, 0.45-2.25; P = .96), and NRM (HR = 1.29; 95% CI, 0.48-3.47; P = .59) compared with other patients with Ph-negative B-ALL (supplemental Figure 1A-D). When we restricted our analysis to patients with Ph-like fusions, only (n = 56) patients with CRLF2r had comparable RFS (HR = 1.27; 95% CI, 0.60-2.70; P = .53), OS (HR = 1.27; 95% CI, 0.55-2.95; P = .57), relapse (HR = 2.05; 95% CI, 0.80-5.26; P = .12), and NRM (HR = 0.54; 95% CI, 0.19-1.56; P = .37) compared with non-CRLF2r patients. Relapse rate at 3 years after HCT was 44% in CRLF2r patients and 23% in non-CRLF2r patients; however, the difference in relapse rate was not statistically significant (P = .12) (supplemental Figure 2A-D). No difference was observed in OS (P = .78) or RFS (P = .46) when other B-cell ALL cases were separated into standard- and high-risk cytogenetics and compared with Ph-like ALL cases (supplemental Figure 3A-B).
Grade II-IV and III-IV acute GVHD was diagnosed in 47% and 16%, respectively. One-year any-grade and extensive chronic GVHD were observed in 48% and 42%, respectively (supplemental Figure 4A-B).
Discussion
Here, we showed that alloHCT is associated with a 3-year survival rate just over 50% in adult patients with ALL carrying Ph-like fusions, including patients with CRLF2r who historically have fared very poorly with nontransplant approaches.3 Our results are encouraging and compared favorably to chemotherapy,2,3 especially because 39% of patients with Ph-like fusions in our study underwent HCT beyond CR1 and 59% of patients who were transplanted in CR1 required more than 1 line of therapy to attain CR or convert disease to MRD before transplant.
To our knowledge, our study is one of the largest transplant studies for adult patients with Ph-like ALL. In another large transplant experience of Ph-like ALL, Cho et al reported similar outcomes in a South Korean patient population.16 In contrast to the Korean cohort, our study included mainly Hispanic and White patients and only a small subset of Asian patients. Furthermore, we included MRD data, which was available for most patients, and included only patients who were transplanted in CR and were classified as having Ph-like ALL based on the presence of diagnostic fusions.
To classify Ph-like vs other BCR-ABL1–negative ALLs, we designed and validated a 235-gene RNA-seq assay at our CLIA laboratory. Our assay can detect Ph-like–associated gene fusions with any possible partner, with the limitation of IGH translocation detection. Therefore, we used cumulative results from RNA-seq, conventional cytogenetics, FISH, and whole genome array studies for final classification of our 106 cases. Twenty-one cases had reported results from outside cytogenetics and FISH CLIA laboratories.
Despite the encouraging transplant survival data, disease relapse remained the leading cause of transplant failure in patients with Ph-like ALL, especially in patients with CRLF2r (44% at 3 years). Further reduction of ALL relapse after transplant in patients with Ph-like ALL is a key area of investigation that requires additional interventional studies, which could be pursued either by pretransplant administration of novel therapies or designing posttransplant maintenance strategies. Immunotherapies (ie, blinatumomab) have demonstrated encouraging activity in Ph-like ALL, including for patients with CRLF2r.20 Therefore, blinatumomab can be more widely offered as a pretransplant therapy to enhance the quality of remission or given preemptively after transplant to augment ALL-specific graft-versus-leukemia effect in an effort to reduce the risk of relapse (NCT02807883, NCT03114865).21,22 Moreover, most patients with Ph-like ALL carry genetic alterations that activate kinases or cytokine receptors signaling pathways, which makes the disease amenable to be targeted by TKIs, as has been documented in preclinical studies.1,2 Thus, posttransplant TKI maintenance could be considered another strategy aiming to reduce early relapse and allowing more time for the graft-versus-leukemia effect to mediate the residual ALL clone eradication over time.23
Ph-like subtype is not an uncommon entity in adults with B-ALL, especially in our study population. A large multicenter study previously illustrated that Ph-like ALL represents close to 20% of cases in all adults with B-ALL in the United States.2 In contrast, the prevalence of Ph-like ALL appears lower in adults of European race.4 Surprisingly, cases with Ph-like fusions accounted for 44% of our adult patients with Ph-negative B-ALL who were assigned for alloHCT consolidation. This high incidence of Ph-like ALL in our patients is likely linked to the racial/ethnic demographics of Southern California in which our population is enriched with Hispanic patients, in whom incidences of ALL in general and Ph-like ALL in particular are more common.3,24 Additionally, higher prevalence of Ph-like ALL in our cohort could also result from selection of high-risk patients with ALL who are eligible to undergo alloHCT either due to relapsed disease or kinetics of delayed response. Furthermore, our analysis was restricted to only Ph-negative B-cell ALL, and this percentage does not account for Ph-positive ALL as part of the dominator.
Unexpectedly, MRD status at the time of transplant was not prognostic for posttransplant outcomes, which may be explained by the small number of patients with persistent MRD at the time of transplant in our analysis and use of myeloablative conditioning-based transplant among most of these cases. Indeed, 92% of patients with persistent MRD at the time of transplant received a myeloablative conditioning-based regimen compared with only 59% of patients with MRD-negative status at the time of transplant.
We acknowledge that our study is limited by its retrospective nature and the selection bias for high-risk patients that was recommended to undergo alloHCT. Furthermore, initial chemotherapy and transplant characteristics, including donor type and conditioning intensity, were heterogenous among our cohort and thus added to the study limitations. Notably, our study only compares survival outcomes for patients with Ph-like ALL who underwent alloHCT and does not address another important question of whether transplant is superior to nontransplant approaches in adults with Ph-like ALL, especially with the recent introduction of modern pediatric-inspired regimens and ongoing studies incorporating novel agents (inotuzumab ozogamicin and blinatumomab) in early treatment phases in adults with ALL (NCT03150693; NCT02003222). While failing to achieve MRD response with chemotherapy is a clear indication to proceed with transplant in patients with ALL,25 the role of alloHCT consolidation in adults with Ph-like who achieve early MRD response remains unknown, and a randomized study testing the role of transplant consolidation in this setting is clearly needed.
In conclusion, our data indicate that alloHCT for ALL with Ph-like fusions is associated with 3-year survival rate exceeding 50% in adult patients; relapse was the main cause of treatment failure. Survival outcomes did not differ between ALL with and without Ph-like fusions in our cohort. Therefore, alloHCT should be considered for patients with Ph-like ALL in CR, and further efforts to reduce relapse, such as additional pre-HCT therapy and post-HCT maintenance therapy, are warranted.
Acknowledgments
This study was funded by the City of Hope Heme Pilot Program and the National Cancer Institute, National Institutes of Health (P30 CA033572) (Biostatistics and Hematopoietic Tissue Bank Cores).
Authorship
Contribution: I.A., R.N., and M.A. contributed to the study design and data interpretation; D.Y. was the study biostatistician and performed statistical analyses; M.M.A., Z.G., V.T., R.J., and M.T. performed samples analyzes and genetic subgroups classifications; S.M. drafted the report; and all authors contributed to critical revision of the manuscript for intellectual content.
Conflict-of-interest disclosure: I.A. serves on advisory boards for Amgen, Kite, AbbVie, and Agios, is a consultant for Autolus Therapeutics and Amgen, and has received research support from MacroGenics and AbbVie. A.S. has served as a consultant for Kadmon Corporation and has received research funding from Celgene. R.N. serves on advisory boards for Merck and Celgene and has a research collaboration with Jazz Pharmaceuticals. A.S.S. is a member of the speakers’ bureau for Amgen, Celgene, and Stemline Therapeutics. G.M. is a member of the speakers’ bureau for AbbVie. V.P. has served on advisory boards for AbbVie and Jazz Pharmaceuticals and is member of the speakers’ bureau for Jazz Pharmaceuticals, Amgen, Novartis, and AbbVie. The remaining authors declare no competing financial interests.
Correspondence: Ibrahim Aldoss, Department of Hematology and Hematopoietic Cell Transplantation, Gehr Family Center for Leukemia Research, City of Hope National Medical Center, Duarte, CA 91010; e-mail: ialdoss@coh.org.

