

Key Points
Unlike knee arthroscopy, lower-leg injury is associated with increased plasma levels of factor VIII, von Willebrand factor, and D-dimer.
In both situations, coagulation is affected differently, which suggests that there are different pathways toward venous thromboembolism.

Abstract
It is unknown how lower-leg injury and knee arthroscopy, both associated with venous thromboembolism (VTE), affect coagulation. To study the effect of (1) lower-leg trauma and (2) knee arthroscopy on coagulation, plasma samples of the Prevention of Thrombosis following CAST immobilization (POT-CAST, #NCT01542762) and Prevention of Thrombosis following Knee Arthroscopy (POT-KAST, #NCT01542723) trials were used, which were collected shortly after lower-leg trauma and before/after (<4 hours) knee arthroscopy. For aim 1, 1204 lower-leg injury patients were compared with preoperative samples of 1001 controls. Mean differences/ratios (if ln-retransformed because of skewedness) were adjusted for sex, age, body mass index, comorbidity, malignancy, and oral contraceptives using linear regression. For aim 2, perioperative mean changes of 715 arthroscopy patients were calculated. Plasma levels of fibrinogen, factor (F)VIII, FIX, FXI, von Willebrand Factor (VWF), and D-dimer were measured in all individuals. Parameters of underlying mechanisms (tissue factor, interleukin-6 [IL-6], myeloperoxidase DNA, cell-free DNA) were measured in random subsets. In lower-leg injury patients, coagulation parameter levels increased, especially FVIII, VWF, and D-dimer, that is, adjusted mean differences: FVIII 26.8% (95% confidence interval [CI], 23.7-29.9), FIX 13.8% (95% CI, 11.9-15.6), FXI 5.1% (95% CI, 3.3-7.0), VWF 29.8% (95% CI, 26.0-33.6), fibrinogen 32.5 mg/dL (95% CI, 25.8-39.2), and D-dimer (mean ratio) 3.3 (95% CI, 3.1-3.6). Remaining parameters were unchanged, except for increased IL-6 levels. After arthroscopy, all parameters decreased. Lower-leg trauma is associated with increased procoagulant factor levels in contrast to knee arthroscopy. This suggests that, in both situations, different pathways are involved in development of VTE.
Introduction
Lower-leg injury and knee arthroscopic surgery are conditions known to be associated with venous thromboembolism (VTE), mostly located in the deep veins of the leg (ie, deep vein thrombosis) or in pulmonary arteries (ie, pulmonary embolism). According to a recent meta-analysis, the risk of symptomatic VTE is 2% in patients with lower-leg injury and 0.6% in patients who underwent knee arthroscopy in the following 3 months.1 Adequate thromboprophylaxis is important given the considerable mortality and chronic morbidity associated with VTE.2-4 However, the Prevention of Thrombosis following CAST immobilization (POT-CAST) and Prevention of Thrombosis following Knee Arthroscopy (POT-KAST) trials showed that the current thromboprophylaxis strategy, that is, low-molecular-weight heparin (LMWH), is not optimal.5
To improve prevention of VTE in patients undergoing lower-leg cast application or knee arthroscopy, specific knowledge regarding the mechanism of VTE in both patient groups is necessary.1 Considering Virchow’s triad, it can be assumed that vessel wall damage, because of injury, and venous stasis, because of reduced mobility, play a role in (pathologic) thrombus formation after lower-leg cast immobilization.6 This differs from knee arthroscopy, which is characterized as a minimally invasive procedure and is therefore associated with slight tissue damage and limited postoperative immobilization. Furthermore, these patients are mostly operated with use of thigh-tourniquet application (to obtain a dry surgical field), in which the induced hypoxia could play a role in pathologic thrombus formation.7 It is unknown whether lower-leg trauma and/or knee arthroscopy induce abnormalities in blood composition, such as increased levels of procoagulant factors, which constitutes the third element of Virchow’s triad.
For this study, we aimed to explore the impact of (1) lower-leg injury and (2) knee arthroscopy on the coagulation system. For this purpose, several hemostatic components and markers for underlying mechanisms (inflammation, cell damage, and neutrophil extracellular traps formation) were assessed.
Methods
Study population
We used data from the POT-CAST and POT-KAST trials, which are described elsewhere in detail.5 In short, the aim of these multicenter randomized controlled trials was to assess the effectiveness of LMWH on the occurrence of symptomatic VTE in the first 3 months after lower-leg cast application (POT-CAST) and knee arthroscopic surgery (POT-KAST). Between March 2012 and January 2016, individuals who were admitted to the emergency department with a lower-leg injury and individuals scheduled for elective knee arthroscopy were included in the trials. Participants were randomized to receive either prophylactic LMWH or no thromboprophylaxis (control group). LMWH was administered during the complete period of cast immobilization and for 8 days after knee arthroscopy. The occurrence of symptomatic VTE was assessed by a blinded independent outcome adjudication committee. Individuals aged 18 years or older were eligible for inclusion. Specific indications for knee arthroscopy included, but were not limited to, meniscectomy, diagnostic arthroscopy, and removal of loose bodies. Individuals complying to 1 of the following criteria were excluded: history of VTE, current use of anticoagulant therapy (except antiplatelet medication), contra-indications for use of LMWH, pregnancy, mental or physical disability to fulfill study requirements, or insufficient knowledge of the Dutch language. In both trials, participants completed a questionnaire (digital [online] or postal) on putative thrombotic risk factors (such as age, sex, comorbidities, use of oral contraceptives). Injury-specific and knee arthroscopy–specific data were collected on inclusion and completed from medical records or clinical research forms. POT-CAST participants provided a blood sample at the emergency department shortly after trauma. POT-KAST participants provided a preoperative blood sample (within 4 hours before knee arthroscopic surgery started) and a postoperative blood sample (within 4 hours after the surgery ended). In case of randomization to LMWH, the first dose was administered after (postoperative) blood sampling in all participants. Written informed consent was received from all participants. The Medical Ethics Committee of the Leiden University Medical Center approved both trials. The clinicaltrials.gov identifiers of both trials are #NCT01542762 (POT-CAST) and #NCT01542723 (POT-KAST).
Current study
Aim 1: The effect of lower-leg trauma on the coagulation system
Main analysis
For the first aim, we compared plasma samples of individuals with lower-leg injury with control samples. Individuals with lower-leg injury were included from the POT-CAST trial (further referred to as patients with lower-leg injury). As control samples, we used the preoperative plasma samples of individuals who participated in the POT-KAST trial (further referred to as controls). These samples were considered suitable as control samples, as at the point of blood sampling coagulation was not influenced by an acute trauma caused by knee arthroscopy or by its indication. The predominant indication for knee arthroscopy was a meniscectomy, which is performed in patients with persisting complaints after minor knee trauma in the past. Furthermore, samples from both groups were processed and stored in a similar way, and the laboratory measurements were done in both groups in the same batches.
Subgroup analyses
Severity of injury
To study a possible association between severity of injury and changes in coagulation factor levels, we classified the severity of injury in a systematic manner by using the Abbreviated Injury Scale (AIS). This scale is commonly used in trauma surgery and gives a comprehensive ranking of injury types by severity, in which severity is defined as the probability of death caused by the injury. The lowest score (ie, 1) means minor injury, whereas the highest score (ie, 6) stands for fatal injury.8 Patients with a contusion, ankle distortion, or phalanx fracture had an AIS score of 1. The remainder of lower-leg injuries had an AIS score of 2. We further subdivided the injuries a priori, after consulting 2 trauma and orthopedic surgeons. This resulted in a severity ranking of lower-leg injuries with 6 categories. Category 1 consisted of contusion, ankle distortion (including ankle luxation without fracture), or phalanx fracture; category 2A included metatarsal fractures and category 2B included Achilles’ tendon ruptures. Category 2C involved tarsal fractures or infrasyndesmotic ankle fractures. Category 2D consisted of suprasyndesmotic and transsyndesmotic ankle fractures, and finally, category 2E involved tibia and/or fibula shaft fractures. Patients with fractures or Achilles’ tendon ruptures who were operated, were grouped separately (both category 2F), assuming that the severity of these injuries was such that it necessitated surgical treatment.
Time between trauma and blood sampling
Not all patients with lower-leg injury were admitted to the hospital on the same day as trauma occurrence. We studied the effect of time between injury and blood sampling in 2 ways (by studying the correlation between coagulation factor levels and timing of blood sampling after trauma and by performing a sensitivity analysis in which the main analysis was restricted to patients with blood sampling on the same day as trauma occurrence).
Synergistic effects
Possible synergistic effects of lower-leg injury and known risk factors for VTE on coagulant factor levels were assessed. For this purpose, we split the participants into the following subgroups: (1) risk factor absent and lower-leg injury absent, (2) risk factor present and lower-leg injury absent, (3) risk factor absent and lower-leg injury present, and (4) risk factor present and lower-leg injury present. Risk factors included male sex, age > 55 years, obesity (body mass index [BMI] > 25 kg/m2), comorbidity, use of oral contraceptives (in women), factor V Leiden mutation, factor II 20210A mutation, and non-O blood group.
Validation in population controls
To verify our main results, patients with lower-leg injury were compared with a second control group. For this purpose, we used data of the MEGA (Multiple Environmental and Genetic Assessment of risk factors for venous thrombosis) study, of which details were published previously and are described in the supplemental Materials.9 In short, the MEGA study is a population-based case-control study of which the controls involved persons with no current or history of VTE. All controls who provided a blood sample were included in current control group and considered population controls. Pregnant controls were excluded to obtain a comparable control group for patients with lower-leg injury (because pregnancy was an exclusion criterion in the POT-CAST trial). Likewise, patients with lower-leg injury greater than 70 years of age were excluded for validation analysis because controls in the MEGA study were aged up to 70 years. Different laboratory devices were used for the measurements in the MEGA and POT-CAST study (ie, STA-R and ACL-TOP 700 analyzer, respectively), inducing possible misclassification bias when comparing both measurements. Therefore, a sensitivity analysis was used to assess the risk of misclassification. Details of this analysis are included in the supplemental Materials.
Aim 2: the effect of knee arthroscopy on the coagulation system.
For the second aim, we compared the postoperative plasma sample of individuals who had undergone knee arthroscopy (ie, the POT-KAST participants) to their preoperative plasma sample, for which we excluded individuals with a missing postoperative sample. The included patients for this aim are further referred as patients who underwent knee arthroscopy (Figure 1).
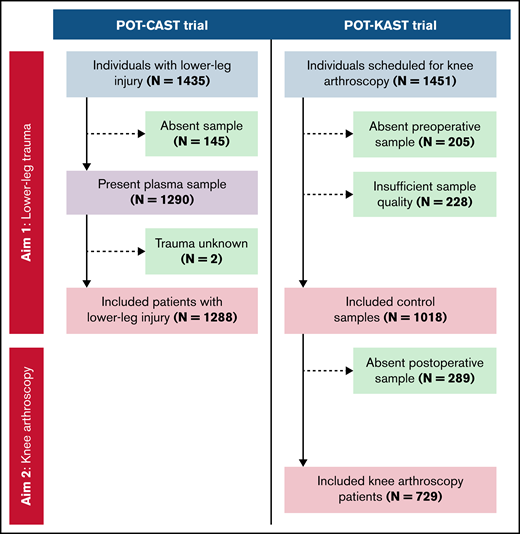
Flowchart of participant inclusion from the POT-CAST and POT-KAST trials for measurements of coagulation factors.
Flowchart of participant inclusion from the POT-CAST and POT-KAST trials for measurements of coagulation factors.
Outcomes
Plasma levels of fibrinogen, factor (F)VIII, FIX, FXI, von Willebrand factor (VWF), and D-dimer were measured. In addition, the amount of soluble tissue factor (TF) in plasma was quantified. To obtain more insight in underlying mechanisms of coagulation activation, biomarkers of inflammation (ie, interleukin-6 [IL-6]), cell damage (ie, cell-free DNA [cfDNA]), and neutrophil extracellular traps formation (ie, myeloperoxidase-DNA complexes [MPO-DNA]) were assessed. TF, IL-6, cDNA, and MPO-DNA were measured in randomly selected subsets of both POT-CAST and POT-KAST populations who did not develop symptomatic VTE in first 3 months, as depicted in Figure 1 and supplemental Figure 2.
Laboratory measurements
Blood of every participant in the POT-(K)CAST trials was collected in vacuum citrate tubes (0.105 M, 3.2%). These tubes were centrifuged during 10 minutes at 2500g at 18°C. The resulting plasma was aliquoted and stored at −80°C within 4 hours after vena puncture. All coagulation factors in plasma were measured using ACL-TOP 700 analyzer with HemosIL reagents (Werfen Instrumentation Laboratory, Barcelona, Spain). FVIII, FIX, and FXI were quantified using specific activated partial thromboplastin time assays and fibrinogen was determined with the Clauss method.10 Automated latex enhanced immunoassays were used to measure VWF and D-dimer with vWF:Ag reagent and D-dimer HS 500 reagent, respectively. Enzyme-linked immunosorbent assays (ELISAs) were used to quantify TF (human coagulation factor III/tissue factor Quantikine ELISA, R&D Systems, Minneapolis, MN) and IL-6 (Human IL-6 ELISA MAX, BioLegend, San Diego, CA; IL-6 levels < 8.0 pg/mL deviated too much from the calibration line and were therefore undetectable. MPO-DNA was assessed using monoclonal antibody to MPO (Clone 4A4, Sanbio, Uden, the Netherlands) and an anti-DNA antibody from the cell death detection ELISA (Sigma-Aldrich, Zwijndrecht, the Netherlands).11 cfDNA concentrations were assessed using a double-strand DNA assay kit (Quant-iT PicoGreen, Fisher Scientific, Landsmeer, the Netherlands).
Laboratory reference ranges were derived from protocols of the laboratory tests and the Dutch blood bank (Sanquin).12
Statistical analysis
Aim 1: the effect of lower-leg trauma on the coagulation system.
Plasma levels were expressed as means ± standard deviation. Mean plasma levels and mean differences with their 95% confidence intervals (95% CIs) were calculated using linear regression. If not normally distributed, data were ln-transformed and ln-retransformed after analyses resulting in geometric means instead of means and mean ratios instead of mean differences. Details of these calculations are included in the supplemental Materials. As IL-6 levels < 8.0 pg/mL were not detectable, we performed censored linear regression resulting in left-censored mean differences. All obtained mean differences/ratios were adjusted for sex, age, BMI, comorbidity, infections in the last 2 months, and malignancy in the last 5 years. Mean differences/ratios obtained for FVIII, FIX, FXI, VWF, fibrinogen, and D-dimer were also adjusted for use of oral contraceptives.13-17 Comorbidities included chronic obstructive pulmonary disease, liver disease, kidney disease, rheumatoid arthritis, multiple sclerosis, heart failure, hemorrhagic stroke, and arterial thrombosis.
As mentioned above, 3 subgroup analyses were performed. First, the main results were stratified according to severity of injury. Severity of injury was correlated to coagulation factor levels using linear regression (adjusted for the addressed confounders). This resulted in regression coefficients, which reflected the increase/decrease in factor levels per step increase of injury severity. If data were ln-retransformed because of skewedness, the result should be interpreted as a relative increase. Second, time between trauma and blood sampling was correlated to coagulation factor levels in scatterplots with regression lines. Furthermore, a sensitivity analysis was performed in which the main analysis was restricted to subjects with blood draw on the day of trauma occurrence. Third, we assessed possible synergistic effects of lower-leg injury and known risk factors for VTE on coagulation factor levels by composing subgroups as mentioned above and using linear regression, resulting in mean differences (adjusted for the same confounders as mentioned previously) compared with the reference group consisting of subjects with neither the risk factor nor lower leg injury. Finally, as a validation of our main results, we performed the same analyses with a second control group consisting of population controls.
Aim 2: the effect of knee arthroscopy on the coagulation system.
Preoperative and postoperative plasma levels of patients who underwent knee arthroscopy were also described as means ± standard deviation. Nonnormally distributed data were analyzed in the same way as for the first aim of this study. Paired mean changes with corresponding 95% CIs were calculated. IL-6 was dichotomized based on detectable (>8.0 pg/mL) and undetectable (≤8.0 pg/mL) levels. Possible switches between these 2 categories within patients were described, and paired mean change was calculated for patients with detectable pre- and postoperative IL-6 levels (>8.0 pg/mL). Finally, subgroup analyses were performed in which coagulation factor levels were stratified for age, sex, BMI, comorbidity, and aspects of the surgery, such as duration of surgery.
All analyses were performed in Statistical Package for the Social Sciences version 25 (SPSS; IBM, Armonk, NY) and Stata 16.0 (http://www.stata.com). Figures were generated using GraphPad Prism version 9.0.1 (GraphPad Software, San Diego, CA; http://www.graphpad.com).
Results
Aim 1: the effect of lower-leg trauma on the coagulation system
Study population.
A total of 1288 patients with lower-leg injury were included, who were compared with 1018 control subjects (Figure 1). Both populations had comparable distributions of general patient characteristics, that is, a median age of 46 years for patients and 50 years for controls, and 50% of patients and 57% of controls were male (Table 1). Most patients had a fracture of the foot (54%) or ankle (34%; supplemental Table 1).
General characteristics of study populations
| Aim 1 | Aim 2 | |||
|---|---|---|---|---|
| Patients with lower-leg injury (N = 1288)* | Controls (N = 1018)† | Knee arthroscopy patients (N = 729)‡ | ||
| Sex | Male, n (%) | 646 (50.2) | 581 (57.1) | 416 (57.1) |
| Age | Median in y (5th-95th percentile) | 46.2 (20.6-73.0) | 50.0 (24.0-67.0) | 49.4 (24.0-67.0) |
| BMI | <18.5 kg/m2, n (%) | 12 (1.0) | 1 (0.1) | 1 (0.1) |
| 18.5-25.0 kg/m2, n (%) | 569 (47.3) | 351 (35.0) | 257 (35.8) | |
| 25.0-30.0 kg/m2, n (%) | 439 (36.5) | 432 (43.2) | 308 (43.0) | |
| >30.0 kg/m2, n (%) | 182 (15.2) | 217 (21.7) | 151 (21.1) | |
| Comorbidity | Yes, n (%) | 138 (11.3) | 83 (8.3) | 58 (8.1) |
| Infections in last 2 mo | Yes, n (%) | 175 (14.6) | 139 (13.9) | 106 (14.8) |
| Smoking | Yes: currently, n (%) | 320 (26.8) | 190 (19.1) | 139 (19.4) |
| Yes: formerly, n (%) | 329 (27.5) | 333 (33.4) | 232 (32.4) | |
| Current use of oral contraceptives§ | Yes, n (%) of women | 110 (18.2) | 85 (19.9) | 54 (17.6) |
| Malignancy in last 5 y | Yes, n (%) | 34 (2.8) | 17 (1.7) | 12 (1.7) |
| ABO-blood type | Homozygote O, n (%) | 521 (43.3) | 403 (44.4) | 300 (46.5) |
| Heterozygote O, n (%) | 549 (45.6) | 411 (45.2) | 279 (43.3) | |
| Homozygote non-O, n (%) | 133 (11.1) | 94 (10.4) | 66 (10.2) | |
| Factor II 20210A mutation | Heterozygote, n (%) | 26 (2.1) | 22 (2.2) | 15 (2.1) |
| Factor V Leiden | Heterozygote, n (%) | 49 (4.0) | 34 (3.7) | 25 (3.8) |
| Homozygote, n (%) | 1 (0.1) | 0 (0.0) | 0 (0.0) | |
| Prophylactic LMWH (after blood sampling) | Yes, n (%) | 639 (49.6) | 513 (50.4) | 371 (50.9) |
Percentages indicate proportions in nonmissing data only.
Numbers of missing data for patients with lower-leg injury: BMI (N = 86), comorbidity (N = 70), infection (N = 86), smoking (N = 93), oral contraceptives (N = 37), malignancy (N = 74), ABO blood type (N = 85), factor II mutation (N = 73), and factor V Leiden mutation (N = 77).
Control samples involved preoperative samples of patients who underwent knee arthroscopy. Numbers of missing data for controls: BMI (N = 17), comorbidity (N = 18), infection (N = 18), smoking (N = 21), oral contraceptives (N = 9), malignancy (N = 22), ABO blood type (N = 110), factor II mutation (N = 37), and factor V Leiden mutation (N = 88).
Numbers of missing data for patients who underwent knee arthroscopy: BMI (N = 12), comorbidity (N = 12), infection (N = 12), smoking (N = 12), oral contraceptives (N = 7), malignancy (N = 16), ABO blood type (N = 84), factor II mutation (N = 28), and factor V Leiden mutation (N = 70).
Oral contraceptives included any type of hormonal therapy, including oral contraceptives and intrauterine devices.
Main analyses.
Patients with lower-leg injury had the following mean levels: FVIII 149.2%, FIX 135.9%, FXI 117.5%, VWF 166.8%, fibrinogen 339.2 mg/dL, and D-dimer 723.6 ng/mL (Table 2). These means were all higher compared with controls, especially for FVIII (adjusted mean difference, 26.6%; 95% CI, 23.6-29.6), VWF (adjusted mean difference, 29.4%; 95% CI, 25.7-33.1), and fibrinogen 34.0 mg/dL (95% CI, 27.4-40.7). Mean D-dimer levels were threefold higher (95% CI, 3.2-3.7) in patients compared with controls. Mean TF in patients (ie, 37.4 pg/mL) was lower compared with controls (adjusted mean difference, −3.4 pg/mL; 95% CI, −6.2 to −0.6). An adjusted left-censored mean difference of 163.1 pg/mL (95% CI, −335.9 to 662.2) was found for detectable IL-6 levels.
Aim 1: mean differences in coagulation and inflammatory factor levels in patients with lower-leg injury compared with controls
| Reference range | Mean (SD)* | Mean difference/ratio (95% CI)* | Adjusted mean difference/ratio (95% CI)*,† | |
|---|---|---|---|---|
| FVIII activity (%) | 50%-150% | |||
| Controls (N = 1018) | 125.6 (29.4) | Reference | Reference | |
| Patients (N = 1288) | 149.2 (40.3) | 23.6 (20.6-26.5) | 26.6 (23.6-29.6)‡ | |
| FIX activity (%) | 65%-135% | |||
| Controls (N = 1018) | 125.1 (22.4) | Reference | Reference | |
| Patients (N = 1288) | 135.9 (24.8) | 10.9 (8.9-12.8) | 13.9 (12.1-15.7)‡ | |
| FXI activity (%) | 65%-140% | |||
| Controls (N = 1018) | 114.3 (21.3) | Reference | Reference | |
| Patients (N = 1288) | 117.5 (23.8) | 3.3 (1.4-5.1) | 5.0 (3.2-6.9)‡ | |
| VWF antigen (%) | 50%-150% | |||
| Controls (N = 1018) | 140.5 (39.5) | Reference | Reference | |
| Patients (N = 1288) | 166.8 (47.7) | 26.2 (22.6-29.9) | 29.4 (25.7-33.1)‡ | |
| Fibrinogen (mg/dL) | 200-393 mg/dL | |||
| Controls (N = 1018) | 312.1 (73.4) | Reference | Reference | |
| Patients (N = 1288) | 339.2 (93.7) | 27.1 (20.1-34.1) | 34.0 (27.4-40.7)‡ | |
| D-dimer (ng/mL)* | <500 ng/mL | |||
| Controls (N = 1018) | 216.5 (205.4-228.3)* | Reference | Reference | |
| Patients (N = 1288) | 723.6 (685.0-764.4)* | 3.3 (3.1-3.6)* | 3.4 (3.2-3.7)*,‡ | |
| TF (pg/mL) | <62.2 pg/mL | |||
| Controls (N = 83) | 40.5 (10.0) | Reference | Reference | |
| Patients (N = 88) | 37.4 (9.3) | −3.1 (−6.0 to −0.2) | −3.4 (−6.2 to −0.6) | |
| cfDNA (µg/mL) | <1.14 µg/mL | |||
| Controls (N = 28) | 0.9 (0.1) | Reference | Reference | |
| Patients (N = 67) | 1.0 (0.2) | 0.0 (0.0-0.1) | 0.0 (−0.1 to 0.1) | |
| MPO-DNA (ng/mL)* | <0.64 ng/mL | |||
| Controls (N = 28) | 0.1 (0.1-0.1)* | Reference | Reference | |
| Patients (N = 67) | 0.1 (0.1-0.1)* | 0.9 (0.6-1.2)* | 0.9 (0.7-1.3)* | |
| IL-6 (pg/mL) | <10 pg/mL | |||
| Controls (N = 80) | NA | Reference | Reference | |
| Patients (N = 75) | NA | 193.6 (−291.8 to 679.0)§ | 163.1 (−335.9 to 662.2)§ |
Control samples involved the preoperative samples of knee arthroscopy patients.
Geometric means (with 95% CIs) and mean ratios of ln-retransformed data.
Adjusted for sex, age, BMI, comorbidity, infections, and malignancy.
Adjusted for sex, age, BMI, comorbidity, infections, malignancy, and use of oral contraceptives.
Left-censored results, that is, only detectable levels (>8.0 pg/mL) were analyzed; means could not be obtained.
Subgroup analyses
Severity of injury
An association between injury severity and levels of coagulation factors was demonstrated, mainly for FVIII and VWF (supplemental Table 2; Figure 2). More specifically, patients with phalanx fractures (labeled as the least severe injury type) had the lowest levels of FVIII (136.0%) and VWF (152.8%), whereas patients with fractures in need for surgery (considered the most severe injury type) had the highest levels of FVIII (167.0%) and VWF (182.8%). Achilles’ tendon rupture, considered minimally severe, was associated with relatively high levels of FVIII (154.8%) and VWF (169.3%). At the same time, D-dimer levels were rather low (499.0 ng/mL) in patients with Achilles’ tendon rupture. Individuals with an ankle distortion or contusion had relatively high FVIII and VWF levels as opposed to phalanx fractures.
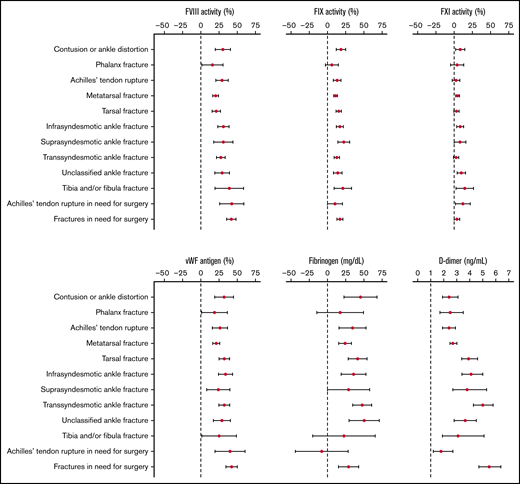
Aim 1: Error bars reflecting adjusted mean differences with 95% CIs for FVIII, FIX, FXI, VWF, fibrinogen, and D-dimerper injury type (ordered by severity) relative to controls; D-dimer expressed in mean ratios.
Aim 1: Error bars reflecting adjusted mean differences with 95% CIs for FVIII, FIX, FXI, VWF, fibrinogen, and D-dimerper injury type (ordered by severity) relative to controls; D-dimer expressed in mean ratios.
Time between trauma and blood sampling
Of all patients, 62.1% presented within 24 hours after trauma occurrence. As shown in supplemental Figure 3, time between trauma and blood sampling did not affect coagulation factor levels. Furthermore, the sensitivity analysis restricted to patients who presented within 24 hours provided similar results, which are not shown.
Synergistic effects
As shown in Table 3, the combination of lower-leg trauma and a known risk factor for VTE did not affect FVIII, FIX, FXI, VWF, fibrinogen, or D-dimer levels in a synergistic way. For higher age and for obesity, some combinations led to supra-additive effects.
Aim 1: combined effects of lower-leg injury and male, sex, age > 55 y, BMI > 30, comorbidity, oral contraceptives, factor V Leiden mutation, factor II mutation, and non-O blood group on the patterns of coagulation factor levels
| Risk factor | Lower-leg injury | Number of persons (N = 2306) | Adjusted mean difference (95% CI)* | ||||||
|---|---|---|---|---|---|---|---|---|---|
| FVIII (%) | FIX (%) | FXI (%) | VWF (%) | Fibrinogen (mg/dL) | D-dimer (ng/mL) | ||||
| Male sex | Absent | Absent | 437 | 0.0 (Ref) | 0.0 (Ref) | 0.0 (Ref) | 0.0 (Ref) | 0.0 (Ref) | 1.0 (Ref) |
| Present | Absent | 581 | −1.4 (−5.9 to 3.1) | 0.5 (−2.3 to 3.2) | −9.7 (−12.4 to −6.9) | 3.7 (−1.9 to 9.3) | −20.2 (−30.3 to −10.1) | 0.8 (0.7-0.9) | |
| Absent | Present | 642 | 24.1 (19.8 -28.9) | 13.2 (10.5 -15.8) | 3.9 (1.3-6.6) | 26.5 (21.2-31.9) | 31.3 (21.6-41.0) | 3.0 (2.7-3.4) | |
| Present | Present | 646 | 27.3 (22.7 -31.8) | 14.9 (12.1 -17.7) | −3.8 (−6.6 to −1.0) | 35.6 (29.9 -41.2) | 15.9 (5.626.1) | 3.1 (2.7-3.4) | |
| Age > 55 y | Absent | Absent | 703 | 0.0 (Ref) | 0.0 (Ref) | 0.0 (Ref) | 0.0 (Ref) | 0.0 (Ref) | 1.0 (Ref) |
| Present | Absent | 315 | 11.4 (6.7-16.2) | 6.9 (4.0-9.8) | 2.4 (−0.5 to 5.2) | 17.5 (11.7 -23.4) | 15.7 (5.0-26.4) | 1.5 (1.3-1.7) | |
| Absent | Present | 870 | 24.3 (20.7 -27.9) | 11.4 (9.2 -13.6) | 2.4 (0.2-4.6) | 26.5 (22.0 -31.0) | 20.5 (12.3-28.6) | 3.2 (2.9-3.5) | |
| Present | Present | 418 | 38.4 (33.9 -43.0) | 23.0 (20.2 -25.7) | 10.8 (8.0 -13.6) | 46.9 (41.3 -52.5) | 66.1 (55.9-76.3) | 5.4 (4.8-6.0) | |
| Obesity† | Absent | Absent | 352 | 0.0 (Ref) | 0.0 (Ref) | 0.0 (Ref) | 0.0 (Ref) | 0.0 (Ref) | 1.0 (Ref) |
| Present | Absent | 649 | 3.0 (−2.2 to 8.3) | 12.9 (9.6-16.2) | 5.3 (2.1-8.6) | 1.6 (−4.8 to 8.1) | 32.8 (21.0-44.7) | 1.2 (1.0-1.3) | |
| Absent | Present | 586 | 25.3 (22.0 -28.5) | 12.4 (10.3 14.4) | 3.6 (1.6-5.6) | 28.2 (24.1-32.2) | 30.2 (22.8-37.7) | 3.5 (3.3-3.8) | |
| Present | Present | 616 | 32.8 (27.0-38.5) | 28.4 (24.8 -31.9) | 13.1 (9.6 -16.7) | 34.7 (27.6 -41.8) | 71.0 (58.1-83.8) | 3.5 (3.0-4.0) | |
| Comorbidity | Absent | Absent | 917 | 0.0 (Ref) | 0.0 (Ref) | 0.0 (Ref) | 0.0 (Ref) | 0.0 (Ref) | 1.0 (Ref) |
| Present | Absent | 83 | −1.9 (−9.8 to 6.0) | 5.9 (1.2-10.7) | 1.8 (−3.1 to 6.6) | 9.1 (−0.5 to 18.8) | 12.4 (−5.3 to 30.1) | 1.2 (1.0-1.4) | |
| Absent | Present | 1080 | 26.3 (23.2-29.4) | 14.4 (12.5 -16.4) | 5.4 (3.5-7.3) | 29.2 (25.4 -33.1) | 34.3 (27.3- 41.3) | 3.5 (3.2-3.8) | |
| Present | Present | 138 | 27.0 (20.6 -33.4) | 13.9 (10.0 -17.8) | 2.0 (−1.9 to 5.9) | 39.5 (−10.5 to −2.6) | 42.2 (27.9- 56.5) | 3.3 (2.8-3.9) | |
| Oral contraceptives use in women | Absent | Absent | 343 | 0.0 (Ref) | 0.0 (Ref) | 0.0 (Ref) | 0.0 (Ref) | 0.0 (Ref) | 1.0 (Ref) |
| Present | Absent | 85 | 14.4 (5.9 -23.0) | 26.2 (20.5 -31.8) | 13.6 (8.0 -19.2) | 14.6 (3.8 -25.3) | 28.8 (10.0-47.7) | 1.4 (1.2-1.8) | |
| Absent | Present | 495 | 26.4 (21.6 -31.2) | 15.0 (11.8 -18.2) | 6.4 (3.2-9.6) | 28.2 (22.2 -34.3) | 35.8 (25.2-46.4) | 3.1 (2.8-3.5) | |
| Present | Present | 110 | 30.9 (23.0 -38.9) | 32.8 (27.5 -38.0) | 6.5 (1.3-11.7) | 39.3 (29.4 -49.3) | 49.5 (32.0-67.0) | 4.0 (3.3-4.8) | |
| Factor V Leiden mutation‡ | Absent | Absent | 896 | 0.0 (Ref) | 0 (Ref) | 0.0 (Ref) | 0.0 (Ref) | 0.0 (Ref) | 1.0 (Ref) |
| Present | Absent | 34 | 5.7 (−6.3 to 17.8) | 0.4 (−6.9 to 7.6) | −4.3 (−11.6 to 3.0) | −0.4 (−15.0 to 14.2) | −5.4 (−32.2 to 21.4) | 1.2 (0.9-1.6) | |
| Absent | Present | 1161 | 26.8 (23.6 -30.0) | 14.3 (12.3 -16.2) | 4.9 (3.06.9) | 29.4 (25.5 -33.3) | 35.9 (28.8-43.1) | 3.5 (3.2-3.8) | |
| Present | Present | 50 | 30.9 (20.7 -41.1) | 11.6 (5.5 -17.8) | 3.9 (−2.3 to 10.1) | 39.5 (26.8 -52.1) | 20.8 (−2.0 to 43.5) | 4.0 (3.1-5.1) | |
| Factor II 20210A mutation‡ | Absent | Absent | 959 | 0.0 (Ref) | 0.0 (Ref) | 0.0 (Ref) | 0.0 (Ref) | 0.0 (Ref) | 1.0 (Ref) |
| Present | Absent | 22 | −3.5 (−18.3 to 11.3) | −1.4 (−10.4 to 7.5) | −4.0 (−13.0 to 5.0) | −5.6 (−23.5 to 12.4) | 0.6 (−32.3 to 33.5) | 1.2 (0.8-1.7) | |
| Absent | Present | 1189 | 26.3 (23.2 -29.4) | 13.7 (11.8-15.6) | 4.7 (2.8-6.6) | 29.1 (25.3 -32.9) | 35.1 (28.2-42.0) | 3.5 (3.2-3.8) | |
| Present | Present | 26 | 27.2 (12.9 -41.4) | 10.8 (2.2 -19.3) | −1.0 (−9.6 to 7.7) | 28.9 (11.3 -46.5) | 25.3 (−6.2 to 56.9) | 4.1 (2.9-5.9) | |
| Non-O blood group‡ | Absent | Absent | 403 | 0.0 (Ref) | 0.0 (Ref) | 0.0 (Ref | 0.0 (Ref) | 0.0 (Ref) | 1.0 (Ref) |
| Present | Absent | 505 | 21.2 (16.8 -25.7) | 6.4 (3.6-9.2) | 6.6 (3.8-9.5) | 36.6 (31.4 -41.8) | −2.2 (−12.6 to 8.1) | 1.1 (0.9-1.2) | |
| Absent | Present | 521 | 25.7 (21.2 -30.2) | 14.5 (11.7 -17.3) | 5.8 (3.0-8.7) | 31.5 (26.2 -36.8) | 40.4 (29.9-50.9) | 3.6 (3.1-4.0) | |
| Present | Present | 682 | 47.8 (43.6 -52.1) | 19.6 (16.9 -22.3) | 11.0 (8.3 -13.7) | 64.1 (59.1 -69.1) | 28.4 (18.5-38.4) | 3.6 (3.3-4.1) | |
Adjusted for sex, age, BMI, comorbidity, presence of malignancy, and use of oral contraceptives.
Obesity defined as BMI > 30.
Heterozygote and homozygote variants of factor V Leiden mutation, factor II mutation, and non-O blood group were combined.
Aim 2: coagulation and inflammatory factor levels compared before and after knee arthroscopy
| Reference range | Mean (SD)* | Mean change (95% CI) | ||
|---|---|---|---|---|
| Preoperative | Postoperative | |||
| All patients (N = 729) | ||||
| FVIII activity (%) | 50%-150% | 123.4 (28.0) | 114.3 (35.8) | −9.0 (−11.1 to −7.0) |
| FIX activity (%) | 65%-135% | 123.2 (21.9) | 110.3 (21.7) | −12.9 (−13.9 to −11.9) |
| FXI activity (%) | 65%-140% | 112.5 (20.7) | 101.1 (21.0) | −11.4 (−12.6 to −10.3) |
| VWF antigen (%) | 50%-150% | 140.7 (39.2) | 133.3 (40.7) | −7.2 (−8.6 to −5.8) |
| Fibrinogen (mg/dL) | 200-393 mg/dL | 309.4 (72.3) | 277.4 (67.4) | −32.0 (−34.6 to −29.5) |
| D-dimer (ng/mL)* | <500 ng/mL | 218.5 (204.4-233.6)* | 207.7 (196.0-220.1)* | −51.3 (−86.3 to −16.2) |
| Random subset (N = 80) | ||||
| IL-6 (pg/mL)† | <10 pg/mL | |||
| ≤8 pg/mL | N = 52 | N = 52 | NA | |
| >8 pg/mL | N = 28 | N = 28 | −34.5 (−63.9 to −5.1) | |
| Random subset (N = 70) | ||||
| TF (pg/mL) | <62.2 pg/mL | 42.2 (9.3) | 39.0 (8.5) | −3.3 (−4.1 to −2.4) |
| Random subset (N = 28) | ||||
| cfDNA (μg/mL) | <1.14 μg/mL | 0.9 (0.1) | 0.9 (0.1) | −0.1 (−0.1 to 0.0) |
| MPO-DNA (ng/mL)* | <0.64 ng/mL | 0.1 (0.1-0.1)* | 0.1 (0.1-0.1)* | 0.0 (0.0- 0.1) |
Geometric means (with 95% CIs) and mean ratios of ln-retransformed data.
Number of patients per category of IL-6 is given instead of means. Mean change could only be calculated for detectable levels (>8 pg/mL).
Validation in population controls.
The main results were verified by comparing 1204 patients with lower-leg injury with 2921 population controls, of which general characteristics are shown in supplemental Table 3. Similar results were observed, except for fibrinogen, of which the adjusted mean difference was smaller (ie, 10.8 mg/dL; 95% CI, 6.0-15.7; supplemental Table 4).
Aim 2: the effect of knee arthroscopy on the coagulation system
Study population.
In total, 729 patients who underwent knee arthroscopy were included (Figure 1). Their median age was 49 years, and 57% of the patients were male (Table 1). Meniscectomy was performed most (63%), and procedures were performed predominantly under general anesthesia (65%) and with the use of a thigh tourniquet (99%; supplemental Table 5).
Main analyses.
All coagulation factors decreased after arthroscopy; the largest decreases were found for D-dimer (mean change, −51.3 ng/mL; 95% CI, −86.3 to −16.2) and fibrinogen (mean change, −32.0 mg/dL; 95% CI, −34.6 to −29.5) (Table 4). FVIII and VWF showed the smallest decrease of 9% (95% CI, −11.1 to −7.0) and 7.2% (95% CI, −8.6 to −5.8), respectively. TF was also reduced after knee arthroscopy, which corresponded to a mean change of −3.3 pg/mL (95% CI, −4.1 to −2.4). Plasma levels of cfDNA and MPO did not change after surgery. Preoperative IL-6 levels did not change from detectable (>8.0 pg/mL) to undetectable (≤8.0 pg/mL) or vice versa in any patient. Detectable IL-6 levels decreased with a mean change of −34.5 pg/mL (95% CI, −63.9 to −5.1 pg/mL) after arthroscopy. Subgroup analyses showed that arthroscopic surgery > 30 minutes was associated with increased postoperative levels of FVIII, VWF, and D-dimer relative to preoperative levels. For the other subgroups, no differences were identified (supplemental Table 6).
Discussion
In this study, we observed an association between lower-leg injury and increased plasma levels of FVIII, FIX, FXI, VWF, fibrinogen, and D-dimer. The increase in D-dimer levels was most pronounced with a 3-fold increase, followed by FVIII and VWF with a 1.2-fold increase for both factors. Furthermore, IL-6 levels were elevated after lower-leg injury, whereas soluble TF, cfDNA and MPO-DNA were unaffected. Knee arthroscopy did not affect any of the measured factors. In contrast, plasma levels of FVIII, FIX, FXI, VWF, fibrinogen, and D-dimer decreased postoperatively.
The extensive increase in D-dimer levels following lower-leg injury indicates in vivo activation of coagulation. This is most probably the result of the elevated plasma levels of FVIII, FIX, and FXI activity. The elevations in FVIII levels were the strongest, which is probably explained by FVIII being an acute phase reactant; that is, homeostatic disturbances such as traumatic injury lead to increased FVIII levels.18-24 Although fibrinogen is also an acute phase protein,20 only a moderate increase in fibrinogen levels was observed, which was not verified in the comparison with population controls. The increased levels of VWF indicate endothelial activation, which suggests an inflammatory response because of lower-leg trauma.24-26 The enhanced posttraumatic IL-6 levels support this theory. This is also in line with studies that found that trauma induces short-term hyperinflammation.27 During this acute phase after trauma, remnants of tissue damage are removed by platelets and immune cells, by which the tissue is prepared for repair.27 It seems contradictory that neutrophil extracellular traps were not detected, based on the unaffected levels of MPO-DNA, despite a hyperinflammatory state. However, it is known that minor trauma leads to hyperinflammation without neutrophil extracellular trap formation, and lower-leg trauma can be considered relatively minor.27 To obtain an indication of the extent of cell damage, cfDNA and soluble TF levels were measured. Both parameters were not enhanced in patients with lower-leg injury, although this might be explained by dilution of (local) effects as plasma levels were measured only systemically. Of note, soluble TF does not give an indication of the level of TF-dependent activation of coagulation.
Subgroup analyses stratifying for the severity of injury demonstrated a strong association with increased FVIII and VWF plasma levels. This is in line with the results of a study performed in mice that showed that FVIII levels correlate with the extent of vascular injury.28 The highest levels of these factors were observed in patients with more extensive lower extremity fractures, that is, ankle fractures and tibia fractures and with injuries in need for surgical treatment. Ankle fractures were subdivided into infra-, trans-, and suprasyndesmotic fractures.29,30 As these fractures are assumed to impact the stability of the ankle joint differently and to affect distinct parts of the bone (ie, infrasyndesmotic fractures affect the epiphysis, transsyndesmotic fractures affect the metaphysis, and suprasyndesmotic fractures affect the diaphysis), considerable differences in the effect on coagulation factor levels were expected between these fracture types.31 Therefore, we chose to subdivide ankle fractures into these categories for analyses. However, no strong differences were observed. Somewhat surprisingly, patients with a contusion or ankle distortion also had relatively high FVIII and VWF levels. This may be explained because only severe contusions or ankle distortions are treated with cast immobilization and were hence included in the POTCAST trial. Achilles’ tendon ruptures were also associated with high levels of FVIII and VWF, which corresponds with the high rates of VTE following Achilles tendon ruptures.32-34 However, because tendons are not well vascularized and the extent of injury is thought to be low, it is unclear why these subjects showed such high factor levels. Moreover, it is contradictory that patients with this type of injury had relatively low D-dimer levels.
In patients who underwent knee arthroscopy, we observed an opposite effect on the coagulation system, that is, levels of coagulation factors decreased postoperatively. A possible explanation could be consumption of coagulation factors because of the trauma. However, this seems unlikely because arthroscopy is considered as a minimally invasive procedure. Furthermore, the lack of a postoperative increase in D-dimer levels (in fact, a decrease was observed) indicates there was no (additional) coagulation in vivo by which coagulation factors were consumed. Alternatively, postoperative levels could be relatively low compared with preoperative levels as a result of physiologic variation over the day (circadian rhythm). In line with this theory, we observed that both pre- and postoperative factor levels were slightly higher in patients operated in the morning compared with those operated in the afternoon. In support of this, several studies have reported FVIII, VWF, and fibrinogen levels to be highest in the morning.35-40 Third, preoperative stress could cause preoperative elevation of factor levels, which has only been described for FVIII.41 Compared with the population controls (used in validation for aim 1), preoperative levels of FVIII, FIX and VWF were higher (10%-29%), indicating that perioperative stress could have been involved. However, this does not explain the consistent decrease for all factors measured. Fourth, we considered hemodilution caused by perioperative administration of IV saline. As patients received 0.5 L saline at most during surgery, this would lead to a maximum 14% reduction in postoperative factor levels assuming an average plasma volume of 3 L,42 which is probably lower when excretion of the exogenous fluid by the kidneys is taken into account. Finally, the postoperative blood draw may have been too early to detect an effect. However, because FVIII, VWF, fibrinogen, and D-dimer are acute phase reactants, an immediate effect is to be expected.
Important strengths of our study are that we had access to a large, unselected number of individuals. Moreover, blood was drawn shortly after trauma and before and after knee arthroscopy. Of note, prophylactic LMWH could not have affected our results, because LMWH was administered after (postoperative) blood sampling. Furthermore, for comparison with patients with lower-leg injury, 2 control groups were used from which comparable results were obtained. To assess possible misclassification caused by differences in laboratory measurements between these groups, a sensitivity analysis was performed that showed that misclassification was negligible. The patients who underwent arthroscopy were compared with themselves, which allows the most optimal comparison. There are also limitations that should be mentioned. First, blood was drawn systemically and not locally (in the injured or operated leg). Therefore, we may have missed more subtle local effects. Second, because multiple comparisons were made, type I errors might have occurred. However, because we focused on global changes in marker levels, rather than on significancy, correction for multiple testing would not change our conclusions. Third, IL-6 could not be quantified if <8.0 pg/mL, whereas IL-6 levels associated with a procoagulant state in patients with deep vein thrombosis have previously been observed to be in the ∼1-pg/mL range.43 However, our analysis likely allowed for the detection of postoperative IL-6 levels, which are known to range from 19 to 484 pg/mL at >12 to 72 hours for knee arthroplasty.44-46 Fourth, regarding aim 2, some postoperative samples were missing, mostly because of logistic reasons, and were therefore completely at random, which should therefore not have affected our results. That the general characteristics were similar for the 1018 patients who underwent knee arthroscopy with preoperative blood samples and the 729 patients who underwent knee arthroscopy with a pre- and postoperative blood sample confirms this. Finally, plasma samples of patients who underwent arthroscopy were collected postoperatively within 4 hours. An extra measurement at 12 to 24 hours postoperatively might have added more information to understand the pathophysiology of thrombus formation. Also, for patients with lower-leg injury, multiple measurements in time would be useful to evaluate the dynamics of coagulation activation, for which further research is necessary. Our study should be considered a first step in this direction.
The information about the effect of lower-leg trauma and knee arthroscopy on plasma levels of relevant coagulation factors, that is, which are related to VTE risk in general, sets a first step in understanding the mechanism of VTE in both conditions. It shows that specific alterations in blood composition (defined as a pillar of Virchow’s triad) are induced, at least by lower-leg trauma. Eventually, this knowledge can help to improve thromboprophylaxis treatment by providing new targets for prevention following lower-leg trauma, such as FXI(a) or FVIII inhibitors. FXI(a) inhibitors are already studied in humans with promising results,47 whereas FVIII inhibitors as yet have only been studied in animal models or in vitro.48,49 For arthroscopy, such an approach seems less appropriate given our findings. Furthermore, the strong differences that were found between lower leg injury and knee arthroscopy suggest that several mechanistic pathways lead to the development of VTE. More specifically, whereas lower-leg trauma initiates an inflammatory state in which coagulation factors are increased, knee arthroscopy apparently does not. This opens the question as to which mechanistic pathways are at the basis of VTE in knee arthroscopy. Possibly, the use of tourniquet during the surgery is associated with VTE, which needs to be established in further research. For lower-leg injury, the persistence of the alterations in coagulation factor levels needs to be evaluated, including the exact effect of (duration of) lower-leg cast application on coagulation.
In conclusion, lower-leg trauma was associated with strongly increased levels of procoagulant factors, especially D-dimer, FVIII, and VWF. In patients who underwent knee arthroscopy, on the other hand, procoagulant factor levels did in fact decrease. It seems that elevations in procoagulant factor levels are the result of an inflammatory reaction directly resulting from the trauma, indicated by increased plasma levels of IL-6. This mechanism differs from that seen in patients who underwent knee arthroscopy. Additional research is needed to further explore the mechanism of VTE in both patient groups, especially in patients who underwent arthroscopy.
Acknowledgments
The authors thank Petra Noordijk, Lejla Mahic, Jelle Adelmeijer, and Ingeborg de Jonge for helpful support in sample preparation and laboratory measurements.
Authorship
Contribution: S.C.C. designed the current study and set up the original clinical trials with I.B.S. and R.G.H.H.N. In both trials, samples were collected by B.N. and R.A.v.A.; A.M.R.R., H.H.V., and T.L. were involved in setting up and performing laboratory measurements; C.E.T. performed the data analyses, generated the tables and figures, and wrote the initial draft of the manuscript; I.B.S. and R.G.H.H.N. were consulted for severity of injury classification; C.E.T., B.N., H.H.V., T.L., M.H.A.B., and S.C.C. interpreted the results and wrote the manuscript; and all authors read the manuscript and contributed to the final version of the text.
Conflict-of-interest disclosure: The authors declare no competing financial interests.
Correspondence: Carolina E. Touw, Department of Clinical Epidemiology, Leiden University Medical Center, PO Box 9600, 2300 RC Leiden, The Netherlands; e-mail: c.e.touw@lumc.nl; and Suzanne C. Cannegieter, Department of Clinical Epidemiology, Leiden University Medical Center, PO Box 9600, 2300 RC Leiden, The Netherlands; e-mail: s.c.cannegieter@lumc.nl.

