

Key Points
Glomerular hyperfiltration is common in young adults with sickle cell anemia but much less common after the age of 30.
Decline of hyperfiltration to normal range occurs earlier in males with higher systolic blood pressure and on hydroxyurea therapy.

Abstract
Glomerular hyperfiltration is common in young sickle cell anemia patients and precedes development of overt kidney disease. In this multicenter pooled cohort, we characterized hyperfiltration and its decline to normal range in adult patients. Glomerular filtration rate (GFR) was estimated using the creatinine-based 2009 CKD-EPI (Chronic Kidney Disease Epidemiology Collaboration) equation omitting race adjustment and the 2021 CKD-EPI equation. Using CKD-EPI–2009, 506 patients had baseline estimated GFR (eGFR) ≥90 mL/min per 1.73 m2, median age of 24 (interquartile range [IQR], 19-34) years and 5.17 years of follow-up. The prevalence of hyperfiltration (eGFR ≥140 and ≥130 mL/min per 1.73 m2 for men and women, respectively) was 38.3%. Using CKD-EPI–2009, baseline hyperfiltration was less likely with older age (odds ratio [OR], 0.78; 95% confidence interval [CI], 0.73-0.83; P < .0001), male sex (OR, 0.32; 95% CI, 0.18-0.58; P = .0002), and higher weight (OR, 0.96; 95% CI, 0.94-0.99; P = .001). Using CKD-EPI–2021, hyperfiltration was similarly less likely with older age (OR, 0.75; 95% CI, 0.70-0.81; P < .0001), male sex (OR, 0.24; 95% CI, 0.13-0.44; P < .0001), and higher weight (OR, 0.97; 95% CI, 0.95-0.99; P = .004). In patients with baseline hyperfiltration, eGFR declined to normal values at a median age of 26.2 years. Using CKD-EPI–2009, this decline was associated with male sex (HR, 2.20; 95% CI, 1.26-3.87; P = .006), systolic blood pressure (hazard ratio [HR], 1.02; 95% CI, 1.01-1.04; P = .01), and hydroxyurea use (HR, 1.74; 95% CI, 1.002-3.03; P = .05). Using CKD-EPI–2021, decline of eGFR to normal was only associated with male sex (HR, 3.39; 95% CI, 2.01-5.69; P < .0001). Decline to normal eGFR range from hyperfiltration occurs earlier in males, those on hydroxyurea, and with higher systolic blood pressure.
Introduction
Structural and functional abnormalities of the kidney occur in patients with sickle cell disease (SCD).1 Young patients with SCD commonly manifest increased glomerular filtration rates (GFRs), even when accurately measured rather than estimated.2 Increasing evidence suggests that the nephropathy of SCD is progressive,3-5 with initial glomerular hyperfiltration leading to albuminuria, decline in kidney function, and ultimately resulting in kidney failure. These findings are most apparent in patients who have sickle cell anemia (homozygous SCD [HbSS] or sickle β0-thalassemia [HbSβ0]). Persistent albuminuria occurs earlier and more frequently in patients with sickle cell anemia who have early hyperfiltration compared with those without.3 With the likely contribution of hyperfiltration to kidney injury in SCD, understanding its pathophysiology and natural history are important. We and others have reported that hyperfiltration is highly prevalent in young adults with sickle cell anemia.6,7 However, these previous studies were performed using creatinine-based equations to estimate GFR with adjustment for the Black race, which is reported to overestimate GFR.8,9 Prior studies have shown that the creatinine-based CKD-EPI–2009 (Chronic Kidney Disease Epidemiology Collaboration) equation omitting the adjustment for the Black race that was included when developing the equation provides a more accurate estimation of GFR in SCD patients.10 A new GFR estimating equation has been developed without a race adjustment (CKD-EPI–2021) but has not yet been evaluated in SCD.11
In the current study, we have further examined glomerular hyperfiltration in sickle cell anemia using a pooled cohort of patients. We examined both the CKD-EPI–2009 (with the omission of adjustment for the Black race) and CKD-EPI–2021 equations to estimate eGFR. In addition, we sought to better characterize factors associated with the decline of hyperfiltration to the normal range in adults with sickle cell anemia.
Methods
Study design and subjects
The patients in this pooled analysis were from 4 academic medical centers in the United States (the University of North Carolina at Chapel Hill [UNC], Duke University Medical Center [Duke], the University of Illinois at Chicago [UIC], and St. Jude Children’s Research Hospital and Methodist University Comprehensive Sickle Cell Center [Methodist]) and have been previously described.12 Briefly, patients in all cohorts were ≥18 years old, and the analyses were restricted to individuals with sickle cell anemia. Evaluations were obtained during routine clinic visits when patients were in a noncrisis, “steady state.” The baseline visit was defined as the first available serum creatinine measurement during the study period. Only those patients with ≥2 measures of kidney function over the observation period were included in this analysis. At baseline, we excluded patients on dialysis, with a kidney transplant, or with an estimated glomerular filtration rate (eGFR) <90 mL/min per 1.73 m2, in the assumption that these patients had chronic kidney disease (CKD). Approvals for individual cohorts were obtained from Institutional Review Boards at each institution. The study was conducted in accordance with the Declaration of Helsinki.
Definitions
eGFR was calculated using the creatinine-based CKD-EPI–2009 equation without including the usual adjustment for the Black race.10 We also estimated GFR using the recently published creatinine-based CKD-EPI–2021 equation with a priori exclusion of race.11 Because CKD-EPI–2021 has not been rigorously evaluated and compared with measured GFR in the SCD population, we have used CKD-EPI–2009 for our primary analyses but evaluated both given the expected and imminent transition to the newer 2021 formula in clinical laboratories. A cutoff of ≥90 mL/min per 1.73 m2 was used to define normal eGFR because serum creatinine-based equations appear to overestimate renal function in individuals with SCD.13 Hyperfiltration was defined as eGFR >130 mL/min per 1.73 m2 for women and >140 mL/min per 1.73 m2 for men.6 Consequently, normal eGFR ranges in this study were defined as 90 to 130 mL/min per 1.73 m2 for women and 90 to 140 mL/min per 1.73 m2 for men. Proteinuria was assessed by semiquantitative dipstick urinalysis and defined as absent if results were 0 to trace and present if ≥1+. Hemoglobinuria was defined as dipstick urinalysis with blood ≥1+ but with <5 red blood cells per high power field by microscopy.
Statistical analysis
Continuous variables of interest were summarized by median and interquartile ranges (IQRs), and categorical variables by counts and percentages. Logistic regression analyses were performed to evaluate variables associated with hyperfiltration at baseline. Variables associated with the outcomes of interest, estimated using either CKD-EPI–2009 or CKD-EPI–2021, that had P < 0.3 in individual analyses, did not have an excess of missing data (<20%), and were deemed to be of particular relevance were included in the initial multivariable models. Backward elimination procedure was employed to screen the variables associated with baseline hyperfiltration. Both individual and multivariable analyses were adjusted for baseline age, sex, and cohort effects.
Age was used as the time scale for the decline of hyperfiltration to normal range analysis. This time scale was chosen to account for age-related differential risk for decline in eGFR to normal because older patients would be expected to have lower eGFR related to aging and be more likely to reach a normal range in the observation period. Because age was used as the time scale, the data were left truncated. All analyses accounted for left truncation by specifying the at-risk period for each patient. For those patients with hyperfiltration at baseline, the estimated survival function for age at the decline of hyperfiltration to the normal range was obtained by the nonparametric maximum likelihood method via the EM-ICM (Expectation and Maximization–Iterative Convex Minorant) algorithm.14 The median age at eGFR decline to the normal range was obtained based on the estimated survival function. Cox regression analyses for interval-censored time-to-event data were adopted to evaluate variables associated with eGFR decline to the normal range, adjusted for sex and cohort. The Cox model was assumed to have a piecewise constant baseline hazard function and was estimated by the maximum likelihood method via the Newton-Raphson optimization algorithm.15 Variables included in the initial model were selected as above, with the final model also determined by backward elimination. All analyses were conducted using SAS OnDemand for Academics (SAS Institute Inc., Cary, NC).
Results
Baseline demographics, laboratory, and clinical variables
The median eGFR value obtained using CKD-EPI–2009, without adjustment for the Black race, was similar to that obtained using CKD-EPI–2021 (114.2 mL/min per 1.73 m2 [IQR, 82.5-132.1] vs 116.5 mL/min per 1.73 m2 [IQR, 85.9-131.6]), with a modest increase in the standard deviation with CKD-EPI–2009 as shown in Figure 1.
![Histogram comparing estimated glomerular filtration rates obtained by CKD-EPI–2009 and CKD-EPI–2021 equations in patients with sickle cell anemia. Green bars show eGFR using CKD-EPI–2009, while pink bars show eGFR using CKD-EPI–2021 (gray areas indicate overlap). The green and red curves are the density curves for the corresponding histograms. The mean (105.6 ± 35.4 mL/min per 1.73 m2 vs 106.4 ± 33.5 mL/min per 1.73 m2) and median (114.2 mL/min per 1.73 m2 [IQR, 82.5-132.1] vs 116.5 mL/min per 1.73 m2 [IQR, 85.9-131.6]) eGFR values obtained using CKD-EPI–2009, without adjustment for Black race, are very similar to those obtained using CKD-EPI–2021.](https://ash.silverchair-cdn.com/ash/content_public/journal/bloodadvances/6/15/10.1182_bloodadvances.2022007693/2/m_advancesadv2022007693f1.png?Expires=1765938307&Signature=qM78a7rSl7poD7TvBBLm-zZqlPQq8K4taCI7LcOYGyABsjEkKUgOzct-03op~btE55alD9k6EMPLY7A3kh0ryO6i5GDunEn9CTJZIUNPQkXKP8L8LMW6-FDiD8nU0n~O3M1zLi-k7YWPdnee6Qp~6aN8DyHvOr1DCHQ83NkZSr7h~Mu0JWsd2g4OyrbIKO2OOLWLW~OhMrg0UeElsZvjxklCcBVL7sC~A4YNXikMA0RBEJS-qoF7L2jpSm9kb7Tss2d8IP5B~djPvRTCL7TN09IzWUDrbnMT3mcVtaiAijfzI0ldN4GVCK9QzIzdyn2AzVF~T8WXGBIpgIywrWjiFQ__&Key-Pair-Id=APKAIE5G5CRDK6RD3PGA)
Histogram comparing estimated glomerular filtration rates obtained by CKD-EPI–2009 and CKD-EPI–2021 equations in patients with sickle cell anemia. Green bars show eGFR using CKD-EPI–2009, while pink bars show eGFR using CKD-EPI–2021 (gray areas indicate overlap). The green and red curves are the density curves for the corresponding histograms. The mean (105.6 ± 35.4 mL/min per 1.73 m2 vs 106.4 ± 33.5 mL/min per 1.73 m2) and median (114.2 mL/min per 1.73 m2 [IQR, 82.5-132.1] vs 116.5 mL/min per 1.73 m2 [IQR, 85.9-131.6]) eGFR values obtained using CKD-EPI–2009, without adjustment for Black race, are very similar to those obtained using CKD-EPI–2021.
Histogram comparing estimated glomerular filtration rates obtained by CKD-EPI–2009 and CKD-EPI–2021 equations in patients with sickle cell anemia. Green bars show eGFR using CKD-EPI–2009, while pink bars show eGFR using CKD-EPI–2021 (gray areas indicate overlap). The green and red curves are the density curves for the corresponding histograms. The mean (105.6 ± 35.4 mL/min per 1.73 m2 vs 106.4 ± 33.5 mL/min per 1.73 m2) and median (114.2 mL/min per 1.73 m2 [IQR, 82.5-132.1] vs 116.5 mL/min per 1.73 m2 [IQR, 85.9-131.6]) eGFR values obtained using CKD-EPI–2009, without adjustment for Black race, are very similar to those obtained using CKD-EPI–2021.
Of 610 patients with sickle cell anemia and ≥2 available measures of serum creatinine, 506 had eGFR ≥90 mL/min per 1.73 m2 at baseline using CKD-EPI–2009, with 199 from UNC, 171 from Duke, 65 from UIC, and 71 from Methodist. The median baseline age of eligible patients in the pooled analysis was 24 years (range, 18-57; IQR, 19-34), and 268 (53.0%) were female (Table 1). The patients had a median of 3 (IQR, 2-9) eGFR measurements, with a median of 5.14 years (IQR, 1.53-7.53) of follow-up and 2602.3 total patient-years of observation for those included. Baseline demographic, laboratory, and clinical data in the individual patient cohorts are shown in supplemental Tables 1 and 2. The Methodist cohort was younger (median age, 18 years [IQR, 18-18]) than the UNC cohort (26 years [IQR, 20-34]), Duke cohort (25 years [IQR, 20-35]), and UIC cohort (29.4 years [IQR, 23.6-39.5]).
Baseline demographics, clinical and laboratory variables of patients with sickle cell anemia in the pooled cohorts
| Variables | CKD-EPI–2009 | CKD-EPI–2021 | ||
|---|---|---|---|---|
| n | Median (IQR) or n (%) | n | Median (IQR) or n (%) | |
| Age, y | 506 | 24 (19-34) | 516 | 25.0 (19.0-34.0) |
| Sex (female) | 506 | 268 (52.96) | 516 | 273 (52.91) |
| Weight, kg | 465 | 64.9 (57.5-73.9) | 475 | 65.0 (57.5-74.2) |
| Height, cm | 212 | 169.1 (163.15-175.75) | 218 | 169.1 (163.3-175.7) |
| Body mass index, kg/m2 | 206 | 21.9 (20.2-24.4) | 212 | 22.0 (20.2-24.8) |
| Systolic blood pressure, mm Hg | 478 | 117 (109-126) | 488 | 117 (109-126) |
| Diastolic blood pressure, mm Hg | 478 | 68 (60-74) | 488 | 68 (60-74) |
| White blood cell count, 109/L | 468 | 10.6 (8.0-13.1) | 478 | 10.6 (7.93-13.1) |
| Hemoglobin, g/dL | 468 | 9.1 (8.02-10.07) | 478 | 9.0 (8.0-10.0) |
| Hematocrit, % | 466 | 26.37 (23.3-29.2) | 476 | 26.33 (23.25-29.1) |
| Reticulocyte count, 109/L | 372 | 268.23 (187.33-380.35) | 382 | 267.4 (186.67-380.2) |
| eGFR, mL/min per 1.73 m2 | 506 | 129.3 (118.4-137.6) | 516 | 129.1 (117.4-137.4) |
| Blood urea nitrogen, mg/dL | 255 | 7.0 (5.0-9.0) | 264 | 7.0 (5.0-9.0) |
| Lactate dehydrogenase, U/L | 400 | 721.0 (417.5-1084.5) | 409 | 717 (416-1066) |
| Total bilirubin, mg/dL | 440 | 2.60 (1.60-4.20) | 450 | 2.55 (1.60-4.20) |
| Indirect bilirubin, mg/dL | 177 | 2.30 (1.60-3.71) | 183 | 2.30 (1.60-3.71) |
| Direct bilirubin, mg/dL | 176 | 0.30 (0.20-0.45) | 182 | 0.30 (0.20-0.50) |
| Ferritin, µg/L | 265 | 487.0 (146.0-1258.0) | 272 | 474.5 (139.5-1267.0) |
| Fetal hemoglobin, % | 309 | 7.80 (3.90-14.20) | 318 | 7.70 (3.90-14.1) |
| Urine specific gravity | 106 | 1.01 (1.01-1.01) | 107 | 1.01 (1.01-1.01) |
| Proteinuria (yes) | 259 | 48 (18.5) | 262 | 49 (18.7) |
| Hemoglobinuria (yes) | 295 | 42 (14.2) | 303 | 45 (14.9) |
| History of acute chest syndrome | 476 | 360 (75.6) | 485 | 366 (75.5) |
| History of stroke | 465 | 86 (18.5) | 474 | 88 (18.6) |
| History of leg ulcers | 445 | 55 (12.4) | 455 | 60 (13.2) |
| History of avascular necrosis | 342 | 118 (34.5) | 352 | 125 (35.5) |
| History of priapism | 170 | 69 (40.6) | 174 | 70 (40.2) |
| History of diabetes | 462 | 6 (1.3) | 472 | 7 (1.5) |
| Chronic RBC transfusion | 480 | 50 (10.4) | 490 | 50 (10.2) |
| Hydroxyurea therapy | 504 | 272 (54.0) | 514 | 277 (53.9) |
| ACE-I/ARB therapy | 263 | 17 (6.5) | 272 | 19 (7.0) |
The number of evaluated patients for both equations differs due to different numbers of eligible patients based on eGFR.
ACE-I, angiotensin-converting enzyme inhibitor; ARB, angiotensin receptor blocker; CKD-EPI-2009, Chronic Kidney Disease Epidemiology Collaboration formula for estimated glomerular filtration rate (omitting adjustment for the Black race), utilizing serum creatinine; CKD-EPI-2021, Chronic Kidney Disease Epidemiology Collaboration formula for estimated glomerular filtration rate, utilizing serum creatinine.
Hyperfiltration was observed in 194 of 506 patients (38.3%) at baseline, with a higher prevalence of hyperfiltration in the Methodist cohort (57 of 71 [80.3%]) compared with the UNC cohort (68 of 199 [34.2%]), Duke cohort (55 of 171 [32.2%]), and UIC cohort (14 of 65 [21.5%]). As expected, the prevalence of hyperfiltration was age-dependent, with a prevalence of 72.9% in the 18- to 20-year group, 36.5% in the 21- to 30-year group, 3.3% in the 31- to 40-year group, and 0% in both the 41- to 50-year and >50-year groups (Figure 2A). The prevalence of hyperfiltration with the use of CKD-EPI–2021 was similarly age-dependent, with 516 patients meeting the inclusion of baseline eGFR ≥90 mL/min per 1.73 m2. The median follow-up for these patients was 5.20 years (IQR, 1.53-7.51) with 2664.7 total patient-years of observation. Of the evaluated patients, hyperfiltration was present in 188 (36.4%) patients, with a prevalence of 71.2% in the 18- to 20-year group, 34.7% in the 21- to 30-year group, 3.2% in the 31- to 40-year group, and 0% in both the 41- to 50-year and >50-year groups (Figure 2B).
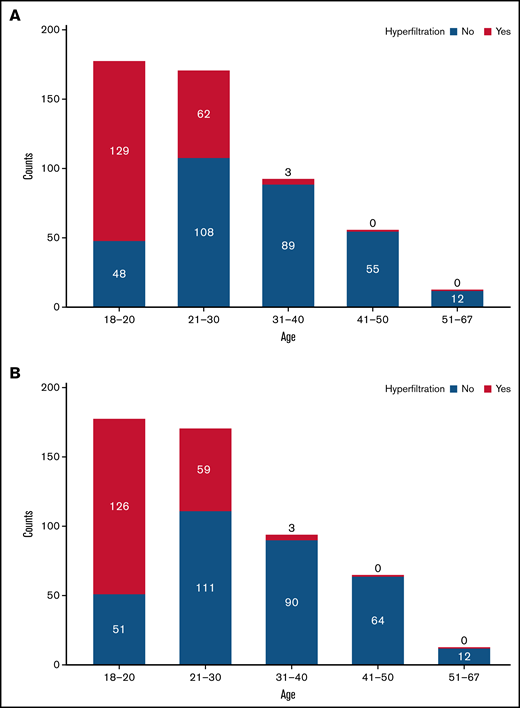
Occurrence of glomerular hyperfiltration in sickle cell anemia by age group. Hyperfiltration is age-dependent, being most prevalent in the 18- to 20-year group. Hyperfiltration is uncommon after the age of 30 years. (A) Hyperfiltration by age using CKD-EPI-2009 with adjustment for race. (B) Hyperfiltration by age using CKD-EPI-2021.
Occurrence of glomerular hyperfiltration in sickle cell anemia by age group. Hyperfiltration is age-dependent, being most prevalent in the 18- to 20-year group. Hyperfiltration is uncommon after the age of 30 years. (A) Hyperfiltration by age using CKD-EPI-2009 with adjustment for race. (B) Hyperfiltration by age using CKD-EPI-2021.
Baseline hyperfiltration
In patients with sickle cell anemia, adjusted for cohort effect, older individuals (odds ratio [OR], 0.79; 95% confidence interval [CI], 0.75-0.84; P < .0001) and males (OR, 0.53; 95% CI, 0.36-0.79; P = .002) were less likely to have hyperfiltration at baseline. After adjusting for baseline age, sex, and main cohort effect, hyperfiltration was significantly less likely with higher hematocrit (OR, 0.93; 95% CI, 0.87-0.99; P = .02), higher weight (OR, 0.96; 95% CI, 0.94-0.98; P = .001), and higher blood urea nitrogen concentration (OR, 0.75; 95% CI, 0.64-0.87; P = .0002) when GFR was estimated with CKD-EPI–2009 (Table 2). Using CKD-EPI–2021 to estimate GFR, adjusted for cohort effect, baseline hyperfiltration was significantly less likely to occur with increasing age (OR, 0.79; 95% CI, 0.74-0.83; P < .0001) and in males compared with females (OR, 0.45; 95% CI, 0.30-0.67; P < .0001). After adjusting for baseline age, sex, and main cohort effect, hyperfiltration was significantly less likely with higher concentrations of blood urea nitrogen (OR, 0.76; 95% CI, 0.65-0.88; P = .0004) and higher weight (OR, 0.96; 95% CI, 0.94-0.98; P = .0006) (Table 2).
Association of baseline laboratory and clinical variables with hyperfiltration
| Variables | CKD-EPI–2009 | CKD-EPI–2021 | ||
|---|---|---|---|---|
| OR (95% CI) | P value | OR (95% CI) | P value | |
| Age | 0.79 (0.75-0.84) | <.0001 | 0.79 (0.74-0.83) | <.0001 |
| Male sex | 0.53 (0.36-0.79) | .002 | 0.45 (0.30-0.67) | <.0001 |
| White blood cell count | 1.01 (0.95-1.07) | .86 | 1.0 (0.94-1.06) | .96 |
| Hemoglobin | 0.84 (0.70-1.01) | .06 | 0.90 (0.75-1.09) | .29 |
| Hematocrit | 0.93 (0.87-0.99) | .02 | 0.95 (0.89-1.01) | .08 |
| Platelet count | 1.0 (1.0-1.001) | .78 | 1.0 (1.0-1.001) | .81 |
| Reticulocyte count | 1.002 (1.0-1.004) | .15 | 1.002 (1.0-1.004) | .18 |
| Hemoglobin F | 0.98 (0.94-1.02) | .24 | 0.98 (0.94-1.02) | .31 |
| Blood urea nitrogen | 0.75 (0.64-0.87) | .0002 | 0.76 (0.65-0.88) | .0004 |
| Ferritin (per 100 units) | 1.0 (0.97-1.02) | .63 | 0.99 (0.97-1.02) | .54 |
| Total bilirubin | 1.001 (0.91-1.10) | .98 | 1.02 (0.93-1.12) | .69 |
| Direct bilirubin | 0.81 (0.30-2.20) | .68 | 0.81 (0.30-2.16) | .67 |
| Indirect bilirubin | 0.94 (0.80-1.10) | .42 | 0.95 (0.82-1.11) | .53 |
| Hemoglobinuria | 1.14 (0.43-3.02) | .79 | 1.15 (0.42-3.11) | .79 |
| Proteinuria | 1.25 (0.51-2.08) | .62 | 1.38 (0.54-3.51) | .50 |
| Systolic blood pressure | 0.99 (0.97-1.01) | .17 | 0.99 (0.97-1.01) | .35 |
| Diastolic blood pressure | 0.99 (0.97-1.01) | .31 | 0.99 (0.97-1.02) | .54 |
| Weight | 0.96 (0.94-0.98) | .0001 | 0.96 (0.94-0.98) | .0006 |
| Height | 0.97 (0.92-1.02) | .17 | 0.97 (0.92-1.02) | .19 |
| History of diabetes | 0.42 (0.02-9.05) | .58 | 0.39 (0.02-9.88) | .57 |
| History of stroke | 0.96 (0.51-1.79) | .89 | 0.95 (0.50-1.80) | .88 |
| History of acute chest syndrome | 0.69 (0.38-1.26) | .23 | 0.73 (0.40-1.35) | .32 |
| History of avascular necrosis | 1.70 (0.80-3.60) | .17 | 1.84 (0.84-4.04) | .13 |
| History of leg ulcers | 0.83 (0.28-2.49) | .75 | 0.47 (0.13-1.63) | .23 |
| ACE-I/ARB therapy | 0.37 (0.07-2.03) | .25 | 0.38 (0.07-2.17) | .28 |
| Hydroxyurea therapy | 0.78 (0.46-1.31) | .35 | 0.75 (0.44-1.28) | .29 |
| Chronic RBC transfusion | 0.72 (0.32-1.60) | .42 | 0.98 (0.44-2.21) | .96 |
For continuous variables, ORs are for a 1-unit change.
All variables (except age and sex) were adjusted for age, sex, and cohort. Age and sex were adjusted for the cohort effect.
ACE-I, angiotensin-converting enzyme inhibitor; ARB, angiotensin receptor blocker; CKD-EPI-2009, Chronic Kidney Disease Epidemiology Collaboration formula for estimated glomerular filtration rate (omitting adjustment for the Black race), utilizing serum creatinine; CKD-EPI-2021, Chronic Kidney Disease Epidemiology Collaboration formula for estimated glomerular filtration rate, utilizing serum creatinine; RBC, red blood cell.
Age at estimated glomerular filtration rate decline to normal range
Eighty-one of 194 (41.8%) patients with sickle cell anemia and baseline hyperfiltration had eGFR declines to normal values at a median age of 26.2 years (IQR, 22.8-30.8; 95% CI, 25.1-30.4). Using CKD-EPI–2009, decline of eGFR to normal range was significantly more likely in males compared with females (HR, 2.10; 95% CI, 1.32-3.35; P = .002) following adjustment for cohort effect. After adjusting for sex and main cohort effect, decline of eGFR to normal range was significantly more likely with higher ferritin concentrations (HR, 1.02; 95% CI, 1.002-1.05; P = .04) and higher systolic blood pressure (HR, 1.02; 95% CI, 1.003-1.03; P = .02), and significantly less likely with higher baseline eGFR (HR, 0.97; 95% CI, 0.94-0.99; P = .03), hemoglobinuria (HR, 0.31; 95% CI, 0.10-0.98; P = .05), and proteinuria (HR, 0.33; 95% CI, 0.11-0.98; P = .05) (Table 3). Using CKD-EPI–2021, decline in eGFR to normal range was significantly more likely in male patients (HR, 2.71; 95% CI, 1.74-4.24; P < .0001) following adjustment for cohort effect. After adjusting for sex and main cohort effect, decline of eGFR to normal range was significantly less likely with higher baseline eGFR (HR, 0.94; 95% CI, 0.92-0.95; P < .0001).
Association of baseline laboratory and clinical variables with eGFR decline to normal range using age as the timescale
| Variables | CKD-EPI–2009 | CKD-EPI–2021 | ||
|---|---|---|---|---|
| HR (95% CI) | P value | HR (95% CI) | P value | |
| Male sex | 2.10 (1.32-3.35) | .002 | 2.71 (1.74-4.24) | <.0001 |
| White blood cell count | 1.002 (0.94-1.07) | .96 | 1.0 (0.94-1.05) | .85 |
| Hemoglobin | 1.15 (0.94-1.39) | .18 | 1.07 (0.88-1.29) | .52 |
| Hematocrit | 1.01 (0.95-1.08) | .72 | 1.0 (0.93-1.07) | .92 |
| Platelet count | 1.0 (1.0-1.001) | .31 | 1.0 (1.0-1.001) | .43 |
| Reticulocyte count | 1.0 (1.0-1.001) | .31 | 1.0 (1.0-1.001) | .20 |
| Hemoglobin F | 1.002 (0.95-1.05) | .94 | 0.98 (0.93-1.03) | .35 |
| Blood urea nitrogen | 1.03 (0.90-1.17) | .71 | 1.06 (0.93-1.20) | .42 |
| eGFR | 0.97 (0.94-0.99) | .03 | 0.94 (0.92-0.95) | <.0001 |
| Ferritin (per 100 units) | 1.02 (1.002-1.05) | .04 | 1.02 (1.0-1.05) | .06 |
| Total bilirubin | 0.95 (0.86-1.06) | .38 | 0.97 (0.88-1.07) | .55 |
| Direct bilirubin | 1.91 (0.47-7.80) | .37 | 2.05 (0.50-8.33) | .32 |
| Indirect bilirubin | 1.02 (0.82-1.27) | .86 | 1.02 (0.82-1.26) | .89 |
| Hemoglobinuria | 0.31 (0.10-0.98) | .05 | 0.44 (0.16-1.23) | .12 |
| Proteinuria | 0.33 (0.11-0.98) | .05 | 0.43 (0.17-1.08) | .07 |
| Systolic blood pressure | 1.02 (1.003-1.03) | .02 | 1.01 (1.0-1.03) | .054 |
| Diastolic blood pressure | 1.01 (1.0-1.03) | .14 | 1.01 (0.99-1.03) | .39 |
| Weight | 1.01 (0.99-1.03) | .37 | 1.01 (0.99-1.03) | .34 |
| Height | 0.99 (0.94-1.03) | .55 | 0.99 (0.95-1.03) | .63 |
| Body mass index | 0.90 (0.63-1.29) | .57 | 0.93 (0.62-1.39) | .72 |
| History of diabetes | 6.0 (0.78-45.99) | .09 | 6.50 (0.85-49.93) | .07 |
| History of stroke | 0.84 (0.45-1.57) | .59 | 0.85 (0.47-1.54) | .58 |
| History of acute chest syndrome | 0.68 (0.39-1.17) | .17 | 1.03 (0.60-1.75) | .92 |
| History of avascular necrosis | 0.67 (0.34-1.30) | .24 | 0.61 (0.31-1.19) | .15 |
| History of leg ulcers | 1.78 (0.72-4.42) | .21 | 1.91 (0.67-5.48) | .23 |
| ACE-I/ARB therapy | 1.15 (0.15-8.86) | .89 | 1.33 (0.17-10.21) | .78 |
| Hydroxyurea therapy | 1.44 (0.91-2.29) | .12 | 1.27 (0.81-2.01) | .30 |
| Chronic RBC transfusion | 0.71 (0.28-1.82) | .48 | 1.65 (0.85-3.21) | .14 |
All variables (except sex) were adjusted for sex and cohort effect. Sex was adjusted for the cohort effect.
ACE-I, angiotensin-converting enzyme inhibitor; ARB, angiotensin receptor blocker; CKD-EPI-2009, Chronic Kidney Disease Epidemiology Collaboration formula for estimated glomerular filtration rate (omitting adjustment for the Black race), utilizing serum creatinine; CKD-EPI-2021, Chronic Kidney Disease Epidemiology Collaboration formula for estimated glomerular filtration rate, utilizing serum creatinine; RBC, red blood cell.
Multivariable analyses
Multivariable analyses and backward variable selection were conducted to identify baseline laboratory and clinical variables associated with hyperfiltration while accounting for potential confounders. Based on the results for individual effects shown in Table 2, the variables that entered the initial model for backward selection included hemoglobin, systolic blood pressure, weight, history of leg ulcers, history of acute chest syndrome, and hydroxyurea therapy. Using CKD-EPI–2009, the final multivariable model indicated that hyperfiltration was significantly less likely with older age (OR, 0.78; 95% CI, 0.73-0.83; P < .0001), male sex (OR, 0.32; 95% CI, 0.18-0.58; P = .0002), and higher weight (OR, 0.96; 95% CI, 0.94-0.99; P = .001) (Table 4). Similarly, using CKD-EPI–2021, hyperfiltration was significantly less likely with older age (OR, 0.75; 95% CI, 0.70-0.81; P < .0001), male sex (OR, 0.24; 95% CI, 0.13-0.44; P < .0001), and higher weight (OR, 0.97; 95% CI, 0.95-0.99; P = .004).
Multivariable analysis of covariates associated with hyperfiltration and age at eGFR decline to normal range in pooled cohorts with sickle cell anemia
| Variables | Hyperfiltration | Decline in eGFR to Normal Range | ||||||
|---|---|---|---|---|---|---|---|---|
| CKD-EPI–2009 | CKD-EPI–2021 | CKD-EPI–2009 | CKD-EPI–2021 | |||||
| OR (95% CI) | P value | OR (95% CI) | P value | OR (95% CI) | P value | OR (95% CI) | P value | |
| Age | 0.78 (0.73-0.83) | <.0001 | 0.75 (0.70-0.81) | <.0001 | — | — | — | — |
| Male | 0.32 (0.18-0.58) | .0002 | 0.24 (0.13-0.44) | <.0001 | 2.20 (1.26-3.87) | .006 | 3.39 (2.01-5.69) | <.0001 |
| Weight | 0.96 (0.94-0.99) | .001 | 0.97 (0.95-0.99) | .004 | — | — | — | — |
| Systolic blood pressure | — | — | — | — | 1.02 (1.01-1.04) | .01 | — | — |
| Use of hydroxyurea | — | — | — | — | 1.74 (1.002-3.03) | .05 | — | — |
Multivariable analyses and backward selection were also conducted to investigate the association of baseline laboratory and clinical variables with eGFR decline to the normal range using age as the timescale. For this analysis, the variables that entered the initial model included hemoglobin, history of acute chest syndrome, hydroxyurea therapy, history of leg ulcers, chronic red blood cell transfusion, systolic blood pressure, diabetes, and eGFR. Using CKD-EPI–2009, decline of eGFR to normal range was significantly more likely with male sex (HR, 2.20; 95% CI, 1.26-3.87; P = .006), increasing systolic blood pressure (HR, 1.02; 95% CI, 1.01-1.04; P = .01), and use of hydroxyurea (HR, 1.74; 95% CI, 1.002-3.03; P = .05). Using CKD-EPI–2021, the decline of eGFR to the normal range was more likely with male sex (HR, 3.39; 95% CI, 2.01-5.69; P < .0001).
Discussion
In this pooled analysis, we confirm the high prevalence of hyperfiltration in young adults with sickle cell anemia, although the observed prevalence is expectedly lower than that seen when using creatinine-based CKD-EPI equations that adjust for the Black race.7 We also confirm the age dependence of hyperfiltration and show that it is uncommon after the age of 30. Individuals with SCD have supranormal renal hemodynamics characterized by elevated effective renal plasma flow (ERPF) and GFR. The pathophysiological factors that alter GFR and ERPF appear to result from aberrant glomerular autoregulation that affects both afferent and efferent arteriolar tone.16 Medullary ischemia drives localized prostaglandin release and subsequent vasodilation, resulting in increased renal blood flow and GFR.17 However, both GFR and ERPF decline toward normal levels during adolescence and continue to decrease as patients age.18-20
The discrepancy we observed in the prevalence of hyperfiltration compared with prior studies calculating eGFR with adjustment for race highlights the importance of developing more accurate equations to estimate GFR in individuals with SCD.4,21-23 In studies comparing various creatinine-based equations with GFR measured by 99mTc-DTPA nuclear renal scan in adults, CKD-EPI–2009 equation estimates were the closest to measured GFR but still had a bias of 41.2 mL/min per 1.73 m2.8 This bias is reportedly substantially improved when adjustment for race was removed.9 Although the cystatin C-based CKD-EPI–2009 formula results in better agreement with measured GFR than both the creatinine-based CKD-EPI–2009 formula and the CKD-EPI–2009 formula using cystatin C and creatinine,24-26 cystatin C testing is neither readily nor widely available in many institutions.
This study extends the finding that adult male patients with sickle cell anemia have lower odds of hyperfiltration. As we have suggested previously,7 this may reflect a difference in the trajectory of eGFR change in males compared with females. Indeed, male patients with SCD have a faster decline in eGFR compared with female patients.4,12,27 Studies in sickle mice show that glomerular hyperfiltration occurred earlier in males than in females and preceded progressive GFR decline.28 However, eGFR assessed by cystatin C was not significantly different between sexes in younger children, but by age 13, male patients began to demonstrate significantly lower eGFR than females.29 Consistent with this, we observed that male sex was associated with significantly greater hazards of eGFR decline to the normal range in this pooled analysis.
As in our previous study,7 higher weight was significantly associated with lower odds of hyperfiltration. Body mass index was not available for the vast majority of patients in this pooled analysis, being available in only 206 patients following the use of CKD-EPI–2009; the median body mass index at baseline was 21.9 (IQR, 20.2-24.4), suggesting that most of these patients had normal weights. Multiple studies examining renal physiological parameters before and after bariatric surgery in non-SCD patients show a close association between obesity and glomerular hyperfiltration.30,31 In another study of 19 obese patients, 5 of whom had diabetes, substantial weight loss was associated with a reduction in measured GFR, although it was unchanged when adjusted for body surface area.32 Furthermore, eGFR based on creatinine-based equations, but not cystatin C-based estimates, overestimated renal function in these patients,32 possibly due to changes in muscle mass. Studies using measured GFR and cystatin C-based equations may be valuable to confirm the association of weight with hyperfiltration in patients with sickle cell anemia.
Consistent with findings on the association of hypertension with CKD in the general population33,34 and the association of blood pressure with lower eGFR and CKD in SCD,35-38 increasing systolic blood pressure was associated with a decline in eGFR to normal range in this pooled cohort. Although hypertension has historically been reported to be uncommon in SCD patients,39 more recent studies suggest that it is more common than previously thought.40,41 It is uncertain whether the observed association of increasing systolic blood pressure with a decline of eGFR to a normal range in this analysis is a consequence of hypertension. More studies are required to better define the relationship between systolic blood pressure and the decline of eGFR to the normal range in patients with sickle cell anemia.
A decline of eGFR to the normal range was observed in >41% of patients, with a median age of 26 years when eGFR reached the normal range. Particularly noteworthy, hyperfiltration was much less common after the age of 30 in patients in this pooled analysis, suggesting that most patients with initial hyperfiltration have normal eGFR values by the fourth decade of life. Use of hydroxyurea was associated with greater hazards of eGFR decline to the normal range in the pooled analysis. While somewhat intuitive based on the reported association of hyperfiltration with anemia,6 published data on the effect of hydroxyurea on hyperfiltration are conflicting. In the BABY HUG study, a randomized, double-blind, placebo-controlled study that evaluated the effects of hydroxyurea on organ damage in infants with HbSS or HbSβ0, no effect on measured GFR was observed following treatment with hydroxyurea for 24 months.42 However, data from the HUSTLE (Hydroxyurea Study of Long-Term Effects) study, an observational study of children with SCD treated with hydroxyurea for accepted clinical indications, showed that escalation of hydroxyurea to the maximum tolerated dose for 3 years resulted in a decrease in measured GFR from a hyperfiltration range to values closer to normal.43 Similar to our previous report,7 significant associations of hemoglobin with baseline hyperfiltration or a decline to normal eGFR range from hyperfiltration were not observed in multivariable analysis. The greater hazards of decline to normal eGFR range from hyperfiltration with hydroxyurea therapy may be related to the use of hydroxyurea in patients with more severe disease, who in turn may be at higher risk for eGFR decline. The clinical significance of declining eGFR to normal range from hyperfiltration remains uncertain. Although this may represent an improvement of hyperfiltration and a subsequent decreased risk of kidney injury, this finding may also represent a loss of kidney function. In particular, this difficulty in understanding the consequence of improvement from hyperfiltration makes estimating the influence of an intervention difficult with our study design. While hydroxyurea was associated with a decline from hyperfiltration to the normal range, angiotensin-converting enzyme inhibitor/angiotensin receptor blocker (ACE-I/ARB) use was not in this analysis. ACE-I/ARB therapy is indicated for the treatment of proteinuria in SCD and would presumptively improve hyperfiltration as noted in other disease states.44 We previously demonstrated that ACE-I/ARBs may slow the decline of eGFR in SCD patients with proteinuria.45 However, a recent study of 37 patients with HbSS and hyperfiltration, using measured as well as estimated GFR values, demonstrated no significant difference in GFR before and following treatment with an ACE inhibitor for 6 months.46 These data suggest that hyperfiltration in SCD may be largely due to increased renal blood flow rather than increased glomerular hydrostatic pressure. The true importance of decline from hyperfiltration to normal values can only be ascertained with the conduct of a longitudinal study starting in childhood with an accurate assessment of GFR.
Finally, although not a primary interest of our study, we found that median GFR values estimated using both CKD-EPI–2009 and CKD-EPI–2021 were similar. However, it is likely that the observed differences in factors associated with eGFR decline to the normal range may be due, in part, to the different number of patients eligible for analyses with each of these equations resulting from differences in eGFR calculated at baseline. These differences provide a reason for caution in confidence in the precision of eGFR derived from the CKD-EPI–2021 equation until it is specifically assessed in SCD patients, especially as current laboratories transition to this equation for their eGFR reporting. While we have assessed the CKD-EPI–2021 equation out of expected interest, any conclusions from these analyses should be reserved until this equation has been compared with measured GFR in SCD patients.
Our study is limited by its retrospective design. As patients were not followed from childhood, we are unable to truly evaluate the natural history and consequences of hyperfiltration in SCD. Despite the reduced bias of the creatinine-based CKD-EPI–2009 equation when adjustment for race is removed, our current definition of hyperfiltration based on this equation may still be inadequate. In adolescents and young adults, CKD-EPI–2009 may have some bias even in those without SCD.47 Whether this same age bias applies specifically to this population in SCD patients has not been assessed. Missing data for several clinically and biologically relevant variables of interest, including proteinuria, albumin–creatinine ratio, reliable data on transfusion volume, and chronic nonsteroidal antiinflammatory drug use, have limited our ability to fully assess associations with hyperfiltration or eGFR decline to normal range. In addition, lactate dehydrogenase could not be compared across sites due to differences in platforms used for this assay at each site, and other potential assessments of interest, including uric acid, ambulatory blood pressure, and nocturnal blood pressure “dipping,” were not available. Consistent assessments of albuminuria and proteinuria over time would also have been of interest but not available, possibly as the temporal span of the cohort (2002-2017) preceded the full adoption of the National Heart, Lung, and Blood Institute and American Society of Hematology guidelines.48,49
Conclusions
In summary, we confirm the high prevalence of glomerular hyperfiltration in adults with sickle cell anemia, although this is lower than reported with the use of GFR estimating equations that adjust for the Black race. Evaluation of the newly published CKD-EPI–2021 formula should be performed in SCD patients with concomitant measured GFR assessments. Its performance should be examined over the entire age range to ensure its performance in adolescents and young adults, in whom hyperfiltration is most likely to be observed in SCD patients. Longitudinal studies starting in childhood are necessary to better define the natural history of hyperfiltration in SCD and the role of hydroxyurea in GFR decline to the normal range.
Acknowledgments
US Food and Drug Administration grant FD006030 (K.I.A., J.C., and V.K.D.); National Institutes of Health (NIH) grants HL159376 (K.I.A., S.L.S., and V.K.D.), HL68959 and HL079915 (M.J.T. and A.E.A.-K.), and DK110104 (A.E.A.-K.); and the Doris Duke Charitable Foundation grants 2015131 and 2012126 (M.J.T. and A.E.A.-K.).
Authorship
Contribution: K.I.A. designed the study, analyzed the data, and wrote the manuscript; Q.Z. and J.C. analyzed the data and assisted in study design and manuscript preparation; E.J.C. and M.E.G. collected the data and assisted in the manuscript preparation; and S.L.S., J.S.H., L.R.L., A.E.A.-K., M.J.T., and V.K.D. assisted in study design and manuscript preparation.
Conflict-of-interest disclosure: K.I.A. has received research funding from Novartis, Forma Therapeutics, and Takeda Pharmaceuticals; served on advisory boards for Novartis, Novo Nordisk, Forma Therapeutics, and Agios Pharmaceuticals; served as a consultant for Roche. S.L.S. has received research funding from Novartis, Global Blood Therapeutics, and Pfizer; served in a consultant role for Global Blood Therapeutics; advisory board for Novartis and Forma Therapeutics. J.S.H. receives research funding from Global Blood Therapeutics; receives consultant fees from Global Blood Therapeutics and Forma Therapeutics. M.J.T. has served on steering committees and advisory committees for Pfizer, GlycoMimetics, Novartis, and Forma Therapeutics. V.K.D. has served on advisory boards for Novartis, Forma Therapeutics, Bayer, Merck, and Travere.
Correspondence: Kenneth I. Ataga, Center for Sickle Cell Disease, University of Tennessee Health Science Center at Memphis, 956 Court Ave, Suite D324, Memphis, TN 38163; e-mail: kataga@uthsc.edu.

