

Key Points
KMT2A-PTD undergo complex allelic events associated with advanced disease stage (AML over MDS), progression, and increased PTD expression.
KMT2A-PTD detection, quantification, and allelic characterization can be integrated into standard panel-based DNA sequencing tests.
Abstract
KMT2A partial tandem duplication (KMT2A-PTD) is an adverse risk factor in acute myeloid leukemia (AML) and myelodysplastic syndrome (MDS), a potential therapeutic target, and an attractive marker of measurable residual disease. High initial KMT2A-PTD RNA levels have been linked to poor prognosis, but mechanisms regulating KMT2A-PTD expression are not well understood. Although KMT2A-PTD has been reported to affect only a single allele, it has been theorized but not proven that genomic gains of a monoallelic KMT2A-PTD may occur, thereby potentially driving high expression and disease progression. In this study, we identified 94 patients with KMT2A-PTDs using targeted DNA next-generation sequencing (NGS) and found that 16% (15/94) had complex secondary events, including copy-neutral loss of heterozygosity and selective gain involving the KMT2A-PTD allele. High copy numbers indicating complexity were significantly enriched in AML vs MDS and correlated with higher RNA expression. Moreover, in serial samples, complexity was associated with relapse and secondary transformation. Taken together, we provide approaches to integrate quantitative and allelic assessment of KMT2A-PTDs into targeted DNA NGS and demonstrate that secondary genetic events occur in KMT2A-PTD by multiple mechanisms that may be linked to myeloid disease progression by driving increased expression from the affected allele.
Introduction
KMT2A partial tandem duplication (PTD) within chromosome band 11q23 has been reported in up to 10% of acute myeloid leukemia (AML) and myelodysplastic syndromes (MDS) and is associated with adverse risk.1,2 High KMT2A-PTD RNA levels, in particular, have been linked to poor prognosis, but genomic mechanisms that could regulate KMT2A-PTD expression are not understood.3 Incorporation of KMT2A-PTD into prognostic models and routine clinical practice, and direct investigation of DNA allelic status of KMT2A-PTD, has been limited by historical preference for RNA-based detection. Here, we develop approaches to integrate quantitative and allelic assessment of KMT2A-PTD into standard targeted DNA next-generation sequencing (NGS) panels, characterize allelic events in multi-institutional clinical data, and investigate the association between allelic status and disease stage.
Materials and methods
DNA extracted from blood, bone marrow, or extramedullary disease sites was tested by NGS panels: (1) Heme SnapShot (n = 3700 unselected clinical samples) using anchored multiplex PCR (ArcherDx), (2) Rapid Heme Panel (n = 5070 unselected clinical samples) using NEBNext Direct (New England BioLabs),4 or (3) myeloid-focused panel (n = 415 AML patients) using hybrid selection. Data were processed by default clinical pipelines followed by customized informatic analysis (details in supplemental Materials). The study was conducted in accordance with the Helsinki Declaration and with approval of the institutional review boards at Dana Farber Cancer Institute and Massachusetts General Brigham.
Results and discussion
Detection and quantification of KMT2A-PTD using DNA-based NGS panels
We introduced and validated a batch-based copy number method (BR-CNV) to detect and quantify KMT2A-PTD in unpaired tumor DNA NGS without pooled reference, followed by allelic analysis (Figure 1A; supplemental Figures 1 and 2). We further identified “split-reads” with chimeric alignments defining KMT2A-PTD breakpoints and derived variant allele fraction (VAF) estimates from both methods (supplemental Figure 3). The most common KMT2A-PTD pattern was diploid KMT2A baseline with low-level gain of PTD exons and balanced heterozygous single nucleotide polymorphisms (SNPs) over chromosome 11, consistent with involvement of 1 of 2 alleles (Figure 1B).5 We defined such samples with allelic balance (equal number of KMT2A-PTD and wild-type KMT2A alleles) as “simple” and samples with PTD allelic excess (more KMT2A-PTD copies than wild-type) as “complex”.
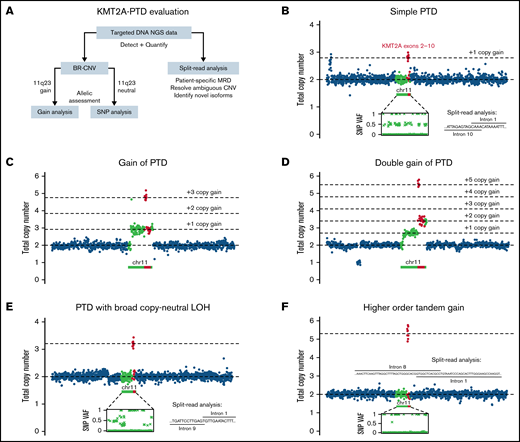
Patterns of KMT2A-PTD allelic states from targeted DNA NGS data. (A) Outline of strategy for detection, quantification, and allelic characterization of KMT2A-PTD. (B) Simple KMT2A-PTD cells harbor 1 wild-type allele (1 copy KMT2A) and 1 PTD allele (2 copies of PTD exons and 1 copy of other exons) by definition, for a net +1 copy gain of PTD exons relative to diploid baseline. In bulk NGS data, simple KMT2A-PTDs are thus characterized by copy-neutral 3′ KMT2A, shallow gain of PTD exons (proportional to percent cells involved, ranging up to +1 at 100% clonality), and balanced heterozygous SNPs along 11q. This example had a bulk average of 2.79 total copies of exons 2 to 10 (or +1 × 0.79 change from diploid), indicating a simple KMT2A-PTD involving 79% of cells. Split reads also confirmed the PTD. (C) Complex KMT2A-PTD cells with gain of 11q23.3 from the PTD allele harbor an extra PTD (thus 2 extra copies of PTD exons, 1 extra copy of other exons) relative to a simple KMT2A-PTD (+1 copy gain of PTD exons), or net +3 copy gain of PTD exons and +1 copy gain of other exons relative to diploid. This example (P1) was consistent with 11q23.3 gain from the PTD allele involving 92% of cells. The PTD was cytogenetically cryptic as usual; however, the regional gain was characterized by karyotype as the broad distal duplication dup(11)(q13q25) and quantified at a similar level of 87% cells by KMT2A FISH. (D) Complex KMT2A-PTD cells with double gain of 11q23.3 from the PTD allele harbor 2 extra PTDs (thus 4 extra copies of PTD exons, 2 extra copies of other exons) relative to a simple KMT2A-PTD or net +5 copy gain of PTD exons and +2 copy gain of other exons relative to diploid. This example (P2) had a TP53 mutation, complex karyotype, and stepwise copy number profile over 11q, suggesting breakage-fusion-bridge cycles. The findings were consistent with a KMT2A-PTD subject to 2 sequential distal 11q gain events from the PTD allele occurring in 70% of cells. (E) Complex KMT2A-PTD cells with CN-LOH have 0 wild-type alleles and 2 PTD alleles, for a net change of +2 copy gain of PTD exons. This example (P5) had a normal karyotype, no copy number changes over chromosome 11 except for bulk average +1.2 copy gain of KMT2A exons 2 to 9, and allelic imbalance of heterozygous SNPs spanning 11q targets, thus indicating KMT2A-PTD with broad 11q CN-LOH. By contrast, prior studies have reported only monoallelic involvement in cytogenetically normal cases.5 This example was predicted to be a mixture of simple and complex KMT2A-PTDs based on VAFs of heterozygous SNPs relative to copy gain level of PTD exons. (F) Gains of more than +2 copies of PTD exons in the setting of baseline diploid KMT2A could not be explained solely by CN-LOH of a simple KMT2A-PTD. This example (P8) demonstrated bulk average +3.55 copies of KMT2A exons 2 to 8, broad CN-LOH of 11q, and no other copy number changes. The gain was entirely attributable to a single PTD mutant junction connecting intron 8 to intron 1, because split-reads yielded a similar estimate of +3.28 copies. This magnitude of gain in the context of a single mutant junction raised the possibility of episomal amplification whereas CN-LOH favored localization to chromosome 11; thus, one possibility might be intrachromosomal amplification from episomal re-integration, which has been described at other genomic loci.12,13 VAFs, variant allele fractions.
Patterns of KMT2A-PTD allelic states from targeted DNA NGS data. (A) Outline of strategy for detection, quantification, and allelic characterization of KMT2A-PTD. (B) Simple KMT2A-PTD cells harbor 1 wild-type allele (1 copy KMT2A) and 1 PTD allele (2 copies of PTD exons and 1 copy of other exons) by definition, for a net +1 copy gain of PTD exons relative to diploid baseline. In bulk NGS data, simple KMT2A-PTDs are thus characterized by copy-neutral 3′ KMT2A, shallow gain of PTD exons (proportional to percent cells involved, ranging up to +1 at 100% clonality), and balanced heterozygous SNPs along 11q. This example had a bulk average of 2.79 total copies of exons 2 to 10 (or +1 × 0.79 change from diploid), indicating a simple KMT2A-PTD involving 79% of cells. Split reads also confirmed the PTD. (C) Complex KMT2A-PTD cells with gain of 11q23.3 from the PTD allele harbor an extra PTD (thus 2 extra copies of PTD exons, 1 extra copy of other exons) relative to a simple KMT2A-PTD (+1 copy gain of PTD exons), or net +3 copy gain of PTD exons and +1 copy gain of other exons relative to diploid. This example (P1) was consistent with 11q23.3 gain from the PTD allele involving 92% of cells. The PTD was cytogenetically cryptic as usual; however, the regional gain was characterized by karyotype as the broad distal duplication dup(11)(q13q25) and quantified at a similar level of 87% cells by KMT2A FISH. (D) Complex KMT2A-PTD cells with double gain of 11q23.3 from the PTD allele harbor 2 extra PTDs (thus 4 extra copies of PTD exons, 2 extra copies of other exons) relative to a simple KMT2A-PTD or net +5 copy gain of PTD exons and +2 copy gain of other exons relative to diploid. This example (P2) had a TP53 mutation, complex karyotype, and stepwise copy number profile over 11q, suggesting breakage-fusion-bridge cycles. The findings were consistent with a KMT2A-PTD subject to 2 sequential distal 11q gain events from the PTD allele occurring in 70% of cells. (E) Complex KMT2A-PTD cells with CN-LOH have 0 wild-type alleles and 2 PTD alleles, for a net change of +2 copy gain of PTD exons. This example (P5) had a normal karyotype, no copy number changes over chromosome 11 except for bulk average +1.2 copy gain of KMT2A exons 2 to 9, and allelic imbalance of heterozygous SNPs spanning 11q targets, thus indicating KMT2A-PTD with broad 11q CN-LOH. By contrast, prior studies have reported only monoallelic involvement in cytogenetically normal cases.5 This example was predicted to be a mixture of simple and complex KMT2A-PTDs based on VAFs of heterozygous SNPs relative to copy gain level of PTD exons. (F) Gains of more than +2 copies of PTD exons in the setting of baseline diploid KMT2A could not be explained solely by CN-LOH of a simple KMT2A-PTD. This example (P8) demonstrated bulk average +3.55 copies of KMT2A exons 2 to 8, broad CN-LOH of 11q, and no other copy number changes. The gain was entirely attributable to a single PTD mutant junction connecting intron 8 to intron 1, because split-reads yielded a similar estimate of +3.28 copies. This magnitude of gain in the context of a single mutant junction raised the possibility of episomal amplification whereas CN-LOH favored localization to chromosome 11; thus, one possibility might be intrachromosomal amplification from episomal re-integration, which has been described at other genomic loci.12,13 VAFs, variant allele fractions.
We used split-read analysis to confirm copy number–based detection and resolve rare ambiguous signals (supplemental Figure 4), thereby selectively improving limit of detection. Split-read analysis identified 25 unique breakpoint pairs from 26 of 94 (28%) patients with KMT2A-PTD, including novel and atypical isoforms (supplemental Figures 5 and 6), and could be improved by enhanced targeting of affected introns.6 Integration of split-read analysis into KMT2A-PTD assessment may be particularly useful as a basis for patient-specific measurable residual disease applications.
Using clinically validated RNA-based testing as a reference, our DNA-based NGS approach was 95% (19/20) sensitive and 100% (330/330) specific for detection of pathogenic KMT2A-PTD isoforms. We applied this approach to a sequential cohort of clinical samples (n = 8770) including well-annotated first-time diagnoses (n = 476) to define the frequency and clinical spectrum of KMT2A-PTD in an unselected cohort of patients with hematologic diagnoses. We found that KMT2A-PTD was present exclusively in MDS (10%) and AML (6%) and not in any other myeloid, lymphoid, or nonclonal hematologic diseases (supplemental Figure 7).
Increased relative abundance of KMT2A-PTD occurs via allele-specific CN-LOH or 11q23 gain
We hypothesized that relative abundance of KMT2A-PTD can be increased by selective gain of the PTD allele during disease progression. Therefore, we used BR-CNV to identify and resolve allelic status of 11q23 copy number events. We identified regional gain originating from the KMT2A-PTD allele in 4% (4/94) of patients (P1-P4, supplemental Figure 8), including cases with 2 KMT2A-PTD alleles and 1 wild-type KMT2A allele (Figure 1C) and a case with 3 KMT2A-PTD alleles and 1 wild-type allele (Figure 1D). We next used SNP analysis to identify 11q copy-neutral loss of heterozygosity (CN-LOH), demonstrating its occurrence in 12% (11/94) of patients with KMT2A-PTD (supplemental Figures 9 and 10). Most cases could be explained by CN-LOH of a simple PTD, yielding 2 KMT2A-PTD alleles and no wild-type KMT2A alleles (Figure 1E). However, rare cases demonstrated higher-order copy number magnitudes with correspondingly high split-read VAFs (Figure 1F), raising the possibility of intrachromosomal or episomal amplification of KMT2A-PTD exons. Consistent with established sensitivity of exome sequencing for CN-LOH detection, we detected broad 11q CN-LOH down to a clonal cell fraction of 30% (supplemental Figure 9A). Enhanced sensitivity for more focal CN-LOH would require inclusion of additional SNPs around KMT2A.7 In the AML cohort, KMT2A-PTDs accounted for 36% of all broad 11q CN-LOH events and were mutually exclusive with CBL mutations (45% of all 11q CN-LOH), indicating that KMT2A-PTD underlies the majority of previously unexplained 11q CN-LOH in AML.8
In some instances, we noted high KMT2A-PTD copy number levels without evident broad CN-LOH or 11q gain. To determine whether KMT2A-PTD could be subject to CN-LOH events encompassing focal genomic regions below the resolution of our targeted panels, we analyzed SNP array data from the relapsed AML cell line KASUMI6, which exhibits high-level gain of KMT2A exons 2 to 8.9 Consistent with presence of focal CN-LOH, we found 177 consecutive homozygous SNPs across ∼1.3 Mb spanning KMT2A, a pattern not observed in 2584 control samples (supplemental Figure 11). Together, our data indicate that complex allelic events occur by multiple mechanisms and augment KMT2A-PTD abundance relative to the wild-type allele.
KMT2A-PTD complexity is associated with disease progression/relapse and greater PTD RNA expression
To determine whether increased KMT2A-PTD allelic burden correlated with disease stage, we compared PTD copy ratios in AML and MDS. We found that KMT2A-PTD burden was higher in AML (mean, 1.64; n = 73) than MDS (mean, 1.40; n = 25) (P = .00006 by t test) (Figure 2A). Further, we observed that KMT2A-PTD ratios were unimodal in MDS (P = .843, dip test) and multimodal in AML (P = .027), where ratios clustered in 2 main groups compatible with simple and complex KMT2A-PTDs.10 High ratios implying complexity were more common in AML than MDS (45% [33/73] vs 12% [3/25]; P = .003) using a cutoff of 1.6 separating clonally simple (ratio, 1.5) from complex KMT2A-PTDs (1.67 for gain, 2 for CN-LOH). Greater DNA allelic burden was also associated with higher RNA expression (Pearson’s r = 0.79; supplemental Figure 12).

Emergence of KMT2A-PTD complexity during progression to AML and relapse. (A) Copy number ratios of KMT2A-PTDs at first available time points by diagnosis were unimodal in MDS (P = .843; dip test) and multimodal in AML (P = .027) with 2 main clusters presumed to correspond roughly to simple and complex KMT2A-PTDs. High ratios were accordingly enriched in AML (33/73; 45%) over MDS (3/25; 12%) (P = .003; Fisher’s exact test) relative to a cutoff (1.6) separating pure simple KMT2A-PTD cells (area shaded light blue) from complex (area shaded pink). Red: cases with secondary AML transformation from MDS (N = 7) or PV (N = 1). Box plots within violin plots: rectangles correspond to interquartile ranges, and whiskers have length equal to 1.5 times interquartile range or end at most extreme outliers. (B) 11q23.3 gain from the PTD allele emerged in a rapidly progressing AML that transformed from MDS with simple KMT2A-PTD (P3). Panels C and D show quantitative evolution of KMT2A-PTD complexity in 2 cases of AML (P3 and P4). Complex, simple, and wild-type components are determined from total copy number (TCN) of PTD exons (y-axis) vs TCN of distal 11q23 (x-axis): vertices of the triangle represent 100% populations of wild-type diploid KMT2A (green vertex), simple PTD (blue vertex), and complex PTD with single PTD gain (red vertex); because TCN is linear, line segments connecting 2 vertices represent mixtures of the 2 corresponding components, whereas the triangle (convex hull of the vertices) represents mixtures of all 3 (wild-type, simple PTD, and complex PTD). (C) 11q23.3 gain from the PTD allele emerged at d112 (blue point 2) and expanded as the dominant clone at d170 (purple point 3 corresponding to copy number profile in panel B). The complex gain at d112 was below the BR-CNV limit of detection, but its low-level presence (>3%) was inferred from clonal hierarchy, based on an NRAS variant that appeared at d112 but was subsequently deduced as subclonal to the complex PTD at d170 (supplemental Figure 13A). TCN levels at d170 (distal 11q23 = 2.7, PTD exons = 4.4) implied a mixed population comprising c = 70% complex KMT2A-PTD, s = 30% simple KMT2A-PTD, and w = 0% wild-type, by solving the linear constraints (1) TCN of distal 11q23 = 2.7 = 3c + 2s + 2w, (2) TCN of PTD exons = 4.4 = 5c + 3s + 2w, and (3) 1 = c + s + w. (D) 11q23.3 gain from the PTD allele emerged at posttransplant relapse from a previously simple KMT2A-PTD before transplant. The simple KMT2A-PTD component diminished (24% to 16% to 3%) as the complex component expanded (48% to 73% to 96%) over the course of 102 days. WT, wild-type.
Emergence of KMT2A-PTD complexity during progression to AML and relapse. (A) Copy number ratios of KMT2A-PTDs at first available time points by diagnosis were unimodal in MDS (P = .843; dip test) and multimodal in AML (P = .027) with 2 main clusters presumed to correspond roughly to simple and complex KMT2A-PTDs. High ratios were accordingly enriched in AML (33/73; 45%) over MDS (3/25; 12%) (P = .003; Fisher’s exact test) relative to a cutoff (1.6) separating pure simple KMT2A-PTD cells (area shaded light blue) from complex (area shaded pink). Red: cases with secondary AML transformation from MDS (N = 7) or PV (N = 1). Box plots within violin plots: rectangles correspond to interquartile ranges, and whiskers have length equal to 1.5 times interquartile range or end at most extreme outliers. (B) 11q23.3 gain from the PTD allele emerged in a rapidly progressing AML that transformed from MDS with simple KMT2A-PTD (P3). Panels C and D show quantitative evolution of KMT2A-PTD complexity in 2 cases of AML (P3 and P4). Complex, simple, and wild-type components are determined from total copy number (TCN) of PTD exons (y-axis) vs TCN of distal 11q23 (x-axis): vertices of the triangle represent 100% populations of wild-type diploid KMT2A (green vertex), simple PTD (blue vertex), and complex PTD with single PTD gain (red vertex); because TCN is linear, line segments connecting 2 vertices represent mixtures of the 2 corresponding components, whereas the triangle (convex hull of the vertices) represents mixtures of all 3 (wild-type, simple PTD, and complex PTD). (C) 11q23.3 gain from the PTD allele emerged at d112 (blue point 2) and expanded as the dominant clone at d170 (purple point 3 corresponding to copy number profile in panel B). The complex gain at d112 was below the BR-CNV limit of detection, but its low-level presence (>3%) was inferred from clonal hierarchy, based on an NRAS variant that appeared at d112 but was subsequently deduced as subclonal to the complex PTD at d170 (supplemental Figure 13A). TCN levels at d170 (distal 11q23 = 2.7, PTD exons = 4.4) implied a mixed population comprising c = 70% complex KMT2A-PTD, s = 30% simple KMT2A-PTD, and w = 0% wild-type, by solving the linear constraints (1) TCN of distal 11q23 = 2.7 = 3c + 2s + 2w, (2) TCN of PTD exons = 4.4 = 5c + 3s + 2w, and (3) 1 = c + s + w. (D) 11q23.3 gain from the PTD allele emerged at posttransplant relapse from a previously simple KMT2A-PTD before transplant. The simple KMT2A-PTD component diminished (24% to 16% to 3%) as the complex component expanded (48% to 73% to 96%) over the course of 102 days. WT, wild-type.
To further determine when complex KMT2A-PTD events arose in clinical and clonal evolution, we analyzed serial samples from 7 patients with complex KMT2A-PTD. In 5 of 7 patients, the complex event, including 11q23 gain (P3, P4) and broad 11q CN-LOH (P9,P11,P12), developed at the time of secondary AML transformation or AML relapse after previously documented simple or wild-type KMT2A (Figure 2B; supplemental Figures 8 and 10). To quantify relative proportions of simple and complex clones, we decomposed serial samples with 11q23 gain into estimated subpopulations (Figure 2C-D; supplemental Figure 8E) and used these estimates to assign clonal hierarchy. As expected, we found that the simple PTD component diminished over time as the complex PTD component expanded, suggesting that complex KMT2A-PTD events are subclonal to parental simple KMT2A-PTD events. Furthermore, complex KMT2A-PTDs occurred as late events within the overall clonal hierarchy, suggesting that increased KMT2A-PTD allelic dosage may drive leukemic transformation of MDS (supplemental Figure 13). To determine whether KMT2A-PTD allelic dosage was associated with distinct leukemia genetic characteristics, we analyzed cooccurring mutations in AML cases with complex or high-ratio KMT2A-PTD(n = 38) vs AML cases with low-ratio KMT2A-PTD (n = 35). FLT3-ITD mutations were significantly more common in those with complex KMT2A-PTD (39.5% vs 17.1%; P = .042, Fisher exact test), whereas SRSF2 mutations were significantly more common in those with simple/low-ratio KMT2A-PTD (5.3% vs 22.9% P = .041) (supplemental Figure 14; supplemental Table 1).
In conclusion, we developed an approach to integrate quantitative and allelic assessment of KMT2A-PTD in targeted DNA NGS, thereby characterizing explicit allelic complexity in 16% (15/94), and inferred complexity based on high copy ratios in 45% (42/94) of patients with KMT2A-PTD (supplemental Figure 15). KMT2A-PTD was exclusively identified in patients with MDS/AML, and subclonal development of allelic complexity was closely correlated with disease progression, providing a genomic mechanism for the prognostic relevance of high KMT2A-PTD RNA levels. Our approach can be incorporated into standard panel-based DNA sequencing and may be deployed in clinical settings to improve prognosis at diagnosis, surveillance of molecular dynamics at progression and after treatment, and predict response to targeted therapies.11
Acknowledgments
This work was supported by National Institutes of Health (K08CA204734, National Cancer Institute) (R.C.L.), (K08CA263555, National Cancer Institute) (C.J.G.), and (P30CA016056, P30CA016056) (E.S.W.: involving the use of Roswell Park Comprehensive Cancer Center's Hematologic Procurement Shared Resource); the American Society of Hematology (Medical Student Physician-Scientist and HONORS awards [H.M.M.]); the Ted and Eileen Pasquarello Tissue Bank in Hematologic Malignancies; the Dana-Farber Cancer Institute Center for Cancer Genome Discovery; and the Dana-Farber Cancer Institute Hematologic Malignancy Data Repository (Anne Charles, Kevin Copson, Nish Patel).
Authorship
Contribution: H.K.T. and R.C.L. designed the study and wrote the manuscript; C.J.G., H.M.M., M.H.H., E.S.W., L.P.G., A.S.K., V.N., and R.C.L. contributed data; and H.K.T., C.J.G., and P.D. developed informatic tools; and all authors performed data analysis and edited the manuscript.
Conflict-of-interest disclosure: R.C.L. has received consulting fees from Takeda Pharmaceuticals, Thermo Fisher, Nuprobe, and bluebird bio. A.S.K. has received consulting fees from Labcorp. The remaining authors declare no competing financial interests.
Correspondence: R. Coleman Lindsley, Dana-Farber Cancer Institute, 450 Brookline Ave, Boston, MA 02215; e-mail: coleman_lindsley@dfci.harvard.edu.

