

Key Points
Combination therapy of IFN-γ with epigenetic regulators leads to large increases in the immunopeptidome of DLBCL.
HLA ligands from proteins RGS13 and E2F8 may provide DLBCL-specific targets for immunotherapy.

Abstract
Exploring the repertoire of peptides presented on major histocompatibility complexes (MHCs) helps identify targets for immunotherapy in many hematologic malignancies. However, there is a paucity of such data for diffuse large B-cell lymphomas (DLBCLs), which might be explained by the profound downregulation of MHC expression in many DLBCLs, and in particular in the enhancer of zeste homolog 2 (EZH2)-mutated subgroup. Epigenetic drug treatment, especially in the context of interferon-γ (IFN-γ), restored MHC expression in DLBCL. In DLBCL, peptides presented on MHCs were identified via mass spectrometry after treatment with tazemetostat or decitabine alone or in combination with IFN-γ. Such treatment synergistically increased the expression of MHC class I surface proteins up to 50-fold and the expression of class II surface proteins up to threefold. Peptides presented on MHCs increased to a similar extent for both class I and class II MHCs. Overall, these treatments restored the diversity of the immunopeptidome to levels described in healthy B cells for 2 of 3 cell lines and allowed the systematic search for new targets for immunotherapy. Consequently, we identified multiple MHC ligands from the regulator of G protein signaling 13 (RGS13) and E2F transcription factor 8 (E2F8) on different MHC alleles, none of which have been described in healthy tissues and therefore represent tumor-specific MHC ligands that are unmasked only after drug treatment. Overall, our results show that EZH2 inhibition in combination with decitabine and IFN-γ can expand the repertoire of MHC ligands presented on DLBCLs by revealing suppressed epitopes, thus allowing the systematic analysis and identification of new potential immunotherapy targets.
Introduction
Diffuse large B-cell lymphoma (DLBCL) is the most common lymphoma type in the western hemisphere. About 60% of patients with DLBCL can be cured by using standard chemoimmunotherapy—rituximab plus cyclophosphamide, doxorubicin, vincristine, and prednisone (R-CHOP)—but successful treatment remains challenging in patients who have relapsed DLBCL.1 Because the R-CHOP regimen can cause considerable toxicity, which is poorly tolerated by older patients,2 therapeutic agents that minimize adverse effects while still demonstrating antitumor efficacy are attractive. Immunotherapy has seen remarkable antitumor efficacy and on-tumor specificity,3-6 and the identification of neoepitopes that are specific to cancer cells can maximize on-tumor efficacy while minimizing off-target effects on healthy tissue.7-9 Currently, there are a number of cell surface targets for antibody therapies.10 Identification of suitable targets for T-cell immunotherapy relies on immunoprecipitation of major histocompatibility complexes (MHCs) and subsequent analysis of the bound peptides via mass spectrometry (MS), which has been performed on both solid and liquid cancers.11-16
The immunopeptidome of DLBCL has not been well characterized to date; only 1 other study has examined the immunopeptidome of DLBCL at steady state.17 The lack of systematic descriptions of the immunopeptidome of DLBCL may be a result of the inability of DLBCL cells to downregulate antigen presentation and evade immune recognition, which masks neo-epitopes and the complete immunopeptidome.18 Downregulation of antigen presentation is also implicated in immune checkpoint blockade escape.14 To overcome this downregulation, chemotherapies that upregulate antigen presentation are being explored in combination with immune checkpoint blockade in numerous cancer types.19-25 One mechanism for downregulation of HLA expression and antigen presentation is transcriptional silencing by repressive epigenetic marks.26-28 Epigenetic modifiers and immunotherapy are also being explored as rational combination therapeutics for their efficacy at relatively nontoxic doses and their ability to selectively reprogram cancer cells.24,29,30
Promoter DNA methylation silences transcription of the downstream gene. Cancer cells dysregulate DNA methylation to silence antitumor genes. Decitabine, a DNA demethylating agent, covalently binds to the DNA methyltransferases to block deposition of DNA methylation. Because cancers silence antigen presentation using DNA methylation, DNA demethylating agents are actively being explored in preclinical models and in the clinic alongside checkpoint blockade inhibitors and other immunotherapies.31-33 Given that DNA methylation correlates with other repressive epigenetic modifications, they may need to be targeted to overcome coordinated silencing pathways.
The oncogenic functions of EZH2 are being uncovered.34,35 Activating mutations in the catalytic pocket of EZH2 such as those at tyrosine 641 (Y641) cause excessive deposition of H3 lysine 27 trimethylation (H3K27me3), which is associated with repressed transcription.28 These mutations are common in DLBCL and are linked to tumor progression.34,36 Agents that block EZH2 function, such as tazemetostat, bind the S-adenosyl methionine pocket causing competitive inhibition.28,37,38 Similar to DNA methylation, the EZH2 function in silencing antitumor immune responses has also been implicated by recent evidence.24,25,30 In line with these findings, EZH2 can directly recruit DNA methyltransferases to polycomb repressive complex 2 (PRC2) target genes to further stabilize gene silencing.39 In DLBCL, more than half the de novo DNA methylation events overlap with PRC2 target genes, many of which are involved in the interferon-γ (IFN-γ) pathway.40 Although manipulation of a single epigenetic mark can reprogram transcription, epigenetic programs are highly coordinated41 and therefore, targeting multiple epigenetic silencing pathways could more effectively activate expression of antitumor genes than treatment with a single agent. Understanding how combinatorial epigenetic treatment impacts potential responses to immunotherapy could have an immediate high clinical impact.
Here, we explored the therapeutic potential of combining EZH2 inhibition that uses tazemetostat with DNA demethylation through decitabine in the presence of IFN-γ. Both EZH2 inhibitors and DNA demethylating agents positively regulated antigen presentation in EZH2-mutated DLBCL cell lines and demonstrated combinatorial effects on transcriptional activation of antigen presentation from both class I and II MHCs. The induced large increase in MHC surface expression of suppressed epitopes, especially in combination with IFN-γ, enabled the comprehensive MS analysis of the normally heavily suppressed immunopeptidome of these DLBLCs. The drugs induced 10-fold to more than 200-fold increases in total numbers of identified peptides presented by MHC class I molecules, tracking with strong upregulation of MHC expression. For HLA class II molecules, a twofold to threefold upregulation of the HLA complex level also translated into a more diverse ligandome. However, no clear tumor-specific immunotherapy targets could be identified from this subtype of HLA ligands. Still, our data demonstrated the feasibility of identifying immunotherapy targets in DLBCLs by using MS. Among the many newly presented HLA ligands, several highly cancer-specific HLA ligands were identified that can serve as potential targets for immunotherapy design and combination therapies in DLBCL.
Materials and methods
Cell culture and sources
Cells were maintained in RPMI 1640 with penicillin and streptomycin supplemented with 10% heat-inactivated fetal bovine serum (FBS) and 5 mM L-glutamine. All cells were maintained at 37°C in 5% CO2. SUDHL-4 (A*02:01, B*15:01, C*03:04, DRB1*15:01), DB (A*02:01, B*18:01, C*05:01, DRB1*03:01), WSU-DLCL2, and Karpas 422 cells were from the Christian Steidl Laboratory (British Columbia Cancer Research Centre). SUDHL-6 (A*02:01, A*23:01, B*15:01, B*49:01, C*03:03, C*07:01, DRB1*01:01, DRB1*04:01), RI-1 (EZH2 WT), U9-293 (EZH2-WT), and SUDHL-10 were provided by Anas Younes, MD (Memorial Sloan Kettering Cancer Center). HLA typing was performed by the American Red Cross. Human cells were obtained after written informed consent from donors on protocols approved by the Memorial Hospital Institutional Review Board.
Drug treatments
Decitabine (Sellekchem, Cat. No. S1200) in dimethyl sulfoxide (DMSO), tazemetostat (Sellekchem, Cat. No. S7128) in DMSO, and IFN-γ (R&D Systems, 285-IF-100/CF) in 1% FBS were administered in vitro using the same treatment schedule: cells were treated with noted concentrations (decitabine 125-2000 nmol/mL, tazemetostat 312.5-5000 nmol/mL, IFN-γ 1-100 ng/mL) of each drug for 48 hours. Media was refreshed and new drug was added for an additional 48 hours. Untreated cells were given vehicle DMSO and media and were cultured for the duration of the drug treatment.
Flow cytometry
Cells were treated as indicated in the respective figures. Cells were harvested, washed with phosphate-buffered saline (PBS), and labeled in staining buffer (2% FBS and 0.1% sodium azide in PBS) for 30 minutes with a 1:400 dilution of fluorescein isothiocyanate (FITC) mouse anti-human HLA-A2 (clone BB7, BioLegend) and allophycocyanin (APC) anti-human HLA-A, -B, or -C (clone W6/32, BioLegend). Cells were washed after incubation with staining buffer and were analyzed by using a Fortessa flow cytometer (BD Biosciences) or a Guava flow cytometer (Millipore). Live cells were gated for analyses.
Western blot
Cells were treated as indicated in the respective figures. Total cell lysate was extracted with NP-40 buffer and were quantified by using a detergent compatible (DC) protein assay (Bio-Rad). Then, 15 to 30 μg of protein was loaded and run on 4% to 12% sodium dodecyl sulfate polyacrylamide gel electrophoresis gels. After a 1-hour block with 5% milk at room temperature, immunoblotting was performed by using rabbit anti-H3K27me3 (Cell Signaling, Cat. No. 9733). Antibodies were probed at the manufacturer’s recommended dilution overnight at 4°C before a secondary antibody, goat anti-rabbit horseradish peroxidase conjugate (Jackson ImmunoResearch, Cat. No. 111-035-144), was used for imaging. Blots were stripped with Restore Western Blot Stripping Buffer (Thermo Fisher Scientific, Cat. No. 21063), re-blocked with 5% milk, and re-probed with mouse anti-H3 (active motif, AB_2650522), followed by goat anti-mouse horseradish peroxidase conjugate (Jackson ImmunoResearch, Cat. No. 115-035-146) as a loading control.
Quantitative reverse-transcriptase polymerase chain reaction
Untreated vehicle control and drug-treated cells were harvested and washed once with PBS. Cells were lysed in RLT buffer with β-mercaptoethanol, and RNA was extracted using Qiagen RNEasy Kit (QIAGEN, Cat. No. 74134). Extracted RNA was then converted to complementary DNA (cDNA) by using the one-step qSCRIPT cDNA solution. Then 5 ng of isolated cDNA per sample was mixed with 1× target primer and 1× endogenous control primer in Perfecta master mix (Quantabio, Cat. No. 95118). Reactions were performed in a thermocycler. Primers used in this study are Hs00388675_m1; human TAP1, Hs00241060 _m1; TAP2, Hs00984230_m1; human B2M, Hs01058806_g1; human HLA-A, Hs00818803_g1; human HLA-B, Hs00740298_g1; and human HLA-C (Thermo Fisher Scientific).
Immunopurification of HLA ligands
HLA class I ligands (HLA-A, -B, and -C) and HLA class II ligands (HLA-DR) were isolated as described previously from all harvested cells.42 In brief, 40 mg of cyanogen bromide–activated-Sepharose 4B (Sigma-Aldrich, Cat. No. C9142) was activated with 1 mmol/L hydrochloric acid (Sigma-Aldrich, Cat. No. 320331) for 30 minutes. Subsequently, 0.5 mg of W6/32 antibody (Bio X Cell, BE0079; RRID: AB_1107730) or L243 antibody (Bio X Cell, BE0306; RRID: AB_2736986) was coupled to Sepharose in the presence of binding buffer (150 mmol/L sodium chloride [Sigma-Aldrich, Cat. No. S9888], 50 mmol/L sodium bicarbonate [pH 8.3; Sigma Aldrich, Cat. No. S6014) for at least 2 hours at room temperature. Sepharose was blocked for 1 hour with glycine (Sigma-Aldrich, Cat. No. 410225). Columns were washed twice with PBS and equilibrated for 10 minutes. DB, SUDHL-4, and SUDHL-6 cells were treated with the indicated drugs. Cells (5 × 10⁶ to 1.5 × 10⁷) were harvested and washed 3 times in ice-cold sterile PBS (Media Preparation Facility, Memorial Sloan Kettering Cancer Center). Afterward, cells were lysed in 1 mL 1% CHAPS (Sigma-Aldrich, Cat. No. C3023) in PBS, supplemented with 1 tablet of protease inhibitors (COmplete™ Protease Inhibitor Cocktail, Sigma-Aldrich Cat. No. 11836145001) for 1 hour at 4°C. This lysate was spun down for 1 hour at 20000g at 4°C. Supernatant was run over the affinity column through peristaltic pumps at 1 mL/minute overnight at 4°C. Affinity columns were washed with PBS for 15 minutes and run dry; subsequently, HLA complexes were eluted 5 times with 200 mL 1% trifluoracetic acid (TFA; Sigma/Aldrich, Cat. No. 02031). To separate HLA ligands from their HLA complexes, tC18 columns (Sep-Pak tC18 1 cc VacCartridge, 100 mg sorbent per cartridge, 37-55 mm particle size, Waters, Cat. No. WAT036820) were prewashed with 80% acetonitrile (ACN; Sigma-Aldrich, Cat. No. 34998) in 0.1% TFA and were equilibrated with 2 washes of 0.1% TFA. Samples were loaded, washed again with 0.1% TFA, and eluted in 400 mL 30% ACN in 0.1% TFA followed by 400 mL 40% ACN in 0.1% TFA and then in 400 mL 50% ACN in 0.1% TFA. Sample volume was reduced by vacuum centrifugation for MS analysis.
LC-MS/MS analysis of HLA ligands
Samples were analyzed by using high-resolution/high-accuracy liquid chromatography-tandem MS (LC-MS/MS; Lumos Fusion, Thermo Fisher Scientific). Peptides were desalted using ZipTips (MilliporeSigma; Cat. No. ZTC18S008) according to the manufacturer’s instructions and concentrated by using vacuum centrifugation before being separated using direct loading onto a packed in-emitter C18 column (75 μm inside diameter x 12 cm, 3 μm particles; Nikkyo Technos). The gradient was delivered at 300 nL/minute increasing linear from 2% buffer B (0.1% formic acid in 80% acetonitrile)/98% buffer A (0.1% formic acid) to 30% buffer B/70% buffer A over 70 minutes. MS and MS/MS were operated at 60 000 and 30 000 resolution, respectively. Only charge states 1, 2, and 3 were allowed. The isolation window of 1.6 Th (mass/charge) was chosen, and the collision energy was set at 30%. For MS/MS, the maximum injection time was 100 ms with an automatic gain control of 50 000.
MS data processing
MS data were processed using Byonic software43 version 2.7.84 (Protein Metrics) through a custom-built computer server equipped with 4 Intel Xeon E5-4620 8-core central processing units operating at 2.2 GHz and with 512 GB of physical memory (Exxact). Mass accuracy was set to 6 ppm for MS1 and to 20 ppm for MS2 spectra. Digestion specificity was defined as unspecific, and only precursors with charges of 1, 2, or 3 and size of up to 2 kDa were allowed. Protein false discovery rate was disabled to allow complete assessment of potential peptide identifications. Oxidation of methionine, N-terminal acetylation, and phosphorylation of serine, threonine, and tyrosine were set as variable modifications for all samples. All samples were searched against the UniProt Human Reviewed Database (20349 entries; http://www.uniprot.org; downloaded June 2017). To detect mutated HLA ligands, mutated proteins according to the collection of mutations from the Catalogue of Somatic Mutations in Cancer (COSMIC) database were included in our aforementioned database.44 Peptides were selected with a minimal "log prob" value of 2 (as defined by the byonic software) corresponding to a P value <.01 for peptide spectrum match in the given database and were HLA assigned by netMHCpan 4.045 based on a 2% rank cutoff as set as default by netMHCpan. For HLA class II ligands, no binding predictions were performed.
Statistical methods
Experiments in shown in Figures 1–4 and supplemental Figures 3, 4, and 9 were analyzed using analysis of variance (ANOVA) followed by a post hoc Tukey’s test to determine the significance of individual groups. IFN-γ dose-response experiments in Figure 4 and supplemental Figure 5 were analyzed by using a Student t test between control and treated conditions. Graphs and plots were made using R programming and Graphpad Prism.
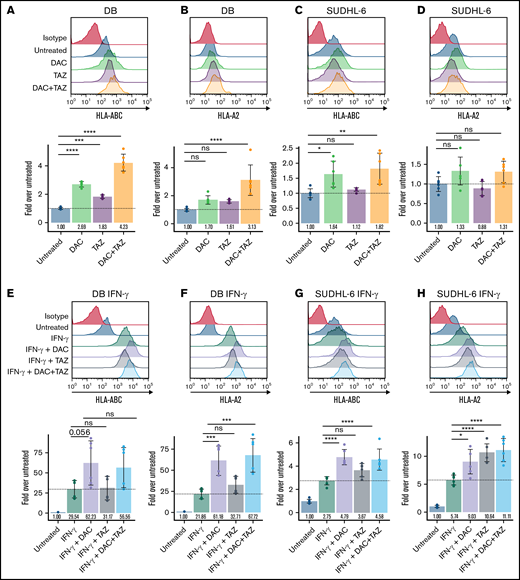
Decitabine (DAC) and tazemetostat (TAZ) upregulated HLA protein in DLBCL cell lines. (A-D) Cells were treated with indicated 125 nM decitabine or 1 μM tazemetostat. DB and SUDHL-6 cells were assayed for HLA-A, -B, and -C or HLA-A-02 expression by flow cytometry. (E-H) Cells were treated as in panels A-D along with 100 ng/mL IFN-γ. Analysis of variance (ANOVA) was performed using either untreated (panels A-D) or IFN-γ alone (panels E-H) as control, followed by a post hoc Tukey’s test for individual experimental groups. Mean ± standard deviation (SD) is shown for 3 technical replicates per 2 biological replicates. ns, not significant. *P < .05; **P < .01; ***P < .001; ****P < .0001.
Decitabine (DAC) and tazemetostat (TAZ) upregulated HLA protein in DLBCL cell lines. (A-D) Cells were treated with indicated 125 nM decitabine or 1 μM tazemetostat. DB and SUDHL-6 cells were assayed for HLA-A, -B, and -C or HLA-A-02 expression by flow cytometry. (E-H) Cells were treated as in panels A-D along with 100 ng/mL IFN-γ. Analysis of variance (ANOVA) was performed using either untreated (panels A-D) or IFN-γ alone (panels E-H) as control, followed by a post hoc Tukey’s test for individual experimental groups. Mean ± standard deviation (SD) is shown for 3 technical replicates per 2 biological replicates. ns, not significant. *P < .05; **P < .01; ***P < .001; ****P < .0001.
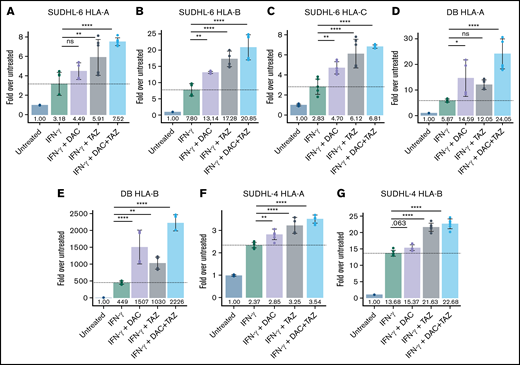
Decitabine and tazemetostat activated transcription of HLA alleles on DLBCL cell lines. (A-G) SUDHL-6, DB, and SUDHL-4 cells were treated with indicated drugs (decitabine, 100 nM; tazemetostat, 1 μM; IFN-γ, 10 ng/mL). Graph of fold-change in transcript to untreated for each indicated gene (panels A, D, F) HLA-A, (panels B, E, G) HLA-B, and (panel C) HLA-C. ANOVA was performed using IFN-γ alone as control, followed by a post hoc Tukey’s test for individual experimental groups. Mean ± SD is shown for 3 technical replicates per 2 biological replicates. *P < .05; **P < .01; ****P < .0001.
Decitabine and tazemetostat activated transcription of HLA alleles on DLBCL cell lines. (A-G) SUDHL-6, DB, and SUDHL-4 cells were treated with indicated drugs (decitabine, 100 nM; tazemetostat, 1 μM; IFN-γ, 10 ng/mL). Graph of fold-change in transcript to untreated for each indicated gene (panels A, D, F) HLA-A, (panels B, E, G) HLA-B, and (panel C) HLA-C. ANOVA was performed using IFN-γ alone as control, followed by a post hoc Tukey’s test for individual experimental groups. Mean ± SD is shown for 3 technical replicates per 2 biological replicates. *P < .05; **P < .01; ****P < .0001.
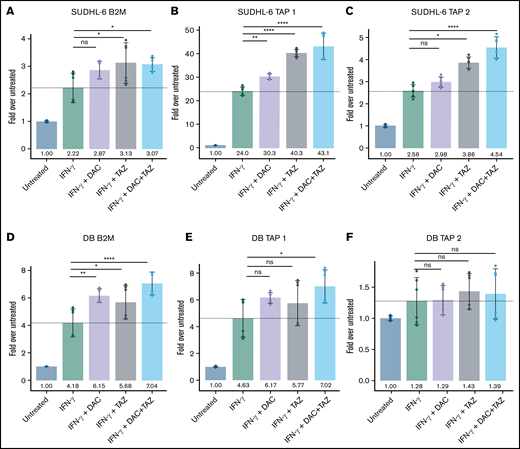
Decitabine and tazemetostat activated transcription of antigen-presentation genes in DLBCL cell lines. (A-F) SUDHL-6 and DB cells were treated with indicated drugs (decitabine, 100 nM; tazemetostat, 1 μM; IFN-γ, 10 ng/mL). Graph of fold-change in transcript to untreated for each indicated gene (panels A, D) B2M, (panels B, E) Tap1, (panels C, F) Tap2. Mean ± SD is shown for 3 technical replicates per 2 biological replicates. *P < .05; **P < .01; ****P < .0001.
Decitabine and tazemetostat activated transcription of antigen-presentation genes in DLBCL cell lines. (A-F) SUDHL-6 and DB cells were treated with indicated drugs (decitabine, 100 nM; tazemetostat, 1 μM; IFN-γ, 10 ng/mL). Graph of fold-change in transcript to untreated for each indicated gene (panels A, D) B2M, (panels B, E) Tap1, (panels C, F) Tap2. Mean ± SD is shown for 3 technical replicates per 2 biological replicates. *P < .05; **P < .01; ****P < .0001.
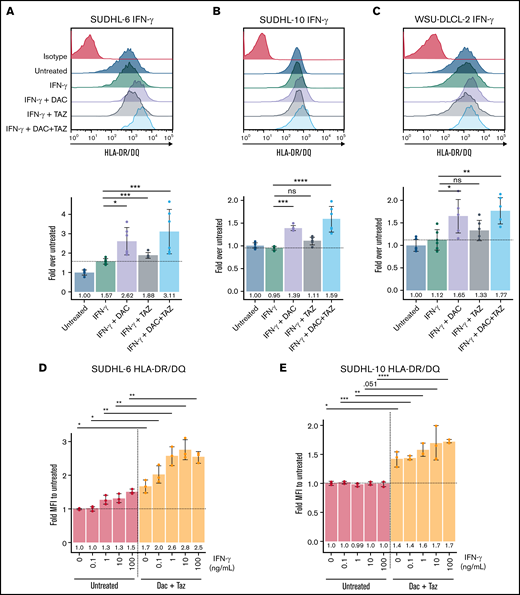
Decitabine upregulated HLA class II molecules in DLBCL cell lines. (A-C) Cells were treated with 125 nM decitabine or 1 μM tazemetostat along with 100 ng/mL IFN-γ for SUDHL-6, SUDHL-10, and WSU-DLCL-2 cell lines and were assayed for expression of HLA-DR/DQ. Mean ± SD is shown for 3 technical replicates per 2 biological replicates. (D-E) Serial dilutions of IFN-γ were performed in the presence or absence of decitabine and tazemetostat for SUDHL-6 and SUDHL-10 cell lines. Mean ± SD is shown for 3 individual replicates. *P < .05; **P < .01; ***P < .001; ****P < .0001.
Decitabine upregulated HLA class II molecules in DLBCL cell lines. (A-C) Cells were treated with 125 nM decitabine or 1 μM tazemetostat along with 100 ng/mL IFN-γ for SUDHL-6, SUDHL-10, and WSU-DLCL-2 cell lines and were assayed for expression of HLA-DR/DQ. Mean ± SD is shown for 3 technical replicates per 2 biological replicates. (D-E) Serial dilutions of IFN-γ were performed in the presence or absence of decitabine and tazemetostat for SUDHL-6 and SUDHL-10 cell lines. Mean ± SD is shown for 3 individual replicates. *P < .05; **P < .01; ***P < .001; ****P < .0001.
Results
Decitabine and tazemetostat improved IFN-γ–responsive HLA upregulation in EZH2-mutated DLBCL cell lines
To understand how decitabine, a potent DNA demethylating agent, and tazemetostat, a highly specific EZH2 inhibitor, might have an impact on antigen presentation, we first measured HLA I cell surface expression in EZH2-mutated DLBCL cell lines via flow cytometry. We selected cell lines to be HLA-A*02:01–positive because that represents the most common HLA haplotype in the Western Hemisphere and therefore is of broad interest. A complete overview of the cell lines used in our study, their HLA types, and the assays we performed can be found in supplemental Table 1. Tazemetostat decreases global H3K27me3 with 96 hours of drug treatment (supplemental Figure 1). The concentrations of each drug were determined by dose-response curves on the SUDHL-4 cell lines by using concentrations that lead to upregulation of HLA without excessive loss in viability (supplemental Figure 2). Both DB and SUDHL-6 treated DLBCL cell lines variably upregulated HLA I and HLA-A*02 cell surface expression when treated with 1 μM tazemetostat, 125 nM decitabine, or a combination of both (Figure 1A-D). Interestingly, decitabine led to a more robust upregulation of HLA as monotherapy compared with tazemetostat. Nonetheless, the combination of both decitabine and tazemetostat lead to the highest and most significant upregulation of HLA-A, -B, and -C in both cell lines. Trends toward increased HLA I expression were also observed for the EZH2-mutant DLBCL cell lines WSU-DLCL2, SUDHL-4, SUDHL-10, but not Karpas 422 (supplemental Figure 3). One potential explanation for the variable responsiveness might be the baseline HLA class I expression as determined by expression data from the Cancer Cell Line Encyclopedia (CCLE).46 Here, we observed an inverse correlation between the HLA-A, -B, and -C expression and the strength of HLA upregulation. For example, the differential expression between DB and Karpas 422 cells was more than 170-fold, indicating strong repression by DB cells. Therefore, DB cells have the potential to upregulate HLA whereas the potential of further upregulation in Karpas 422 cells is limited (supplemental Table 2). Furthermore, when DLBCL cell lines were treated with IFN-γ in addition to the aforementioned treatment schema, there was a cooperative increase in total HLA I expression, which reached more than 50-fold upregulation for DB cells, fivefold upregulation for SUDHL-6 cells, and more than 50-fold upregulation for DB cells when HLA-A*02 alone was assessed (Figure 1E-H). Similarly, modest trends in increased HLA expression were seen in WSU-DLCL2, SUDHL-4, and SUDHL-10, but not Karpas 422 (supplemental Figure 4).
To determine whether tazemetostat synergizes with decitabine in HLA I upregulation, we performed a matrix titration of decitabine in the presence of tazemetostat and 100 ng/mL IFN-γ and tested for HLA-A*02. Indeed, any concentration of tazemetostat shifted the expression of HLA-A*02 at each decitabine concentration tested (supplemental Figure 5A,C). Similarly, a shift in expression was seen by a tazemetostat titration in the presence of different concentrations of decitabine (supplemental Figure 5B-C). In addition, tazemetostat alone showed a dose-dependent increase in HLA expression in SUDHL-4 and DB cells in the presence or absence of IFN-γ (supplemental Figure 6). To demonstrate that decitabine and tazemetostat can increase IFN-γ responsiveness, we performed 10-fold dilutions of IFN-γ in the presence of 125 nM decitabine and 1 μM tazemetostat. DB and SUDHL-6 cells showed significantly higher responses to IFN-γ, again reaching 50-fold upregulation for DB cells and increases up to sixfold for SUDHL-6 cells when treated with epigenetic modifiers (supplemental Figure 5D-E). We tested whether EZH2 wild-type (wt) DLBCL cell lines also upregulate HLA after treatment with tazemetostat. Tazemetostat strongly upregulated HLA-A, -B, and -C on the EZH2-mutated cell line SUDHL-4, but had little to no upregulation of HLA on the EZH2 wt cell lines RI-1 and U9-293 (supplemental Figure 7A,C,E). Interestingly, decitabine had a sizable effect on HLA upregulation regardless of EZH2 mutation status. Taken together, these results demonstrated that decitabine and tazemetostat upregulate HLA in EZH2-mutant DLBCL, whereas decitabine can upregulate HLA in a broader subset of DLBCLs.
Decitabine and tazemetostat modulated individual HLA alleles independently and upregulated the transcription of antigen presentation machinery in DLBCL
Given the general upregulation of HLA after treatment with tazemetostat or decitabine, we further evaluated the impact of these drugs on transcription of each HLA allele individually as well as their impact on other components of the antigen presentation machinery by using quantitative reverse-transcriptase polymerase chain reaction (qRT-PCR). SUDHL-6 cells showed a progressive increase in transcription of each allele, which was most prominent in the triple treatment group. In addition, confirming results from previous reports, IFN-γ upregulated HLA-B transcription more profoundly than HLA-A and HLA-C (Figure 2A-C).47 DB cells similarly showed a progressive increase in expression of HLA-A and HLA-B loci when treated in combination with IFN-γ, decitabine, and tazemetostat (Figure 2D,E). Decitabine had a stronger impact on HLA upregulation compared with tazemetostat. Remarkably, HLA-B expression was increased 500-fold with IFN-γ treatment, which could be improved to about 1500-fold with combination decitabine, 1000-fold with combination tazemetostat, and 2200-fold in the triple treatment group across 2 independent biological replicates. For the DB cell line, HLA-C levels were undetectable. SUDHL-4 cells also showed significant upregulation of HLA-A and HLA-B in combination epigenetic treatment (Figure 2F,G). As with DB cells, SUDHL-4 cells showed no expression of HLA-C transcript in multiple repetitions of the experiments. Although these results were surprising, they are in line with the very low expression levels of these cell lines reported in the CCLE.46 Here, SUDHL-4 is among the 6.5% of cell lines with the lowest HLA-C expression, and DB cells are among the bottom 2%. In contrast, SUDHL-6 cells have reported transcript per million values close to the median of HLA-C expression compared with all other cell lines in the CCLE.
Given large upregulations of the different HLA I alleles during drug treatment, we assessed upregulation of antigen presentation machinery β2-microglobulin (β2M) and transporter associated with antigen processing (TAP) 1 and 2. Although less striking than HLA expression, β2M, TAP1, and TAP2 were significantly increased in SUDHL-6, and β2M and TAP1 were significantly upregulated in DB cells across 2 independent biological replicates when cells treated with IFN-γ were also treated with decitabine or tazemetostat (Figure 3). Similar but less profound upregulation of antigen presentation was also seen in SUDHL-4 cells (supplemental Figure 8). Yet overall, EZH2 and DNA methylation inhibition upregulated transcripts involved in antigen processing and presenting at very high levels.
Decitabine upregulates HLA class II expression in DLBCL
To complete the analysis of proteins primarily involved in antigen presentation, we turned to HLA class II molecules because they are also highly expressed on DLBCLs in line with their B-cell origin. The overall limited expression of HLA class II molecules throughout the body also makes class II–presented peptides suitable immunotherapy targets. Therefore, we assessed the impact of decitabine and tazemetostat on expression of HLA class II molecules. Tazemetostat had no significant effect on HLA-DR or HLA-DQ expression. However, decitabine treatment trended toward upregulation of HLA-DR and HLA-DQ, whereas the combination led to significant upregulation in SUDHL-6 and SUDHL-10 and a similar trend in WSU-DLCL2 cells (supplemental Figure 9). Class II upregulation was further enhanced by the addition of IFN-γ to the cells treated with decitabine and tazemetostat, leading to significant upregulation by decitabine in all 3 cell lines (Figure 4A-C). To determine whether decitabine and tazemetostat lowered the threshold for IFN-γ–mediated HLA class II upregulation, we titrated IFN-γ in the presence of 125 nM decitabine and 1 μM tazemetostat. As seen with HLA class I expression, HLA-DR and HLA-DQ were significantly upregulated by decitabine and tazemetostat across each IFN-γ concentration (Figure 4D-E).
Epigenetic drug treatment in combination with IFN-γ allowed systematic analysis of the DLBCL immunopeptidome and identified disease-specific HLA ligands
Given the extensive increases in HLA class I and class II expression, antigen presentation machinery, and individual ligand presentation, which followed treatment with epigenetic modifiers in combination with IFN-γ, we wanted to systematically investigate the changes and potential emergence of new peptides that are presented on the cell surface. By using immunoprecipitation with HLA-A, -B, -C, and -DR–specific antibodies, separation of the bound peptides, and subsequent MS, we identified increases in the numbers of unique HLA ligands similar to the fold changes seen in qRT-PCR and by flow cytometry for HLA levels in both HLA class I and HLA class II molecules. Strikingly, this method, which usually robustly identifies thousands of different HLA ligands in a single sample, detected few (between 7 and 19) unique peptides in the 3 untreated cell lines (SUDHL-4, DB, and SUDHL-6 for HLA-A, -B, and -C molecules), which resembles the profound downregulation of HLA levels in these cell lines. In contrast, when cell lines were treated with IFN-γ and the previously used schema of decitabine and tazemetostat, SUDHL-6 cells presented more than 400 unique HLA ligands, SUDHL-4 cells presented more than 1500 unique HLA ligands, and DB cells presented more than 2000 unique HLA ligands when using the most effective treatment condition (supplemental Table 3). This number of ligands is similar to number of peptides identified on healthy B cells if similar numbers of cells had been used (supplemental Figure 10A-C). Thus, this corresponds to an upregulation of HLA ligand presentation in the range of 10-fold to 20-fold for SUDHL-6 cells, 40-fold to 70-fold for SUDHL-4 cells, and 100-fold to 250-fold for DB cells (Figure 5A). Although the combination of tazemetostat and IFN-γ induced the strongest changes in SUDHL-4 and SUDHL-6 cells, no clear drug combination induced the most unique peptides. In all 3 cell lines, the addition of tazemetostat or tazemetostat in combination with decitabine showed additive effects over the IFN-γ treatment alone. Still, the IFN-γ treatment led to the largest upregulation, which was further enhanced by treatment with epigenetic drugs.

Epigenetic drug treatment in the presence of IFN-γ unmasked the immunopeptidome of DLBCL cell lines. (A) Cells were treated with 125 nM decitabine, 1 μM tazemetostat or the combination of both in the presence of 100 ng/mL IFN-γ. Fold change of unique identifications of HLA ligands relative to untreated cells is depicted. Error bars indicate mean plus range. Experiments were performed in duplicates. (B) Relative distribution of HLA alleles after assignment to their respective alleles through NetMHCpan 4.0. (C) Overlap analysis of all peptides by cell line and respective treatment condition. (D) Overlap of source proteins for HLA ligands shared between the SUDHL-4, DB, and SUDHL-6 cell lines (top). Overlap of 151 source proteins from overlap at the top were matched with 13 428 source proteins of the HLA class I ligandome from healthy donors as published by Marcu et al.50
Epigenetic drug treatment in the presence of IFN-γ unmasked the immunopeptidome of DLBCL cell lines. (A) Cells were treated with 125 nM decitabine, 1 μM tazemetostat or the combination of both in the presence of 100 ng/mL IFN-γ. Fold change of unique identifications of HLA ligands relative to untreated cells is depicted. Error bars indicate mean plus range. Experiments were performed in duplicates. (B) Relative distribution of HLA alleles after assignment to their respective alleles through NetMHCpan 4.0. (C) Overlap analysis of all peptides by cell line and respective treatment condition. (D) Overlap of source proteins for HLA ligands shared between the SUDHL-4, DB, and SUDHL-6 cell lines (top). Overlap of 151 source proteins from overlap at the top were matched with 13 428 source proteins of the HLA class I ligandome from healthy donors as published by Marcu et al.50
Next, we determined the allelic distribution of these newly presented HLA ligands. We used NetMHCpan 4.0 to assign each peptide to 1 of the expressed HLA alleles and then examined the fraction of peptides presented on each allele. First, all cell lines demonstrated the known preferences for peptide presentation on HLA-B alleles after treatment with IFN-γ.47-49 Interestingly, all epigenetic monotherapies (tazemetostat or decitabine) enhanced this effect. However, the combination of both modifiers led to distribution patterns identical to treatment with IFN-γ alone (Figure 5B). In contrast to the undetectable HLA-C expression in DB and SUDHL-4 cells, we detected ligands predicted to bind HLA-C complexes. One explanation is that strong enrichment for the HLA complexes allows for successful detection of HLA-C ligand. Another likely explanation is false assignment of HLA ligands from the HLA-A*02 allele to the HLA-C allele. Because this discrepancy cannot be resolved by our current methods, we will continue to report these peptides as binders for both HLA alleles.
Furthermore, the overlapping HLA class I ligands between the 5 treatment conditions in each cell line demonstrated that for each single treatment condition, a relevant proportion of peptides that was unique to this treatment group was detectable (Figure 5C; a detailed overview of the peptides in each subgroup is provided in supplemental Table 4). This fraction could be as little as 8% (82 of 1022 peptides) (eg, in the SUDHL-4 cells treated with IFN-γ), but these fractions could be as high as 29% to 30%, as seen for the subgroups treated with IFN-γ and tazemetostat in SUDHL-4 (458 of 1555 peptides) and SUDHL-6 (130 of 431 peptides). The triple-treated condition in DB cells displayed HLA ligands of which 44% (851 of 1918 peptides) were unique to that treatment condition. No consistent pattern could be observed regarding which epigenetic treatment led to the strongest improvement, although it was evident that these drugs could lead to substantial changes in the immunopeptidome resulting in the presentation of many HLA class I ligands not previously displayed.
We investigated the origin of peptides that arose after different treatment conditions. First, to analyze whether the presented peptides correlated with the phenotype of a DLBCL, we specifically looked for HLA ligands derived from proteins that serve as histologic markers for the diagnosis of DLBCL or that are associated with relevant pathobiology of the disease (BCL-2, BCL-6, MYC, MYD88, CD79A/B, CREBBP, PAX5, and EZH2). HLA ligands could be identified for 4 of these 8 proteins. For bcl-6 and CD79A/B, multiple HLA ligands on different HLA alleles were detectable after drug treatment, whereas for the CREBBP and PAX-5 proteins, only 1 HLA ligand per protein was found (Table 1, "HLA ligands from proteins used as DLBCL markers").
HLA ligands identified from DLBCL markers and disease-specific HLA ligands
| SUDHL-4 | DB | SUDHL-6 | |||||||||||
|---|---|---|---|---|---|---|---|---|---|---|---|---|---|
| IFN-γ | IFN-γ/ decitabine | IFN-γ/ tazemetostat | IFN-γ/ decitabine/tazemetostat | Untreated | IFN-γ | IFN-γ/ decitabine | IFN-γ/ tazemetostat | IFN-γ/ decitabine/tazemetostat | IFN-γ | IFN-γ/ decitabine | IFN-γ/ tazemetostat | IFN-γ/ decitabine/tazemetostat | |
| HLA ligands from proteins used as DLBCL markers | |||||||||||||
| BCL6 | LIHTGEKPY (B*15), RIHSGEKPY (B*15), SQSPQHAEM (B*15), TVHTGEKPY (B*15) | RIHSGEKPY (B*15), SQSPQHAEM (B*15), AITNTKVQY (B*15), TVHTGEKPY (B*15), GAITNTKVQY (B*15) | RIHSGEKPY (B*15), SQSPQHAEM (B*15), TVHTGEKPY (B*15), LIHTGEKPY (B*15) | RIHSGEKPY (B*15) | |||||||||
| CREBBP | AQAPAQSQF (B*15) | ||||||||||||
| CD79A/B | RVQEGNESY (B*15) | RVQEGNESY (B*15) | RVQEGNESY (B*15) | RVQEGNESY (B*15) | LLSAEPVPA (A*02) | DEYEDENLY (B*18), LLSAEPVPA (A*02), TELRVmGF (B*18) | DEYEDENLY (B*18), LLSAEPVPA (A*02), TELRVmGF (B*18) | DEYEDENLY (B*18), LLSAEPVPA (A*02), TELRVMGF (B*18) | DEYEDENLY (B*18), LLSAEPVPA (A*02), TELRVMGF (B*18), DENPQQLKL (B*18) | RVQEGNESY (B*15) | RVQEGNESY (B*15) | RVQEGNESY (B*15) | |
| PAX5 | YSHPQYSSY (B*15) | YSHPQYSSY (B*15) | |||||||||||
| HLA ligands not presented in healthy cells | |||||||||||||
| RGS13 | ATKYGPVVY (B*15) | ATKYGPVVY (B*15) | ATKYGPVVY (B*15) | FENLMATKY (B*18) | ATKYGPVVY (B*15) | ATKYGPVVY (B*15) | |||||||
| E2F8 | PQAPSGPSY (B*15) | PQAPSGPSY (B*15) | QEFDFIKSY (B*18) | QEFDFIKSY (B*18) | QEFDFIKSY (B*18) | PQAPSGPSY (B*15) | PQAPSGPSY (B*15) | ||||||
More importantly, to identify potential immunotherapy targets, we looked for HLA ligands that met the following criteria: the peptides need to be derived from proteins that were identified in all 3 cell lines and from proteins that have not been reported in the immunopeptidome of healthy donors. Therefore, we overlapped the source proteins from which the HLA ligands were derived from all 3 cell lines and identified 151 proteins shared between all 3 lines, which corresponds to 5.9% of all reported proteins in our data set (supplemental Figure 11A). At this point, we focused only on the protein, but not the HLA ligand to account for the different HLA alleles present in these cell lines. We then took these 151 proteins and matched them against 13 576 proteins, which were recently reported by Marcu et al50 to be the source of HLA ligands in healthy tissues. From this analysis, only 3 proteins were identified to be unique to the DLBCL group (Figure 5D). One protein, an HLA allele subtype, could also be annotated to proteins included in the 13 576 proteins after further analysis and therefore was determined to be a false positive. The remaining 2 proteins, regulator of G protein signaling 13 (RGS13) and E2F transcription factor 8 (E2F8), were highly tumor specific, because no HLA class I ligands from these proteins have been reported on healthy tissues. RGS13-derived peptides were identified in other malignant samples, and E2F8-derived HLA ligands were exclusively found in transformed B cells, according to the Immune Epitope Database (IEDB).51 Moreover, the identified HLA ligands from RGS13 and E2F8 in these cell lines were detectable in many different treatment replicates; in the case of ATKYGPVVY (B*15) and PQAPSGPSY (B*15), the epitope was shared between the SUDHL-4 and SUDHL-6 cell lines, which renders these HLA ligands promising targets for immunotherapy. The high expression levels of RGS13 and E2F8 in DLBCL, which according to the CCLE did not correlate with the HLA-A, -B, or -C expression (supplemental Figure 12; supplemental Table 2), highlights the feasibility of these target proteins for immunotherapy. In addition, these targets are tumor specific. No HLA ligands from these 2 proteins were reported on any healthy tissues. In search of other tumor-specific HLA ligands, we also investigated the presentation of mutated HLA ligands. By using mutation data from the Catalogue Of Somatic Mutations In Cancer (COSMIC) database, we re-analyzed our data sets but did not detect any mutated HLA ligands in all treatment conditions and cell lines (data not shown).44
To complement our analysis, we also performed a similar analysis for the overlap between the 3 cell lines on the HLA ligand level rather than the protein level. Because the HLA types of these cell lines vary, it is not surprising that only a very limited fraction of 4 peptides could be identified as being shared among the 3 cell lines (supplemental Figure 11B), and after matching these shared ligands to the healthy ligandome by Marcu et al,50 no tumor-specific shared HLA ligands were identified. Although many tumor-specific HLA ligands could be identified on a per cell line basis, we favor our approach on the protein level because it led to the discovery of proteins clearly associated with DLBCL and high tumor specificity independent of HLA restriction. A potential solution to the problem of the low number of shared HLA ligands would be the definition of tumor-specific HLA ligands per cell line. In fact, this analysis defined 451 tumor-specific HLA ligands for SUDHL-4, 938 for DB, and 90 for SUDHL-6 cells.
We also investigated HLA class II ligands as potential immunotherapy targets. Similar to HLA class I complex levels, the upregulation of HLA class II complex levels on the cell surface corresponded with a more diverse immunopeptidome. Still, because increases were moderate compared with those of HLA class I complex levels, the number of potential immunotherapy targets was also lower. Overall, HLA class II ligands were identified in the DMSO-treated samples—20 for DB, 173 for SUDHL-4, and 280 for SUDHL-6. The unique HLA ligands were upregulated to 65 for DB, 390 for SUDHL-4, and 975 for SUDHL-6 cells under triple drug therapy. For HLA class II ligands, the effect of tazemetostat was very limited, and the most substantial increases were observed after treatment with decitabine combined with IFN-γ (supplemental Figure 11C). By following the analysis strategy for HLA class I peptides, we also defined treatment-associated HLA class II ligands (supplemental Figure 11D; supplemental Table 4) and matched the HLA ligands presented in all cell lines with the immunopeptidome of healthy cells as published by Marcu et al.50 Although many HLA class II peptides were primarily defined as tumor specific, a detailed analysis demonstrated that all HLA class II peptides which were initially categorized as tumor specific had length variants of these peptides presented on healthy cells. This finding suggests that, in fact, no truly tumor-specific HLA ligands that are shared between all 3 cell lines were identified for the HLA class II peptides. However, on an individual cell line level, 229 HLA-DR peptides can be defined as tumor-specific for SUDHL-4, 50 for DB, and 448 for SUDHL-6 cells.
Overall, we demonstrated that the diversity of the immunopeptidome followed the trends for upregulation of surface levels for HLA class I ligands, although this trend did not always align perfectly with the relative levels of HLA upregulation (supplemental Figure 13A-C). For HLA class II peptides, the upregulation on the ligandome level followed the HLA upregulation almost perfectly (supplemental Figure 13D). The observed HLA ligandome per cell line was not a direct function of gene expression. This can be illustrated by comparing the complete transcriptome per cell line (supplemental Figure 14A) in contrast to the transcriptome of genes contributing to the HLA ligandome, which follows a normal distribution (supplemental Figure 14B).
Discussion
The immunopeptidome of many hematologic malignancies has been described in detail and provides a valuable source for possible targets of T-cell immunotherapy.11 -13,52 In contrast, little data regarding the immunopeptidome are available for DLBCL, most likely because of a strong HLA downregulation, which has been reported especially for the EZH2-mutated subgroup.24 Identifying possible targets in DLBCL is important because immunotherapies are often powerful therapies with relatively low toxicity.
Here, we demonstrated how EZH2 inhibitors and DNA demethylation in the presence of IFN-γ can overcome the immune evasion mechanisms of DLBCL, leading to the robust unmasking of novel, potentially targetable HLA ligands. First, these drug combinations led to substantial increases of HLA class I surface expression with increases up to 50-fold by flow cytometry, which were mediated to a large extent by IFN-γ, but which were clearly enhanced by the addition of tazemetostat or decitabine or the combination of both drugs. For HLA class II molecules, these effects were less profound, but they were constant between the cell lines leading to up to threefold upregulation in the combination treatment group, although the strongest effects were mediated by decitabine. The therapeutic combination of DNA demethylating agents with selective EZH2 inhibitors is supported by evidence of direct, physical links between EZH2 and DNA methyltransferases. EZH2 recruits DNA methyltransferases to PRC2 gene loci for further stabilization of the repressive epigenetic program.39 Therefore, genes that are initially silenced by overactive EZH2 function in DLBCL may be resistant to upregulation by EZH2 inhibitors if DNA methylation is redundantly silencing the locus. Indeed, more than half the de novo DNA methylation events between healthy B cells and B-cell lymphoma are at PRC2 target sites.40
Moreover, when we investigated the allele-specific HLA upregulation, we discovered that HLA-C alleles were not detectable in DB and SUDHL-4 cells, which is consistent with published low HLA-C expression in the CCLE. The impression that these cell lines still present many HLA-C ligands comes from ambiguities in the HLA ligand assignments through NetMHCpan because HLA-A*02 ligands also often score well for HLA-C alleles, although they do not score as well as for HLA-A*02. Still, because this problem cannot be solved systematically, we assigned the peptides to both alleles as potential binders.
Considering the allelic diversity, these cell lines were already homozygous for all 3 HLA class I alleles. This additional loss of HLA-C further reduces the number of HLA alleles that were able to present a diverse immunopeptidome to 2 alleles. Moreover, when we quantitatively examined the peptides presented by these cell lines, few HLA ligands were assigned to HLA-A*02 in SUDHL-4, rendering this cell line functionally nearly mono-allelic, which illustrates again the profound immunosuppressive mechanisms in DLBCL and another strategy for immune evasion in lymphoma. Of note, we also observed an inverse correlation of induction of HLA ligands and baseline HLA level expression, suggesting that especially highly suppressed DLBCL cell lines are the cells most susceptible to the triple treatment strategy which then overcomes their evasion mechanism.
Finally, the drug-induced unmasking of HLA ligands in the cell lines we investigated allowed us to conduct a systematic analysis of HLA ligands present in HLA-low DLBCL, which led to the detection of HLA I ligands from RGS13 and E2F8, which had not been observed in healthy tissues. Interestingly, ATKYGPVVY from RGS13 has not been described in any other sample of cancer cells, demonstrating that truly novel HLA ligands can arise after these drug treatments. Because 2 of the HLA ligands from HLA-B*15 (ATKYGPVVY from RGS13 and PQAPSGPSY from E2F8) were found on both cell lines expressing this allele (SUDHL-4 and SUDHL-6), we also demonstrated the feasibility of identifying tumor-specific shared antigens.
A limitation of this study is the lack of a thorough investigation of the immunogenicity of these or any other induced HLA ligands. Such studies need to be performed in the future to identify potential candidate peptides for immunotherapies. Nevertheless, we are convinced that HLA ligands derived from RGS13 and E2F8 could be interesting targets for T-cell receptor (TCR) mimic-based immunotherapies that can recognize their target independent of T-cell reactivity because these proteins are strongly and broadly expressed among DLBCLs (according to the CCLE). No reports of HLA ligands derived from these proteins were found in the immunopeptidome of healthy tissues for any HLA allele investigated. These findings underline the high tumor specificity of these targets for future immunotherapeutic development.
For HLA class II ligands, we could not define shared, clearly tumor-specific immunotherapy targets. However, because many HLA ligands were detected that clearly are not detected in healthy tissues, extensive characterization of these numerous peptides could identify a target that could synergize with HLA class I–presented peptides in a therapeutic approach. Furthermore, it must be noted that for all HLA class I and class II peptides, a limitation of this study could be the toxicity mediated by the triple treatment and the use of slightly different drug concentrations and time courses used to mitigate toxicity, which could have led to biases in the analysis of the HLA ligandome.
Overall, we are convinced that these treatment strategies can help us better understand the immune evasive mechanisms of DLBCLs and can also provide novel immunotherapy targets for a disease which is so far lacking a highly tumor-specific target for T cell-based immunotherapy.
Acknowledgments
The authors thank Alex Kentsis for access to the Byonic Software, Henrik Molina from the Proteome Resource Center at The Rockefeller University for the performing all LC-MS/MS experiments, and Steven Josefowicz for guidance during this project.
This work was supported by the Leukemia and Lymphoma Society, grants from the National Institutes of Health, National Cancer Institute (P30 CA008748, R01 CA55349, P01 CA23766, and R35 CA241894), and Tudor Funds. Z.M. received funding from the Steven A. Greenberg Lymphoma Research award and Alex’s Lemonade Stand Foundation. M.G.K. received funding from an individual research grant by the German Research Foundation (DFG) (KL3118/1-1) and is a member of the BIH (Berlin Institute of Health) clinician scientist program.
Authorship
Contribution: C.M.B., S.S.M., Z.E.H.A., Z.M., and M.G.K. performed experiments and analyzed the data; C.M.B., M.G.K., K.T., A.D., R.S.G., and D.A.S. designed the experiments; C.M.B. and M.G.K. wrote the original draft of the manuscript; T.D., C.S., M.G.K., and D.A.S. supervised the project; and D.A.S. provided funding and edited the manuscript; and all authors reviewed and contributed to the manuscript.
Conflict-of-interest disclosure: C.S. has performed consultancy for AbbVie and Bayer, and has received research funding from Trillium Therapeutics Inc and Epizyme. T.D. served as a consultant for Eureka Therapeutics. M.G.K. serves as a consultant for Ardigen. D.A.S. has ownership in, income from, or research funds from Pfizer, SELLAS Life Sciences, Iovance Biotherapeutics, Eureka Therapeutics, CoImmune, Oncopep, and Repertoire Immune Medicines. The remaining authors declare no competing financial interests.
Correspondence: David A. Scheinberg, Memorial Sloan Kettering Cancer Center, 1275 York Ave, Zuckerman 1960, New York, NY 10065; e-mail: scheinbd@mskcc.org.

