

Key Points
We tested 75 HHT-independent genes by whole genome sequencing, integrating clinical severity classifications and population variant burdens.
We show platelet/coagulation gene deleterious variants to be commonly present and less well tolerated in patients with HHT than the general population.

Abstract
The abnormal vascular structures of hereditary hemorrhagic telangiectasia (HHT) often cause severe anemia due to recurrent hemorrhage, but HHT causal genes do not predict the severity of hematological complications. We tested for chance inheritance and clinical associations of rare deleterious variants in which loss-of-function causes bleeding or hemolytic disorders in the general population. In double-blinded analyses, all 104 patients with HHT from a single reference center recruited to the 100 000 Genomes Project were categorized on new MALO (more/as-expected/less/opposite) sub-phenotype severity scales, and whole genome sequencing data were tested for high impact variants in 75 HHT-independent genes encoding coagulation factors, or platelet, hemoglobin, erythrocyte enzyme, and erythrocyte membrane constituents. Rare variants (all gnomAD allele frequencies <0.003) were identified in 56 (75%) of these 75 HHT-unrelated genes. Deleteriousness assignments by Combined Annotation Dependent Depletion (CADD) scores >15 were supported by gene-level mutation significance cutoff scores. CADD >15 variants were identified in 38/104 (36.5%) patients with HHT, found for 1 in 10 patients within platelet genes; 1 in 8 within coagulation genes; and 1 in 4 within erythrocyte hemolytic genes. In blinded analyses, patients with greater hemorrhagic severity that had been attributed solely to HHT vessels had more CADD-deleterious variants in platelet (Spearman ρ = 0.25; P = .008) and coagulation (Spearman ρ = 0.21; P = .024) genes. However, the HHT cohort had 60% fewer deleterious variants in platelet and coagulation genes than expected (Mann-Whitney test P = .021). In conclusion, patients with HHT commonly have rare variants in genes of relevance to their phenotype, offering new therapeutic targets and opportunities for informed, personalized medicine strategies.
Introduction
Hereditary hemorrhagic telangiectasia (HHT) is a well-defined endothelial vasculopathy1 with established clinical diagnostic criteria, known causal genes, and expert consensus informing clinical practice across general and subspecialty management.2,3 Estimated to affect approximately 1.5 million individuals worldwide,4,5 HHT usually results from a heterozygous null allele in ACVRL1, ENG, or SMAD4 and is transmissible as an autosomal dominant trait.6 Evidence from early family-based analyses7-9 has been supported by decades of studies in patients10,11 and animal models,12-17 confirming that loss-of-function causes abnormal vascular structures, including telangiectasia and arteriovenous malformations (AVMs).
Telangiectasia and larger AVMs are characterized by defective vascular walls predisposing to hemorrhage. Individuals affected by HHT experience spontaneous, recurrent nosebleeds due to abnormal nasal vasculature and exhibit small, visible telangiectatic vessels that tend to develop on the lips, oral cavity, and finger pads.2,3 Many have long-term excellent health with modest hemorrhagic losses, although most experience nosebleeds sufficient to lead to iron deficiency anemia unless dietary iron intake is supplemented,18 and significant proportions require surgical interventional treatments and/or disease-modifying drugs such as antiangiogenic agents.2,3,19 -21 Patients are commonly found to have silent visceral AVMs, and screening/primary prevention strategies have led to improved life expectancy.22,23
As is typical in medicine, it remains impossible to predict which patients will develop complications prior to and/or despite preventative treatments. Vascular malformations are known to differ between affected members of the same family sharing the same HHT causal gene,24 while similar vascular abnormalities can have profoundly different impacts: hemorrhage that varies in severity of recurrent bleeds from nasal or gastrointestinal telangiectasia2,3 and rare but life-threatening acute hemorrhages from pulmonary or cerebral AVMs.25,26 Inflammation is not a prominent feature of HHT,18 and limited available data suggest that iron handling is appropriate.18 In one study, however, anemia was out of proportion to hemorrhagic iron losses in more than a quarter of consecutive hospital-reviewed patients, with evidence for reduced red blood cell (erythrocyte) survival in nearly half of these.27 Counterintuitively, in this hemorrhagic disease,28 age-adjusted incidence rates of venous thromboembolism (VTE) are several-fold higher in HHT than in the general population.29,30 Additionally, individuals affected by HHT who have VTE are more likely to have a major deep-seated infection that is a particular risk when venous blood can evade pulmonary capillary processing by passage through right-to-left shunts provided by pulmonary AVMs.31-35 Socioenvironmental exposures can aggravate HHT, as detailed elsewhere,27,28,32,36 -40 but only a proportion of patients with these added risk factors develop the respective clinical phenotypes. There are hints of familial predispositions27,29,32,36,37,40 supported by case series in which occasional individuals had coincidental non-HHT genetic contributors to their complications.27,29
We hypothesized that rare, high-impact variation in genes beyond the primary HHT-causative gene could play a role in disease manifestation and tested in an essentially unselected cohort of HHT patients who had undergone whole genome sequencing (WGS) through the National Health Service (NHS) 100 000 Genomes Project.
Methods
Clinical cohort
Patients attending the Hammersmith Hospital/West London Genomic Medicine Centre for management of HHT were recruited to the 100 000 Genomes Project41,42 if the family’s HHT pathogenic variant was not already known43,44 and they met the clinical diagnosis of HHT.45 The maximum number of patients was approached, and there was no bias in recruitment to patients with milder or more severe HHT features. Standardized clinical assessments included a detailed clinical history specifically focusing on aspects of the HHT phenotypes, any disproportionate or unexpected symptomatic manifestations, and hematological/biochemical assessments in hospital service laboratories as described.6,27,31,46,47
WGS
The 100 000 Genomes Project was set up by the UK Department of Health and Social Security in 2013 to sequence whole genomes from NHS patients recruited through 1 of 13 Genomic Medicine Centres. Patient/family DNA sampling was accompanied by phenotypic data entries and integration with NHS health records.41 HHT was successfully nominated for inclusion in 2015. During data model set up, human phenotypic ontology terms48 were defined to capture the full range of phenotypes observed in patients with HHT, totaling 301 different terms spanning disease manifestations, accessory, and incidental phenotypes.6,48 For each patient with HHT recruited between September 2016 and August 2019, relevant human phenotypic ontology terms were submitted to Genomics England after patient recruitment using Open Clinica and Genie.42
Genomics England performed all WGS using the Illumina WGS Service Informatics pipeline for sequence alignments to the National Center for Biotechnology Information Genome Reference Consortium Human (GRCh) build 38/hg3849 and variant calling as described.42,43 Anonymized outputs from Genomics England internal bioinformatics pipelines and analyses were examined in the Genomics England Research Environment through LabKey.42
Analytic framework
To augment numeric and clinical-level confidence, we blindly categorized the 104 patients with HHT and their WGS data in what we term a “toward personalized genomic interpretation” approach (Figure 1). This incorporates phenotypic severity scales to maximize information from small subgroups by generating scales in which individual patients are classified for each subphenotype as More severe than expected, As expected, and (if feasible) Less severe than expected, or Opposite phenotype (MALO).

Framework for studies “toward personalized genomic interpretations” (TPGI). MALO: More severe than expected for disease; As expected for disease; Less severe than expected for disease, and Opposite phenotype. *Gene selection by any broadly relevant set of panels such as PanelApp established for 100 000 Genomes Project interpretations50 suggested to include additional categories less relevant to phenotypes (as in current study) to control for methodological biases. Where TPGI demonstrates evidence of relevance across a patient cohort, this supports attention to a subsequent “for personalized genomic interpretations” (FPGI) stage to be developed within mainstream medicine. WES, whole exome sequencing; WGS, whole genome sequencing.
Framework for studies “toward personalized genomic interpretations” (TPGI). MALO: More severe than expected for disease; As expected for disease; Less severe than expected for disease, and Opposite phenotype. *Gene selection by any broadly relevant set of panels such as PanelApp established for 100 000 Genomes Project interpretations50 suggested to include additional categories less relevant to phenotypes (as in current study) to control for methodological biases. Where TPGI demonstrates evidence of relevance across a patient cohort, this supports attention to a subsequent “for personalized genomic interpretations” (FPGI) stage to be developed within mainstream medicine. WES, whole exome sequencing; WGS, whole genome sequencing.
Disease subphenotype assignments
Based on updated clinical information on the recruited patients by 28 April 2021, continuous variables and severity scales as currently used in our service6,18,27,46,47 were assigned independently to all recruited patients, blinded to genotypes beyond the causal HHT variants emerging through clinical diagnostic pipelines43,44 :
- •
HHT-related bleeding was categorized as H0 (as expected for HHT); H1 (precipitated excessive bleeds, ie, severe bleeds precipitated by a pharmaceutical agent,21,28,40,51 or pregnancy-associated pulmonary AVM hemorrhage25,52 ); and H2 (spontaneous excessive bleeds). H2 was assigned for severe daily nosebleeds or gastrointestinal bleeds resulting in hemorrhage-adjusted iron requirements18 exceeding replacement feasibility using oral iron supplementation (resulting in intravenous iron and/or blood transfusion dependency)27 or for a major spontaneous hemorrhage from a pulmonary53,54 or cerebral26 AVM.
- •
Anemia was categorized as A0 (within expected range for hemorrhagic losses and iron intake18,27 ) and A1 (anemia out of proportion to the degree of hemorrhage based on hemorrhage-adjusted iron requirements18 and total iron intake from the diet and therapeutic oral or intravenous iron, as detailed by Thielemans et al27 ).
- •
The VTE categories were T0 (no VTE), T1 (drug, perioperative or otherwise precipitated VTE/pulmonary embolus), and T2 (spontaneous VTE/pulmonary embolus, using definitions as in Livesey et al30 ).
- •
Deep-seated infection categories were I0 or I1, with the deep-seated infection type listed for I1.31-33
Candidate modifier gene selection and analysis
Genes were primarily selected based on causal influences on coagulation, hemorrhage, and/or red blood cell (erythrocyte) survival exposed in the general population by bleeding disorders or congenital hemolytic anemias (supplemental Table 1).55,56 High-impact deleterious DNA variants are ill-suited to usual genome-wide and statistical associations due to allele rarity.57-60 To enhance statistical power yet retain a focus on variants most likely to be of clinical significance, the 75 selected genes were categorized by their most recognized role. These spanned the coagulation cascade, platelet biology, hemoglobin production, red cell (erythrocyte) membrane production, and red cell enzymes.
Variant-level analysis
Genes with variants were plotted using Circos61 on the Galaxy platform62 to generate a circular ideogram of GRCh38/hg38.49 The burden of usual genetic variation was compared between genes and gene categories using the gene damage index63 and by genic intolerance measured by the residual variation intolerance score.64
Variant deleteriousness was ranked by Combined Annotation Depletion (CADD) scores.65-67 Before examining the selected gene variants, a CADD score of >15 was selected as a threshold to indicate likely deleteriousness because it is commonly used in this regard,65,68 and in other studies, it performed better than other single measures of deleteriousness using the mutation significance cutoff (MSC) gene-level thresholds for variant-level predictions.68 For the current study, CADD scores were extracted from the University of Washington CADD server.65-67 Study methodology precluded integration within American College of Medical Genetics clinical care frameworks.59,60 Generally, variants were categorized by CADD score (>15: likely deleterious, incorporating start loss, stop gain, frameshift, splice donor/acceptor, and some missense and inframe insertion/deletion variants; 5-15: uncertain significance; <5: likely benign, comprising most synonymous, 5′ untranslated region, splice region and intronic variants). Gene-level adjustments used the MSC 90% and 95% scores,68 with outlier gene SPTA1 tested in both uncertain significance and likely deleterious categories.
Variant number, allele frequencies, and CADD scores and, separately, categorized patient numbers (converted to new codes to prevent inadvertent unblinding) were approved for export through the Research Environment AirLock under subproject RR42 (HHT-Gene-Stop).
Population-level analysis
As a comparator population, from the gnomAD 3.1.2 database comprising 76 156 genomes and exomes,69 for each of the 75 study genes we extracted the total number of variants and variants flagged by molecular type as predicted loss-of-function (pLOF). We did not include other variants listed by ClinVar70 as likely pathogenic/pathogenic. gnomAD and study variant rates were adjusted for the gnomAD-analyzed sequence length of the main protein coding transcript (corresponding to the curated RefSeq transcript from the UCSC Genome Browser71,72 ), adding 75 bp of exon-flanking sequence69 for each exon. In view of the differing approaches to classifications, it was not appropriate to directly compare rates of pLOF variants in gnomAD 3.1.2 and CADD-defined deleterious variants in the study population. Instead, differential rates were compared between the categories of hematologic genes, enabling less relevant categories to control for methodological sources of bias.
Data analysis
Summary and comparative statistics were generated using STATA IC versions 15.0 and 16.0 (Statacorp, College Station, TX) and GraphPad Prism 9 (GraphPad Software, San Diego, CA). One-way differences between categories were compared by χ2 test and between continuous variables using Kruskal-Wallis with Dunn’s multiple comparison test for preselected pairwise comparisons, in which P = .0285 was significant at false discovery rate = 0.05 level.73,74 Two-way analyses incorporating both data source and gene categories were performed using a 2-way analysis of variance. The strength and direction of association between ranked variables were examined using Spearman's rank-order correlation. Data were also represented using graphics generated in GraphPad Prism 9 (GraphPad Software) and STATA IC version 16.0.(Statacorp).
Ethical approval
The Project received ethical approval from the HRA Committee East England-Cambridge South (REC Ref 14 /EE/1112), and all individuals provided informed, written consent.
Results
Cohort demographics
One hundred four individuals with HHT were recruited from a single Genomic Medicine Centre, and all were included in the analyses. They were from 89 families, with 1 to 3 (median 1) affected individuals per family. At the time of recruitment, patient ages ranged from 17 to 87 years (median 50 years) and 66 (64%) were female; 56 of 89 (63%) families were found to have a heterozygous variant in the genes currently on HHT diagnostic testing panels (Figure 2A). In keeping with the “HHT gene negative” status of a subgroup of families on recruitment and ongoing analyses, in 33 of 89 (37%) families, no variants had been identified at the time of the current study.

HHT genes and phenotypic associations. (A) Endothelial vasculopathy genes and variants identified in current study cohort. Note that the major HHT genes are ACVRL1 (red) and ENG (green).6-8 SMAD46,9 is less common, and GDF2 was more recently described as HHT causal,44 whereas EPHB4 and RASA1 cause separate endothelial vasculopathies (CM-AVM2 and CM-AVM1) that overlap phenotypically with HHT. (B) Schematic of the cohort of 104 patients plotted on 4 separate axes for hemorrhage (H), anemia (A), thrombosis (T), and deep-seated infection (I). Ten deep-seated infections were in association with concurrent and presumed causative pulmonary AVMs (cerebral and spinal abscesses, spinal discitis, and septic arthritis due to polymicrobial flora, particularly anaerobic and aerobic commensals of the gastrointestinal and periodontal spaces31-33 ). Blue numbers indicate the number of the cohort with no events/no excess (H0, A0, T0, and I0), precipitated events (H1, A1, T1), and spontaneous events (H2, A2, T2, and I1). I1 were cerebral abscess (N = 6), spinal discitis (N = 2), spinal abscess (N = 1), septic arthritis (N = 1), recurrent bacterial endocarditis (N = 1), osteomyelitis (N = 1), and recurrent sepsis (N = 1). (C) Violin plots for ACVRL1 (left, red) and ENG (right, green) patients orientated on the 3 axes as in (B).
HHT genes and phenotypic associations. (A) Endothelial vasculopathy genes and variants identified in current study cohort. Note that the major HHT genes are ACVRL1 (red) and ENG (green).6-8 SMAD46,9 is less common, and GDF2 was more recently described as HHT causal,44 whereas EPHB4 and RASA1 cause separate endothelial vasculopathies (CM-AVM2 and CM-AVM1) that overlap phenotypically with HHT. (B) Schematic of the cohort of 104 patients plotted on 4 separate axes for hemorrhage (H), anemia (A), thrombosis (T), and deep-seated infection (I). Ten deep-seated infections were in association with concurrent and presumed causative pulmonary AVMs (cerebral and spinal abscesses, spinal discitis, and septic arthritis due to polymicrobial flora, particularly anaerobic and aerobic commensals of the gastrointestinal and periodontal spaces31-33 ). Blue numbers indicate the number of the cohort with no events/no excess (H0, A0, T0, and I0), precipitated events (H1, A1, T1), and spontaneous events (H2, A2, T2, and I1). I1 were cerebral abscess (N = 6), spinal discitis (N = 2), spinal abscess (N = 1), septic arthritis (N = 1), recurrent bacterial endocarditis (N = 1), osteomyelitis (N = 1), and recurrent sepsis (N = 1). (C) Violin plots for ACVRL1 (left, red) and ENG (right, green) patients orientated on the 3 axes as in (B).
Blinded to the variants identified in hematological genes, the recruited patients had been assigned to relevant scales for more extreme phenotypes (Figure 2B). Notably, in this group of patients selected purely due to lack of prior genetic test/absence of a known family HHT genotype and attendance at the UK reference center during recruitment to the 100 000 Genomes Project, 36/104 (35%) were categorized with severe hemorrhage, 29/104 (28%) with disproportionate anemia, and 8/104 (8%) had venous thromboembolic disease. Deep-seated infections affected 13/104 (13%).
There was no difference in respective placements on the 3 axes (hemorrhage-thrombosis, anemia or infection) for patients with ACVRL1 or ENG variants (Figure 2C).
Hematological gene-level variation
Within the cohort of 104 HHT patients, 105 variants were identified in the 75 selected hematological genes (supplemental Table 1). At least 1 variant was present in 52/104 (50%) of the study cohort, and 56/75 (75%) of genes had at least 1 variant identified in the study cohort. Variants were identified in genes on 21 chromosomes and were independent of the causal HHT gene (Figure 3A-B).
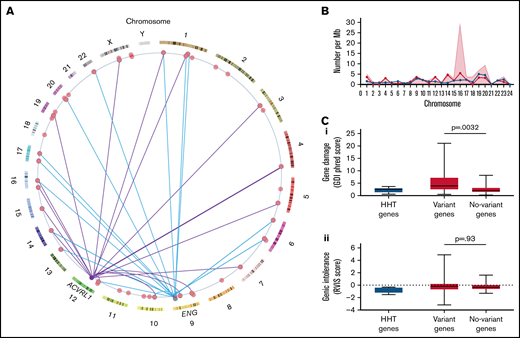
Hematological genes and variants. (A) Genome positions of the variant-containing genes in the study cohort on genome ideogram61,62 indicating positions of the 56 study genes with variants (red) and the two major HHT genes ACVRL1 and ENG. Variants present in patients with an identified variant in HHT genes are indicated for ACVRL1 (purple lines) and ENG (blue lines). To preserve anonymity, data for the single SMAD4, GDF2, and EPHB4 families are not illustrated. (B) Chromosomal distributions of variant-containing genes per 100 Mb of gDNA (blue circles/lines), number of variants per Mb (red shaded background), and variants with CADD score >15 (red circles/lines) per Mb of gDNA by chromosome.49 (C) Population-level burden of genetic damage in the 6 HHT panel genes (blue) and 75 study hematological genes (red), as detailed in supplemental Table 1. The study genes were subcategorized by variant presence (Variant genes; N = 56) and absence (No-variant genes; N = 19) in the study cohort, and P values were calculated by Dunn’s post Kruskal Wallis: (Ci) Gene damage index (GDI) phred scores, a genome-wide, gene-level metric of the mutational damage that has accumulated in the general population that performs well at removing exome variants in genes irrelevant to disease.63 (Cii) Residual variation intolerance scores (RVIS) that perform better for detection of genes in which newly identified variants are more likely cause a recognized disease.64
Hematological genes and variants. (A) Genome positions of the variant-containing genes in the study cohort on genome ideogram61,62 indicating positions of the 56 study genes with variants (red) and the two major HHT genes ACVRL1 and ENG. Variants present in patients with an identified variant in HHT genes are indicated for ACVRL1 (purple lines) and ENG (blue lines). To preserve anonymity, data for the single SMAD4, GDF2, and EPHB4 families are not illustrated. (B) Chromosomal distributions of variant-containing genes per 100 Mb of gDNA (blue circles/lines), number of variants per Mb (red shaded background), and variants with CADD score >15 (red circles/lines) per Mb of gDNA by chromosome.49 (C) Population-level burden of genetic damage in the 6 HHT panel genes (blue) and 75 study hematological genes (red), as detailed in supplemental Table 1. The study genes were subcategorized by variant presence (Variant genes; N = 56) and absence (No-variant genes; N = 19) in the study cohort, and P values were calculated by Dunn’s post Kruskal Wallis: (Ci) Gene damage index (GDI) phred scores, a genome-wide, gene-level metric of the mutational damage that has accumulated in the general population that performs well at removing exome variants in genes irrelevant to disease.63 (Cii) Residual variation intolerance scores (RVIS) that perform better for detection of genes in which newly identified variants are more likely cause a recognized disease.64
The variant burden was not specific to the study cohort because the gene damage index63 was also greater in the genes harboring variants in the study cohort (Figure 3Ci), providing evidence that these genes are more damaged in the general population. There was no difference between the variant and nonvariant genes for residual variation intolerance (Figure 3Cii).64
Variant deleteriousness
Variant CADD scores ranged from 1 to 42 (median 15; Figure 4A). Fifty-seven of 105 variants (54.3%) had CADD scores >15, indicating likely deleteriousness. At least 1 variant with a CADD score >15 was present in 38/104 (36.5%) of the study cohort. There was only 1 variant with a CADD score >15 that was identified in 2 members of the same family (an ACVRL1 family).
![Burden of deleterious variants by categories of genes and phenotypic severity profiles. (A) The CADD score distribution of variants identified in the study cohort (red) compared with gene-level MSC scores,68 indicating the lower limit of the 90% and 95% confidence intervals for deleterious CADD scores in individual genes (gray violin plots). Vertical dotted lines represent overall CADD scores 5 and 15 and the violin plot median and interquartile ranges. Note that CADD scores rank the deleteriousness for all 9 billion single nucleotide variants, and millions of small indels and splice site variants, based on machine learning trained on diverse genomic features derived from surrounding sequence context, gene model annotations, evolutionary constraint, epigenetic measurements, and functional predictions.65-67 (B) The 5 process-level categories, respective category contributions in the study cohort, are shown for the total number of genes, and all variants,, with each box representing the category’s percentage for the row, as indicated by the heat scale. (C) The burden of deleterious (CADD >15) variants in the 5 categories of genes for each predefined phenotypic subcohort. Filled pie-chart regions quantify the number of CADD >15 variants per patient in the category (gray if pooling across all gene categories; red if gene category specific; fully filled if 1 variant per patient). The 10 variants with CADD scores of 1 to 5 (likely benign) and 36 with CADD scores between 5 and 15 (of uncertain significance) are effectively included in the remaining white pie chart regions to enhance clarity. For each set of 6 pie charts, gene category placements are consistent. The upper row indicates total number of CADD >15 variants across all categories, and the remaining upper row pie charts focus on hemorrhage (upper middle for coagulation genes, upper right for platelet genes). The lower row presents the red cell gene categories (lower left for hemoglobin genes, lower middle for erythrocyte [red cell] membrane genes, and lower right for erythrocyte enzyme genes). The set of 6 gray-lined empty pie charts indicate there were no patients in the predefined A1 category. (D) Heat maps for number of variants per patient in each phenotypic subcohort, in which the precipitated and spontaneous H1/H2, T1/T2, and A1/A2 subcohorts have been pooled. Trends highlighted in the text are denoted by a white cross or black star. *P < .0286; **P < .01.](https://ash.silverchair-cdn.com/ash/content_public/journal/bloodadvances/6/13/10.1182_bloodadvances.2022007136/4/m_advancesadv2022007136f4.png?Expires=1767737818&Signature=Kxgjzsp52IseCID~687Q0NXOi9JfQtUcYk1UM~LRCfhmIh3zYlOI9-LRo24Yftd1wRaz0hxbSRwzOoIGef8uQFlIP-pBmPi63Q-wQkudXDaRLq3fjmzffNIoGSF8uMeX6Cd-rtyiSX3c3Pn9LgvwSovakugBgg9vN8gUaqwHrm8~9-xNtZqOxrFDaWtLVFzpbHcjM5ETQ5rJHDRjRZnuVu-mdzmI4SZ8ayrVDi2oNFBp9vzMJ5P0gAfPAHJaypH7gvVlD~FbULnKVa2tn0OwYoywX9bbFjMnY2~j9bo~DP0B0UfT2sevC0XCXFoh1wEBdyMVG-VdXyzAPmVd4A7VvA__&Key-Pair-Id=APKAIE5G5CRDK6RD3PGA)
Burden of deleterious variants by categories of genes and phenotypic severity profiles. (A) The CADD score distribution of variants identified in the study cohort (red) compared with gene-level MSC scores,68 indicating the lower limit of the 90% and 95% confidence intervals for deleterious CADD scores in individual genes (gray violin plots). Vertical dotted lines represent overall CADD scores 5 and 15 and the violin plot median and interquartile ranges. Note that CADD scores rank the deleteriousness for all 9 billion single nucleotide variants, and millions of small indels and splice site variants, based on machine learning trained on diverse genomic features derived from surrounding sequence context, gene model annotations, evolutionary constraint, epigenetic measurements, and functional predictions.65-67 (B) The 5 process-level categories, respective category contributions in the study cohort, are shown for the total number of genes, and all variants,, with each box representing the category’s percentage for the row, as indicated by the heat scale. (C) The burden of deleterious (CADD >15) variants in the 5 categories of genes for each predefined phenotypic subcohort. Filled pie-chart regions quantify the number of CADD >15 variants per patient in the category (gray if pooling across all gene categories; red if gene category specific; fully filled if 1 variant per patient). The 10 variants with CADD scores of 1 to 5 (likely benign) and 36 with CADD scores between 5 and 15 (of uncertain significance) are effectively included in the remaining white pie chart regions to enhance clarity. For each set of 6 pie charts, gene category placements are consistent. The upper row indicates total number of CADD >15 variants across all categories, and the remaining upper row pie charts focus on hemorrhage (upper middle for coagulation genes, upper right for platelet genes). The lower row presents the red cell gene categories (lower left for hemoglobin genes, lower middle for erythrocyte [red cell] membrane genes, and lower right for erythrocyte enzyme genes). The set of 6 gray-lined empty pie charts indicate there were no patients in the predefined A1 category. (D) Heat maps for number of variants per patient in each phenotypic subcohort, in which the precipitated and spontaneous H1/H2, T1/T2, and A1/A2 subcohorts have been pooled. Trends highlighted in the text are denoted by a white cross or black star. *P < .0286; **P < .01.
Burden of deleterious variants by categories of genes and phenotypic severity profiles. (A) The CADD score distribution of variants identified in the study cohort (red) compared with gene-level MSC scores,68 indicating the lower limit of the 90% and 95% confidence intervals for deleterious CADD scores in individual genes (gray violin plots). Vertical dotted lines represent overall CADD scores 5 and 15 and the violin plot median and interquartile ranges. Note that CADD scores rank the deleteriousness for all 9 billion single nucleotide variants, and millions of small indels and splice site variants, based on machine learning trained on diverse genomic features derived from surrounding sequence context, gene model annotations, evolutionary constraint, epigenetic measurements, and functional predictions.65-67 (B) The 5 process-level categories, respective category contributions in the study cohort, are shown for the total number of genes, and all variants,, with each box representing the category’s percentage for the row, as indicated by the heat scale. (C) The burden of deleterious (CADD >15) variants in the 5 categories of genes for each predefined phenotypic subcohort. Filled pie-chart regions quantify the number of CADD >15 variants per patient in the category (gray if pooling across all gene categories; red if gene category specific; fully filled if 1 variant per patient). The 10 variants with CADD scores of 1 to 5 (likely benign) and 36 with CADD scores between 5 and 15 (of uncertain significance) are effectively included in the remaining white pie chart regions to enhance clarity. For each set of 6 pie charts, gene category placements are consistent. The upper row indicates total number of CADD >15 variants across all categories, and the remaining upper row pie charts focus on hemorrhage (upper middle for coagulation genes, upper right for platelet genes). The lower row presents the red cell gene categories (lower left for hemoglobin genes, lower middle for erythrocyte [red cell] membrane genes, and lower right for erythrocyte enzyme genes). The set of 6 gray-lined empty pie charts indicate there were no patients in the predefined A1 category. (D) Heat maps for number of variants per patient in each phenotypic subcohort, in which the precipitated and spontaneous H1/H2, T1/T2, and A1/A2 subcohorts have been pooled. Trends highlighted in the text are denoted by a white cross or black star. *P < .0286; **P < .01.
Across all genes with variants, the CADD score delimiter of 15 captured the median 90% MSC threshold (Figure 4A), whereas the CADD score delimiter of 5 captured the 90% MSC threshold of all except 1 gene (Figure 4A). Variant overrepresentation in the red cell membrane production category reflected larger genes (supplemental Table 1) and was not apparent when restricting to CADD >15 variants (Figure 4B). All variants were rare, with median gnomAD 3.1.169 allele frequency <0.05% for each of the 5 categories and all gnomAD allele frequencies <0.003 (Figure 4B).
Phenotypic categories
When associations of gene variants with clinical phenotypes were examined, CADD >15 (likely deleterious) variants were identified in all severe hemorrhage, disproportionate anemia, spontaneous thrombosis, and severe deep-seated infection categories. Notably, CADD >15 variants were also present in each of the 4 “no event” categories (Figure 4C). Hemoglobin CADD >15 gene variants tended to distribute toward the “no event” categories (Figure 4C, lower left pie charts). By binary categories that pooled precipitated and spontaneous events, visual inspection suggested that erythrocyte membrane gene variants might be enriched in the 11 patients with severe deep-seated infections (Figures 4C, lower middle pie charts, and 5 D). Similarly, visual inspection suggested that erythrocyte enzyme variants might be enriched in the 6 patients with unprovoked VTE (Figure 4C, lower right pie charts, and D). However, these were based on small numbers and unsuited to statistical examination.
The hemorrhage and thrombosis phenotypes provided greater statistical power because they can be considered to represent opposing ends of a spectrum. There were trends for the higher CADD score variants in both coagulation (Figure 4C, upper middle pie charts) and platelet (Figure 4C, upper right pie charts) genes to be distributed toward the more severe hemorrhagic categories. Examining 3-point scales of severe hemorrhage/usual hemorrhage thrombosis, using nonparametric Spearman’s correlations, CADD >15 (likely deleterious) variants were enriched in patients with more severe hemorrhage for both platelet (ρ = 0.25; P = .008) and coagulation (ρ = 0.21; P = .024) gene categories (Figure 4D).
Quantitative trait analyses
While theoretically unsurprising that deleterious variants in platelet and coagulation genes would be associated with more severe HHT hemorrhage, this has not been previously acknowledged in HHT standards of care,2,3 prompting examination of further supporting evidence.
First, we examined associations between hemorrhage and red cell/coagulation quantitative traits in the cohort, comparing patients with no variants or CADD <5 variants (likely benign); CADD 5 to 15 variants (uncertain significance), and CADD >15 variants (likely deleterious; Figure 5). For hemoglobin (Figure 5A), red cell membrane (Figure 5B), and red cell enzyme (Figure 5C) genes, there was no discernible difference in any measured red cell index by the presence of variants: the median of each category was within the respective normal range. Similarly, for coagulation genes, there was no discernible difference in prothrombin time or activated partial thromboplastin time according to the presence of a variant (Figure 5D). The median value did lie outside of the normal range for platelet counts in individuals who had variants with platelet gene variants with CADD scores between 5 and 15 (Figure 5Ei), but mean platelet volume did not differ (Figure 5Eii), and the distinction was lost combining with higher impact variants (data not shown). We concluded that the variants were not clearly reflected in variability within patient quantitative traits at specifically sampled times.

HHT patient subcategories and variation. Quantitative phenotypic measurements categorized by presence, absence, and CADD score of variants. Data points represent all datasets captured in the 104 patients across their clinical assessments, plotted according to the presence or absence of variants in the genes for (A) hemoglobin production, (B) red bood cell membrane production, (C) red blood cell enzymes, (D) coagulation and (E) platelets as listed in supplemental Table 1. Two indices are provided for each category of genes, but there were also no differences observed between categories for other indices examined (data not shown).
HHT patient subcategories and variation. Quantitative phenotypic measurements categorized by presence, absence, and CADD score of variants. Data points represent all datasets captured in the 104 patients across their clinical assessments, plotted according to the presence or absence of variants in the genes for (A) hemoglobin production, (B) red bood cell membrane production, (C) red blood cell enzymes, (D) coagulation and (E) platelets as listed in supplemental Table 1. Two indices are provided for each category of genes, but there were also no differences observed between categories for other indices examined (data not shown).
Variant enrichment analyses
An association of deleterious variants in platelet and coagulation genes with more severe hemorrhage in patients with HHT predicts that deleterious variants in these genes may be less well tolerated and relatively depleted from HHT patient gene pools. To test, we contrasted platelet and coagulation gene variant burdens with the red cell genes in which variants had not displayed clear phenotypic associations and compared across the 5 categories to control for methodological bias.
While all variants were identified at similar respective frequencies in both study and gnomAD populations (Figure 6A), there was a median 19-fold (range 10.5- to 28.7-fold) enrichment for study cohort CADD >15 variants compared with the gnomAD pLOF deleterious variants, which exclude missense, inframe indel, splice region, and other likely pathogenic or pathogenic variants (Figure 6B). Enrichments appeared to differ according to gene categories (Figure 6B-C). Restricting to the 36 genes in which deleterious variants were defined in both cohorts and comparing to red cell genes standardized to 1.00 (95% CI, 0.24-1.77), the HHT burden of CADD >15 variants in coagulation and platelet genes was 0.40 (95% CI, 0.22-0.58; Mann-Whitney test P = .021; Figure 6D).
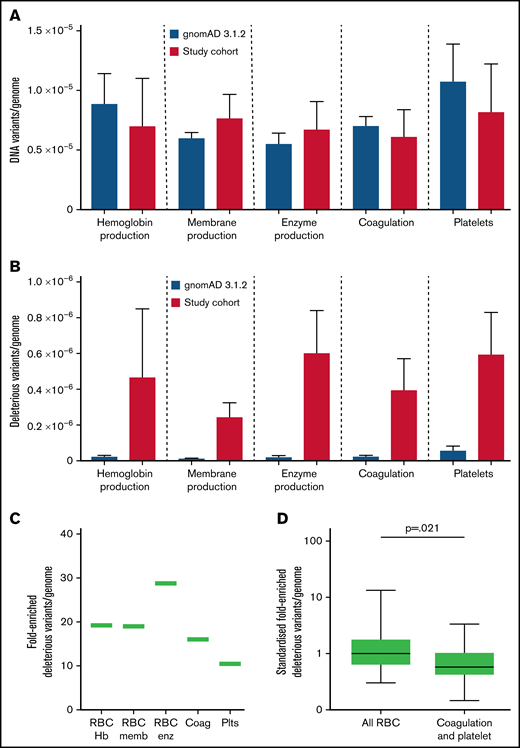
Variant burden in HHT cohort compared with general population. (A) Number of variants in the 75 study genes by category, within the gnomAD 3.1.2 dataset (blue) and current cohort (red) per genome. (B) gnomAD 3.1.2 dataset loss of function (pLOF) variants compared with CADD >15 genes in study cohort per genome, with mean and standard error illustrated. (C) Fold-enriched total number of deleterious variants per category, in all 75 genes, for HHT CADD >15 variants compared with pLOF variants in gnomAD 3.1.2 dataset.69 (D) Comparison of fold-enriched deleterious variants limiting to HHT CADD >15 variants and gnomAD pLOF variants in the same genes. P value calculated by Mann-Whitney test.
Variant burden in HHT cohort compared with general population. (A) Number of variants in the 75 study genes by category, within the gnomAD 3.1.2 dataset (blue) and current cohort (red) per genome. (B) gnomAD 3.1.2 dataset loss of function (pLOF) variants compared with CADD >15 genes in study cohort per genome, with mean and standard error illustrated. (C) Fold-enriched total number of deleterious variants per category, in all 75 genes, for HHT CADD >15 variants compared with pLOF variants in gnomAD 3.1.2 dataset.69 (D) Comparison of fold-enriched deleterious variants limiting to HHT CADD >15 variants and gnomAD pLOF variants in the same genes. P value calculated by Mann-Whitney test.
Discussion
We have shown for 75 hematological genes in which variants can cause heritable human disease, that deleterious variants are commonly found within populations. Despite each variant individually being rare (allele frequency <0.3%), overall, more than a third of unselected patients with HHT, an inherited vasculopathy that places them at risk of hemorrhage and anemia, had at least 1 likely deleterious variant in diverse genes that could augment or modify these disease complications. Patients with more severe hemorrhage that had been attributed solely to their HHT had a higher number of rare, deleterious variants in unrelated platelet and coagulation genes located across the genome. Additionally, there were fewer deleterious variants in platelet and coagulation genes than expected, supporting an interpretation that rare variation leading to a propensity for higher degree of bleeding may not be as well tolerated in HHT as in the general population.
Most attention on the potential of DNA sequencing to personalize medicine focuses on discovery of novel genetic causes of disease75,76 and development of polygenic risk scores from large-scale studies identifying common variation across blocks of genes coinherited in linkage disequilibrium77 that can direct attention to novel cis-regulatory elements.78,79 The presented approach offers an alternate and accelerated route to the clinic by proceeding from genes already known to have functional impact in processes potentially relevant to the patient. Although a small proportion of rare deleterious variants causes recognized human diseases, most do not, either because they are not present at sufficient zygosity or because they are not in an appropriate patient/environment milieu to be exposed above an essentially compensated perturbation to normal physiology. Major databases emphasize the very high rates of rare deleterious variants in the human general population69 as well as the necessity to use novel analytic methods57 in comparison with more common variant analyses that more readily meet genome-wide significance scores in genomes and transcriptomes.78,79 The current study offers an indicative example of how aberrant physiology imposed by an endothelial vasculopathy appears to augment the impact of variants in separate systems that might otherwise be clinically insignificant. More generally, the approach can be adopted in a framework of personalized genomic interpretations (PGIs) either in “toward PGI” studies as in the current manuscript to provide statistical support or “for PGI” studies to deliver what is genuinely personalized (N = 1 medicine) (Figure 1).
Strengths of the study include WGS of a respectable number of patients with HHT with detailed phenotypic characterization, spanning a range of severity phenotypes. Unusually for a hospital-recruited population, not all were referred because of personally severe features, with some presenting through family-based screening programs. Nevertheless, a weakness of the study is that the group did have a bias toward a hospital presentation, and we cannot rule out that the burden of deleterious rare variants would be lower in a community-recruited population, potentially with milder HHT phenotypic spectra. That said, the cohort was not recruited to the 100 000 Genomes Project because of a bleeding, anemia, thrombotic, or infective phenotype but instead because they met diagnostic criteria for a separate disease, the endothelial vascular dysplasia of HHT. As such, they provide an important window on the potential for similar scale, WGS-based high-definition analyses in other diseases in which phenotypes could be modified by concurrent, otherwise minor diatheses.
All variants identified were rare, with minor allele frequencies <0.5%. Figure 3A indicates that with 1 exception (AKI), there was no reason for variants to segregate with HHT because almost all variant-containing genes were widely separated from the patient’s HHT gene, usually on a different chromosome. Study findings could be extended by incorporating additional genes and categories, and in later individual-level considerations, it may be helpful to distinguish genes associated with dominant phenotypes (such as ANK1 and SPTB) from others in which heterozygous variants are recessive. Further, it is not the place of the current study to explore how these and the wider variants might change HHT clinical practice. Such considerations with patient-level integrations are underway through the NHS Rare Disease Collaborative Network for HHT and Genomics England Clinical Interpretation Partnership (Figure 1). That said, some overview comments are appropriate:
- •
11/104 patients with HHT were heterozygous for a total of 11 deleterious variants (10 unique variants, 10 different families), in genes in which deficiency is known to impact on platelet function leading to bleeding disorders. Furthermore, these variants were found more commonly in patients defined as having more severe hemorrhage either spontaneously or precipitated, for example, by pregnancy, antiplatelet agents, anticoagulants, or iron. Currently no attention in HHT management focuses on platelet disorders, yet the current study suggests that such considerations alongside modifications to commonly prescribed drugs may be relevant to at least 10% of patients with HHT.
- •
Similarly, 13/104 patients with HHT were heterozygous for a total of 14 deleterious variants (all unique variants and in different families) in genes in which deficiency is known to impact on the coagulation cascade. The data suggest that this may be relevant to >12% of patients with HHT.
- •
24/104 patients with HHT were heterozygous for a total of 32 rare deleterious variants (all unique) in genes in which deficiency is associated with inherited hemolytic anemias due to an increased rate of red cell destruction. Again, currently no attention in HHT anemia management focuses on extending the lifespan of endogenous erythrocytes becauase they suffer additional stresses on passage through HHT vasculature. Cross-over strategies with hemolytic anemias may be relevant to 1 in 4 patients with HHT, with particular attention directed to the subgroup of patients with HHT currently receiving intense, intravenous iron regimens on a weekly or near-weekly basis.2,16,19,20
The data suggest that there was no a priori reason why the study cohort had their rare, deleterious variants. Instead, comparison with population-level databases predict comparable burdens in other patient populations, drawing attention to new foci for research. For example, whereas genetic variants predisposing to pathogenic venous thromboses are usually assumed to encode components and mediators of the coagulation cascade, the current cohort suggested a possible trend with erythrocyte enzyme variants, and there has been some discussion of thrombosis in red cell enzymopathy fields.80 Opportunities to test current associations will be enhanced if enzymopathy genes are included in gene panels for VTE and further scientific examination appears warranted. Similarly, the observed enrichment of deleterious erythrocyte membrane gene variants in patients experiencing severe deep-seated infection warrants further study in the setting of the common (daily) bacteremias that can seed abscesses by currently unknown mechanisms.31,81 Mechanistic examination of whether erythrocyte membrane changes modify macrophage opsonization rates82 may influence clinical risk assessments, resulting in extension or restriction of HHT patient cohorts for whom prophylactic antibiotics are recommended.3,32,33,53 Notably, in both the study cohort and the gnomAD 3.1 population, the greatest proportion of variants was for the red cell membrane category, in which relevance to evolutionary fitness could be postulated.
We conclude that the potential to unmask pathophysiologically relevant processes is augmented by categorizing patients using severity scales that additionally influence risk-benefit considerations inherent in therapeutic provision. Accelerated pathways to more informed clinical trial design and personalized medical care can be the expected outcome of WGS when analytics focus on rare deleterious variants for secondary clinical phenotypes that matter to patients and health care services.
Acknowledgments
The authors thank the National Health Service staff of the West London Genomic Medicine Centre and the families for their willing participation.
This research was made possible through access to the data and findings generated by the 100 000 Genomes Project. The 100 000 Genomes Project is managed by Genomics England Limited (a wholly owned company of the Department of Health and Social Care). The 100 000 Genomes Project is funded by the National Institute for Health Research (NIHR) and NHS England. The Wellcome Trust, Cancer Research UK, and the Medical Research Council have also funded research infrastructure. The 100 000 Genomes Project uses data provided by patients and collected by the National Health Service as part of their care and support.
This research was co-funded by the NIHR Imperial Biomedical Research Centre. The views expressed are those of the authors and not necessarily those of funders, the NHS, the NIHR, or the Department of Health and Social Care.
Authorship
Contribution: K.E.J. co-developed the project design, selected gene categories and genes, performed all data analysis within the Genomics England Research Environment (including variant frequency assignments in gnomAD 3.1), exported anonymized datasets for numerical interrogation, retrieved all CADD scores, performed quantitative trait association studies, contributed content to Figures 4 and 5, and contributed to manuscript writing; E.O. and S.B. assisted with patient evaluations; F.N., K.O., and K.F. recruited patients; M.S. and G.A.T. processed patient samples; G.A.T., T.F., J.R., and C.L.S. contributed to project set up at West London Genomic Medicine Centre and patient recruitment; C.M.M. contributed to coagulation discussions; N.C. and D.M.L. contributed to red cell discussions; M.J.C. set up and F.B.-P. facilitated anonymized analyses within the Genomics England Research environment; Genomics England Research Consortium performed WGS, sequence alignments, and variant calling; C.L.S. set up the HHT-specific projects with Genomics England, the Respiratory Clinical Interpretation Partnership (GeCIP), and at West London Genomic Medicine Centre, reviewed the patients, categorized phenotypic severities, co-developed the project design, extracted gnomAD 3.1.2 and UCSC data, performed all remaining data analyses, generated the figures, and wrote the manuscript; K.E.J., C.M.M., N.C., D.M.L., and C.L.S. contributed to manuscript revisions; all authors reviewed and approved the final manuscript; and C.L.S. is responsible for the overall content as guarantor.
The complete list of the members of the Genomics England Research Consortium appears in “Appendix.”
Conflict-of-interest disclosure: The authors declare no competing financial interests.
Correspondence: Claire L. Shovlin, National Heart and Lung Institute, Imperial Centre for Translational and Experimental Medicine, Imperial College London, Hammersmith Campus, Du Cane Rd, London W12 0NN, UK; e-mail: c.shovlin@imperial.ac.uk.
Appendix
The members of the Genomics England Research Consortium are: J. C. Ambrose, P, Arumugam, R. Bevers, C. R. Boustred, H. Brittain, G. C. Chan, T. Fowler, A. Giess, A. Hamblin, T. J. P. Hubbard, R. Jackson, M. Kayikci, A. Kousathanas, L. Lahnstein, S. E. A. Leigh, I. U. S. Leong, F. J. Lopez, F. Maleady-Crowe, M. McEntagart, F. Minneci, N. Murugaesu, P. O‘Donovan, C. A. Odhams, D. Perez-Gil, M. B. Pereira, J. Pullinger, T. Rahim, A. Rendon, T. Rogers, K. Savage, K. Sawant, R. H. Scott, A. Siddiq, A. Sieghart, S. C. Smith, A. Stuckey, M. Tanguy, A. L. Taylor Tavares, S. R. Thompson, M. J. Welland, E. Williams (Genomics England, London, UK); F. Boardman-Pretty, M. A. Brown, M. J. Caulfield, S. Henderson, L. J. Jones, D. Kasperaviciute, L. Moutsianas, M. Mueller, A. C. Need, C. Patch, A. Sosinsky, E. R. A. Thomas, A. Tucci, K. Witkowska, S. M. Wood (Genomics England, London, UK; and William Harvey Research Institute, Queen Mary University of London, UK).

