

Key Points
Live imaging of cellular events in the blood circulation reveals firm and transient interactions of platelets with neutrophils.
In response to immune complexes, platelets aggregate and neutrophils adhere to the cerebrovascular endothelium of FcγRIIATGN mice.
Abstract
Immune complexes form in systemic disorders such as rheumatological, autoimmune, and allergic diseases or in response to infections or medications. Severe acute respiratory syndrome coronavirus 2 (SARS-CoV-2) adenoviral vector vaccines have been associated with rare yet serious thrombotic complications in the brain due to the formation of immune complexes that activate platelets. There are currently no data visualizing the interplay of platelets with leukocytes and the brain vasculature endothelium in response to immune complexes. This is in part due to the absence of FcγRIIA in mice, a receptor for immune complexes implicated in these thrombotic incidents. Here, we describe and illustrate events at the cellular level that take place in the brain vasculature in response to systemic administration of surrogate immune complexes. We used Ly6gCre+/−::Rosa26-TdT+/−::CD41-YFP+/− mice expressing the FcγRIIA transgene and fluorescence in neutrophils and platelets. Using real-time videomicroscopy to capture high-velocity events in conjunction with unbiased computer-assisted analyses, we provide images and quantifications of the cellular responses downstream of FcγRIIA stimulation. We observed transient and stable platelet–neutrophil interactions, platelets forming thrombi, and neutrophil adhesion to blood vessel walls. This imaging approach in a quadruple transgenic animal model can be used for the study of the pathogenic roles of immune complexes in disease.
Introduction
Vaccination against severe acute respiratory syndrome coronavirus 2 (SARS-CoV-2) is the primary means of preventing severe coronavirus disease 2019 (COVID-19) and controlling the spread of the virus. However, certain vaccination platforms, such as the adenovirus ChAdOx1 nCoV-19 vaccine and Ad26.COV2.S vaccine, were associated with rare yet serious adverse events. These adverse events, regrouped under the name vaccine-induced thrombotic thrombocytopenia (VITT), include abnormal clotting (in particular, cerebral venous thrombosis and thrombocytopenia) that sometimes results in death. VITT was recently studied for similarities with heparin-induced thrombocytopenia (HIT), a thrombotic disorder triggered by the anticoagulant drug heparin. Similar to HIT,1 VITT is associated with the presence of platelet-activating antibodies against platelet factor 4 (anti-PF4), which contribute to the formation of immune complexes and platelet activation.2-7 Immune complexes also form in systemic lupus erythematosus, in anaphylaxis, or when microbial antigens enter the blood circulation in an immune host.8-10
Billions of platelets are produced each day to promote hemostasis and to prevent bleeding. Following an injury, platelets form a clot and recruit neutrophils to prevent potential infection.11,12 Such interactions are critical to neutrophil function because neutrophils fail to adequately adhere or migrate in the absence of interactions with platelets.13 The sole receptor for immunoglobulin G (IgG)-containing immune complexes (FcγR) expressed by human platelets is the low affinity receptor FcγRIIA, which is thereby the most abundantly expressed Ig receptor in blood.8,9,14 Of note, activation of platelet FcγRIIA is implicated in the initiation of procoagulant cellular responses observed in both HIT and VITT.2 -4,6
Methods
We generated Ly6gCre+/−::Rosa26-TdT+/−::CD41-YFP+/− triple transgenic mice to visualize live interactions between red fluorescent neutrophils and yellow fluorescent platelets. Given the absence of an IgG-recognizing receptor on the surface of murine platelets, we further introduced the human FcγRIIA gene into the genome of these reporter mice to generate quadruple FcγRIIATGN::Ly6gCre+/−:: Rosa26-TdT+/−::CD41-YFP+/− transgenic mice (supplemental Figure 1). To experimentally visualize cellular interactions taking place downstream of FcγRIIA stimulation, we modeled FcγRIIA activation by the intravenous injection of heat-aggregated IgG surrogate for immune complexes.10
Results and discussion
Circulating platelets and neutrophils in brain blood vessels were visualized through cranial windows at 100 frames/second using real-time videomicroscopy (supplemental Figure 2A). Two channels were recorded simultaneously, permitting the imaging of cellular interactions at high velocity. Large platelet aggregates, as determined by their volume and capacity to completely obstruct blood vessels, were observed in the brain following injection of immune complexes (Figure 1A-B, E, and G; supplemental Video 1). They appear unstable, as some were found to disintegrate (supplemental Video 4). During a 1-hour session of imaging through a cranial window (covering an area of ∼19.5 mm2 above the cortex), an average of 3 aggregates, with a mean size of 427 µm2, was observed for each mouse (n = 6) (Figure 1A-B). Notably, neutrophils were found trapped in some of the platelet aggregates (Figure 1C-D, H, and J; supplemental Video 2). As previously reported,10 platelet aggregates were not seen in mice injected with the diluent (Figure 1F and I; supplemental Video 3) or mice lacking FcγRIIA expression and injected with either the diluent (supplemental Video 4) or immune complexes (supplemental Video 5).
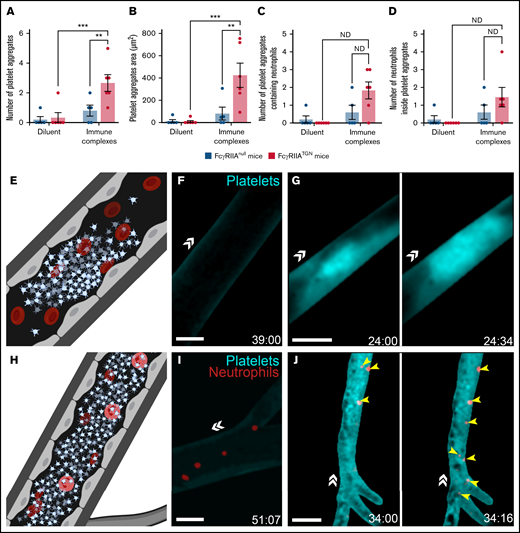
Platelet aggregation and trapped neutrophils in response to immune complexes in FcγRIIATGN mice. (A) The number of platelet aggregates observed in response to immune complexes or diluent in both FcγRIIAnull mice (dark blue) and FcγRIIATGN mice (pink) (n = 5-6 mice for each condition). (B) Mean platelet aggregate area in response to immune complexes or diluent in both FcγRIIAnull mice (dark blue) and FcγRIIATGN mice (pink) (n = 5-6 mice for each condition). (C) Mean number of platelet aggregates containing at least 1 neutrophil in both FcγRIIAnull mice (dark blue) and FcγRIIATGN mice (pink) (n = 5-6 mice for each condition). ND, statistical test not defined because of the absence of platelet aggregates in 1 of the groups of mice. (D) Mean number of neutrophils inside platelet aggregates in both FcγRIIAnull mice (dark blue) and FcγRIIATGN mice (pink) (n = 5-6 mice for each condition). ND, statistical test not defined because of the absence of platelet aggregates in 1 of the groups of mice. (E) Schematic representation of thrombotic events observed with a high-speed widefield fluorescence microscope in the brain of FcγRIIATGN mice injected intravenously with immune complexes. (F) Absence of platelet aggregates in FcγRIIATGN::Ly6gCre+/−::Rosa26-TdT+/−::CD41-YFP+/− mice injected with diluent (n = 6 mice). (G) Formation of platelet aggregates (cyan) in FcγRIIATGN::Ly6gCre+/−::Rosa26-TdT+/−::CD41-YFP+/− mice injected with immune complexes leads to obstruction of blood vessels (n = 6 mice). (H) Schematic representation of neutrophils trapped in platelet aggregates observed in the brain of FcγRIIATGN mice injected intravenously with immune complexes. (I) Platelets (cyan) and neutrophils (red) circulating in the brain of FcγRIIATGN::Ly6gCre+/−::Rosa26-TdT+/−::CD41-YFP+/− mice injected with diluent. (J) Platelet aggregates (cyan) can trap neutrophils (red, yellow arrows) (n = 5 mice of 6). Bars show mean ± SEM. Two-way ANOVA with repeated measures followed by a post-hoc Holm-Bonferroni test (A-B). *P < .05; **P < .01; ***P ≤ .001. Bars represent 50 µm. The direction of blood flow is indicated with double white arrowheads. Time following the injection of immune complexes is indicated in the inferior right corner (00:00 = minutes:seconds).
Platelet aggregation and trapped neutrophils in response to immune complexes in FcγRIIATGN mice. (A) The number of platelet aggregates observed in response to immune complexes or diluent in both FcγRIIAnull mice (dark blue) and FcγRIIATGN mice (pink) (n = 5-6 mice for each condition). (B) Mean platelet aggregate area in response to immune complexes or diluent in both FcγRIIAnull mice (dark blue) and FcγRIIATGN mice (pink) (n = 5-6 mice for each condition). (C) Mean number of platelet aggregates containing at least 1 neutrophil in both FcγRIIAnull mice (dark blue) and FcγRIIATGN mice (pink) (n = 5-6 mice for each condition). ND, statistical test not defined because of the absence of platelet aggregates in 1 of the groups of mice. (D) Mean number of neutrophils inside platelet aggregates in both FcγRIIAnull mice (dark blue) and FcγRIIATGN mice (pink) (n = 5-6 mice for each condition). ND, statistical test not defined because of the absence of platelet aggregates in 1 of the groups of mice. (E) Schematic representation of thrombotic events observed with a high-speed widefield fluorescence microscope in the brain of FcγRIIATGN mice injected intravenously with immune complexes. (F) Absence of platelet aggregates in FcγRIIATGN::Ly6gCre+/−::Rosa26-TdT+/−::CD41-YFP+/− mice injected with diluent (n = 6 mice). (G) Formation of platelet aggregates (cyan) in FcγRIIATGN::Ly6gCre+/−::Rosa26-TdT+/−::CD41-YFP+/− mice injected with immune complexes leads to obstruction of blood vessels (n = 6 mice). (H) Schematic representation of neutrophils trapped in platelet aggregates observed in the brain of FcγRIIATGN mice injected intravenously with immune complexes. (I) Platelets (cyan) and neutrophils (red) circulating in the brain of FcγRIIATGN::Ly6gCre+/−::Rosa26-TdT+/−::CD41-YFP+/− mice injected with diluent. (J) Platelet aggregates (cyan) can trap neutrophils (red, yellow arrows) (n = 5 mice of 6). Bars show mean ± SEM. Two-way ANOVA with repeated measures followed by a post-hoc Holm-Bonferroni test (A-B). *P < .05; **P < .01; ***P ≤ .001. Bars represent 50 µm. The direction of blood flow is indicated with double white arrowheads. Time following the injection of immune complexes is indicated in the inferior right corner (00:00 = minutes:seconds).
Neutrophil interactions with the cerebrovascular endothelium were frequently observed in FcγRIIATGN mice injected with immune complexes. Neutrophils were never observed in the brain parenchyma. Two types of interactions within blood vessels walls were noted: weak adhesion/rolling (Figure 2A, neutrophil #2; supplemental Videos 6 and 8) and stationary, defined as moving in an area of <10 µm diameter (Figure 2A-C; supplemental Videos 6-8). Platelets often interacted with rolling (Figure 2A, neutrophil #2; supplemental Video 6) and strongly adhered neutrophils (Figure 2B-C; supplemental Videos 7-8). “Kiss and fly” interactions, defined as circulating platelets that bind to stationary neutrophils adhered to the endothelium and circulated again after a transient interaction, were frequently observed (Figure 2B-C; supplemental Videos 7-8).
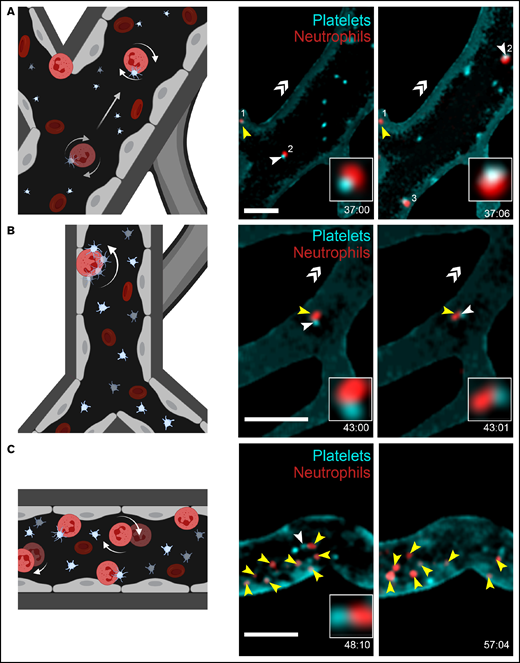
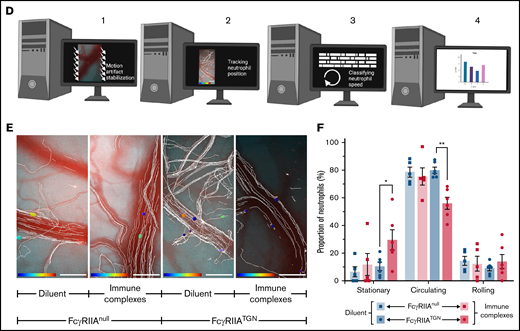
Platelet and neutrophil interactions observed in response to immune complexes. (A-C) Schematic representations (left panels) of different cellular interactions recorded in the brain of both FcγRIIATGN and FcγRIIAnull (Ly6gCre+/−::Rosa26-TdT+/−::CD41-YFP+/−) mice injected with immune complexes and observed with a high-speed widefield fluorescence microscope (right panels). (A) Platelet (cyan) and neutrophil (red) interactions can be associated with partial adhesion (rolling) of neutrophils (neutrophil 2) on blood vessels. (B) “Kiss and fly interaction,” in which an adhered neutrophil (red) briefly interacts with circulating platelets (cyan). (C) Neutrophils (red) adhere to blood vessels in response to immune complexes. Circulating platelets (cyan) interact (white arrows) with both immobilized and rolling neutrophils (yellow arrows). Bars represent 50 µm. The direction of blood flow is indicated with double white arrow heads. Time following the injection of immune complexes is indicated in the inferior right corner (00:00 = minutes:seconds or 00:00:00 = hours:minutes:seconds). Rolling and adhered neutrophils are indicated with yellow arrows, and neutrophil–platelet interactions are indicated with white arrows. (D) Schematic representation of the computer analysis used to track neutrophil trajectories and speed: (1) Image stabilization using Mathworks Matlab 2018b; (2) Neutrophil tracking performed with Bitplane Imaris 7.6 software; (3-4) Automated classification of trajectories using a program in Mathworks Matlab 2018b. (E) Recorded neutrophil trajectories (white lines) in the blood vessels of FcγRIIAnull and FcγRIIATGN mice injected with diluent or immune complexes (Bitplane Imaris 7.6 software). Neutrophils are color coded according to their speed: from dark blue (0 µm/sec) to dark red (4000 µm/sec). Bars represent 100 µm. (F) Number of neutrophils classified according to their speed: “stationary” for neutrophils moving in an area of <10 µm diameter; “rolling” when neutrophils circulate at ≤200 µm/s over 10 µm distance or more; and “circulating” in other cases. Bars represent mean ± SEM. Two-way ANOVA with repeated measures followed by a post-hoc Holm-Bonferroni test (D). *P < .05; **P < .01.
Platelet and neutrophil interactions observed in response to immune complexes. (A-C) Schematic representations (left panels) of different cellular interactions recorded in the brain of both FcγRIIATGN and FcγRIIAnull (Ly6gCre+/−::Rosa26-TdT+/−::CD41-YFP+/−) mice injected with immune complexes and observed with a high-speed widefield fluorescence microscope (right panels). (A) Platelet (cyan) and neutrophil (red) interactions can be associated with partial adhesion (rolling) of neutrophils (neutrophil 2) on blood vessels. (B) “Kiss and fly interaction,” in which an adhered neutrophil (red) briefly interacts with circulating platelets (cyan). (C) Neutrophils (red) adhere to blood vessels in response to immune complexes. Circulating platelets (cyan) interact (white arrows) with both immobilized and rolling neutrophils (yellow arrows). Bars represent 50 µm. The direction of blood flow is indicated with double white arrow heads. Time following the injection of immune complexes is indicated in the inferior right corner (00:00 = minutes:seconds or 00:00:00 = hours:minutes:seconds). Rolling and adhered neutrophils are indicated with yellow arrows, and neutrophil–platelet interactions are indicated with white arrows. (D) Schematic representation of the computer analysis used to track neutrophil trajectories and speed: (1) Image stabilization using Mathworks Matlab 2018b; (2) Neutrophil tracking performed with Bitplane Imaris 7.6 software; (3-4) Automated classification of trajectories using a program in Mathworks Matlab 2018b. (E) Recorded neutrophil trajectories (white lines) in the blood vessels of FcγRIIAnull and FcγRIIATGN mice injected with diluent or immune complexes (Bitplane Imaris 7.6 software). Neutrophils are color coded according to their speed: from dark blue (0 µm/sec) to dark red (4000 µm/sec). Bars represent 100 µm. (F) Number of neutrophils classified according to their speed: “stationary” for neutrophils moving in an area of <10 µm diameter; “rolling” when neutrophils circulate at ≤200 µm/s over 10 µm distance or more; and “circulating” in other cases. Bars represent mean ± SEM. Two-way ANOVA with repeated measures followed by a post-hoc Holm-Bonferroni test (D). *P < .05; **P < .01.
The large amount of raw video data generated during this study (>2 TB) and the presence of motion artifacts resulting from animal breathing and temporal drift was a major technical challenge to analyzing neutrophils trajectories. For this purpose, we designed an unbiased computer analytical method to quantitatively assess neutrophil interactions with the blood vessel wall (Figure 2D; supplemental Figure 2B-D). The whole video data set was corrected for motion artifacts using a high-throughput processing method relying on image registration.15,16 Thereafter, neutrophils were tracked and trajectories were subsequently analyzed. We next developed an unbiased computer analytical method to quantitatively assess neutrophil interactions with blood vessel walls (supplemental Figure 2C-D).15,16 The neutrophil speed was calculated in both FcγRIIAnull (Figure 2E) and FcγRIIATGN mice injected with the diluent (n = 5-6 mice/group) (Figure 2E; supplemental Video 9) and injected with immune complexes (n = 5-6 mice/group) (Figure 2E; supplemental Video 10). Speed was used to categorize each cell into 1 of the following 3 categories: (1) circulating, (2) rolling, or (3) firmly adhered neutrophils. Analysis confirmed a higher frequency of neutrophils engaged in firm adhesion in response to immune complexes only in FcγRIIA-expressing mice (Figure 2F). As expected, circulating neutrophils were less frequently observed when FcγRIIA was expressed (Figure 2F), consistent with their recruitment to the endothelium. The proportion of neutrophils weakly adhered/rolling were similar in all conditions (Figure 2F), suggesting that transient neutrophil interaction with the vessel wall is an expected event under normal conditions.
The imaging technology and computer-assisted data analysis software enabled live capture and quantification of cellular events as they occurred at high velocity in the blood circulation. The model used does not require injury to organs or vessels (eg, laser, puncture injuries, FeCl2 treatment), which contrasts with most mouse models developed for intravital examination of platelet or neutrophil activation. However, the challenges inherent to live imaging are amplified because numerous cellular interactions take place in blood vessels at high speed, and the exact anatomical locations where cellular interactions occur cannot be accurately predicted. Systemic administration of immune complexes was found to initiate platelet activation in the lungs and brain vasculature but not in the heart, liver, kidney, spleen, or ear vasculatures.10 In mice, although the process, which implicates both neutrophils and platelets, leads to systemic shock characterized by loss of consciousness, it is not lethal.9,10,17 Thus, this is an ideal animal model to examine cellular interactions between platelets and neutrophils that are, relevant to cerebral venous thrombosis induced by systemic immune complexes in the absence of damage or injury.
While platelet aggregation and formation of thrombi are obvious pathogenic causes of vascular occlusions and possibly death, the interaction between platelets and neutrophils is suggested to enhance neutrophil rolling and firm adhesion, potentially impacting the vascular endothelial cell wall and promoting inflammation.11-13 Platelet and neutrophil adhesion to blood vessels in response to immune complexes could potentially play a role in blood-brain barrier leakage, which may affect neuroinflammation and neuronal activity. Whether such cellular interactions can favor neurodegeneration is not yet known.
Our imaging strategy provides a live illustration of the events likely taking place in the brain in cases of cerebral venous thrombosis induced by formation of immune complexes. It further confirms the critical role of FcγRIIA in neutrophil adhesion, cellular interactions, and thrombotic events in the brain in response to immune complexes. Consistent with this, intravenous IgG is suggested to be useful for treating thrombotic complications in adverse events resulting from vaccination.18 A more direct inhibition of FcγRIIA or its signaling, such as interference in co-activation by αIIbβ3,10 12-lipoxygenase,19 Syk and immunoreceptor tyrosine-based activation motif signaling,20-22 or CalDAG-GEFI,21 may also prove useful. This model and its quantitative nature permit the assessment of therapeutic approaches in thrombotic events and cellular interactions in the brain and the blood-brain barrier interface.
Acknowledgments
Figures were created using Biorender. The authors thank Nadia Fortin (S.L.) and Sonia Francoeur (animal facility services) for technical help provided during this study.
This work was supported by a Project Grant from the Canadian Institutes of Health Research (CIHR 175367) (E.B. and L.F.). A.L. and E.B. are recipients of an investigator award from the Fonds de Recherche du Quebec–Santé (FRQS). A.L. is the recipient of awards from The Arthritis Society and the Fonds Pierre Borgeat from Université Laval.
Authorship
Contribution: A.L., I.A., S.L., and E.B. conceived and designed experiments; M.G., D.S., N.V., L.F., and S.L. contributed critical reagent, resources, and expertise; A.L., T.L., and M.B. performed experiments; A.L., M.B., and D.S. processed and analyzed data and were supervised by E.B.; A.L. and E.B. wrote the manuscript; and all authors critically reviewed the manuscript.
Conflict-of-interest disclosure: The authors declare no competing financial interests.
Correspondence: Eric Boilard, Centre de Recherche du Centre Hospitalier Universitaire de Québec, Faculté de Médecine de l’Université Laval and Centre ARThrite, 2705 Laurier Blvd, Room T1-49, Quebec, Canada G1V 4G2; e-mail: eric.boilard@crchudequebec.ulaval.ca.

